- Review of Basic Concepts in Statistics

Содержание
- 2. What is Statistics? The science of collecting, analyzing and making inference from the collected data. It
- 3. Statistic vs Statistics Statistic: It means a measured (or) counted fact (or) piece of information stated
- 4. Why Statistics? Statistics is used in many fields: Medical statistics Agricultural statistics Educational statistics Mathematical statistics
- 5. Types of Statistics Nazarbayev University
- 6. Descriptive vs Inferential Descriptive Statistics: Once the data have been collected, we can organize and summaries
- 7. Sample vs Population Information is gathered in the form of samples, or collections of observations. Samples
- 8. The Role of Probability Elements of probability allow us to quantify the strength or “confidence” in
- 9. Probability vs Inferential Statistics For a statistical problem, the sample along with inferential statistics allows us
- 10. Sampling Procedures Simple Random Sampling Experimental Design Nazarbayev University
- 11. Simple Random Sampling Implies that any particular sample of a specified sample size has the same
- 12. Experimental Design A set of treatments or treatment combinations becomes the populations to be studied or
- 13. Sampling Terms Collections of observations Set of single number statistics that describe a population, such as
- 14. Symmetrical Vs Skewed Data Skewed Mean, mode, and median Symmetrical Nazarbayev University
- 15. Skewness of Data Nazarbayev University
- 16. Skewness? Nazarbayev University
- 17. Measures of Location: Sample Mean Suppose that the observations in a sample are . The sample
- 18. Measures of Location: Sample Median The purpose of the sample median is to reflect the central
- 19. Measures of Location: Trimmed Means A trimmed mean is computed by “trimming away” a certain percent
- 20. Sample Range Q: What is the sample range for the following data? Nazarbayev University
- 21. Sample Standard Deviation Suppose that the observations in a sample are . The sample variance, denoted
- 22. Nazarbayev University
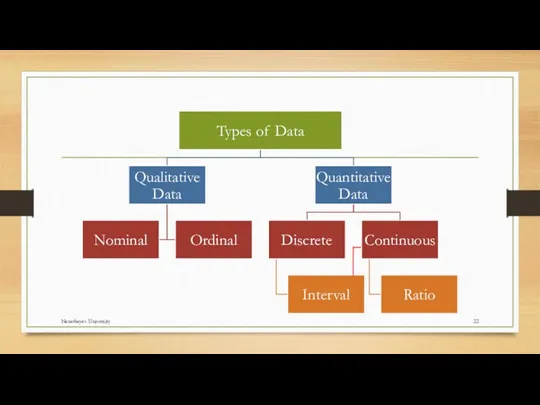
- 23. Level of Measurement Categorical (entities are divided into distinct categories): Binary variable: There are only two
- 24. Source: http://www.ncbi.nlm.nih.gov/pmc/articles/PMC4763618 Nazarbayev University
- 26. Скачать презентацию
What is Statistics?
The science of collecting, analyzing and making inference from
What is Statistics?
The science of collecting, analyzing and making inference from
Statistic vs Statistics
Statistic:
It means a measured (or) counted fact (or)
Statistic vs Statistics
Statistic:
It means a measured (or) counted fact (or)
Why Statistics?
Statistics is used in many fields:
Medical statistics
Agricultural statistics
Educational statistics
Mathematical statistics
And
Why Statistics?
Statistics is used in many fields:
Medical statistics
Agricultural statistics
Educational statistics
Mathematical statistics
And
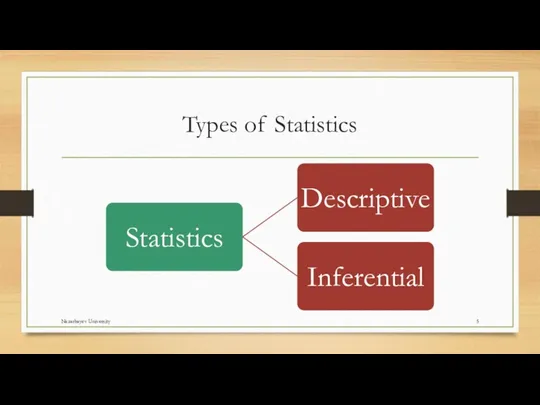
Types of Statistics
Nazarbayev University
Types of Statistics
Nazarbayev University
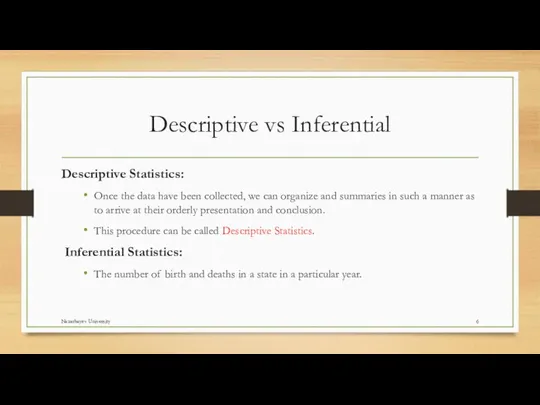
Descriptive vs Inferential
Descriptive Statistics:
Once the data have been collected, we can
Descriptive vs Inferential
Descriptive Statistics:
Once the data have been collected, we can
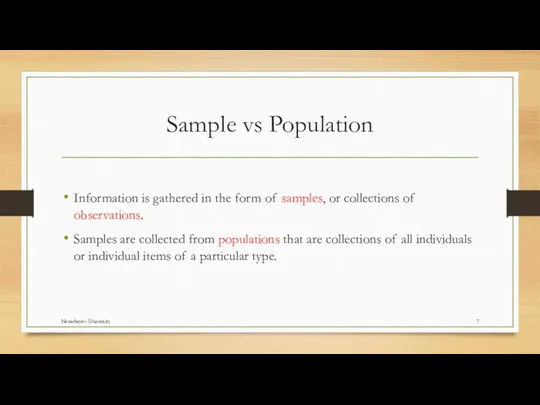
Sample vs Population
Information is gathered in the form of samples, or
Sample vs Population
Information is gathered in the form of samples, or
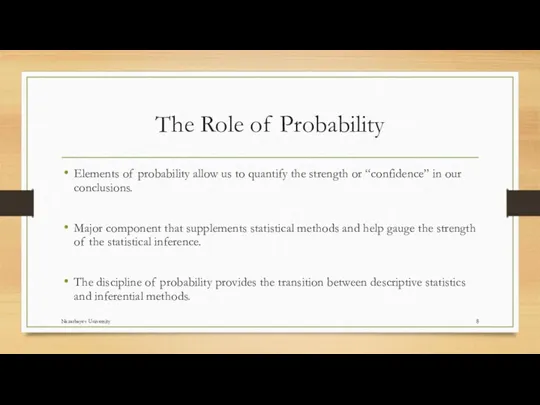
The Role of Probability
Elements of probability allow us to quantify the
The Role of Probability
Elements of probability allow us to quantify the
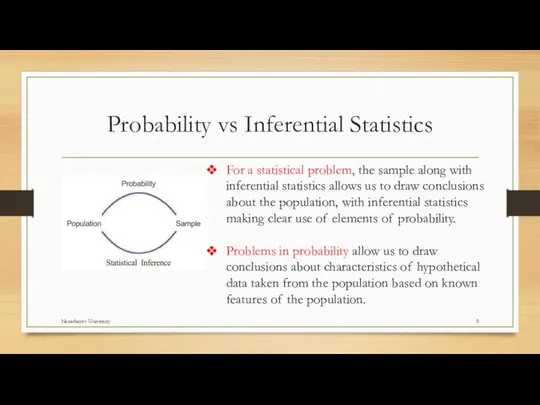
Probability vs Inferential Statistics
For a statistical problem, the sample along with
Probability vs Inferential Statistics
For a statistical problem, the sample along with
Sampling Procedures
Simple Random Sampling
Experimental Design
Nazarbayev University
Sampling Procedures
Simple Random Sampling
Experimental Design
Nazarbayev University
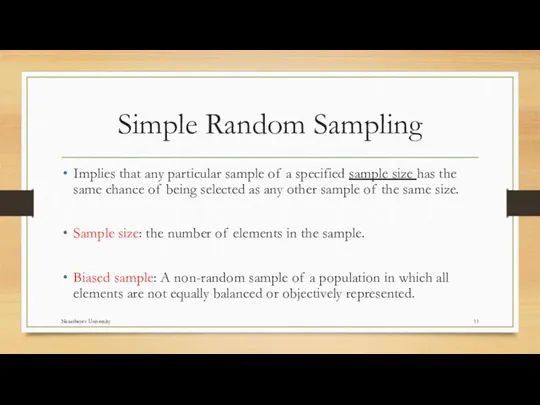
Simple Random Sampling
Implies that any particular sample of a specified sample
Simple Random Sampling
Implies that any particular sample of a specified sample
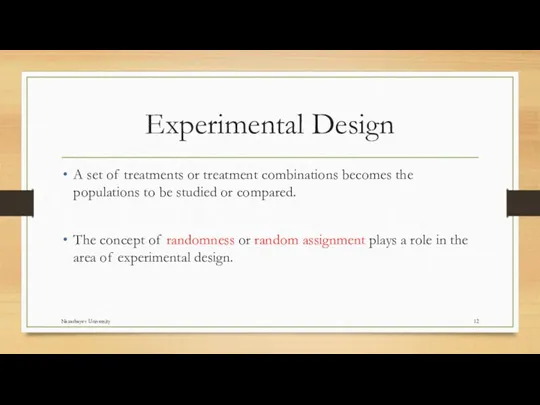
Experimental Design
A set of treatments or treatment combinations becomes the populations
Experimental Design
A set of treatments or treatment combinations becomes the populations
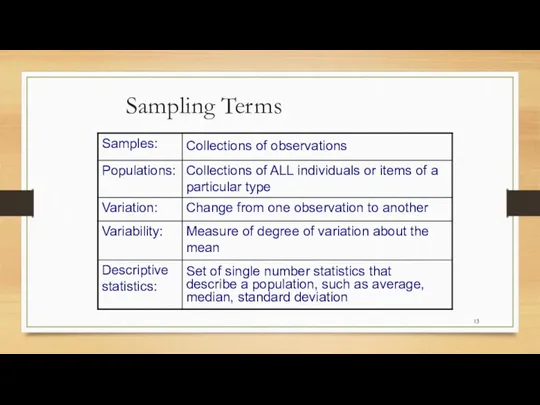
Sampling Terms
Collections of observations
Set of single number statistics that describe a
Sampling Terms
Collections of observations
Set of single number statistics that describe a
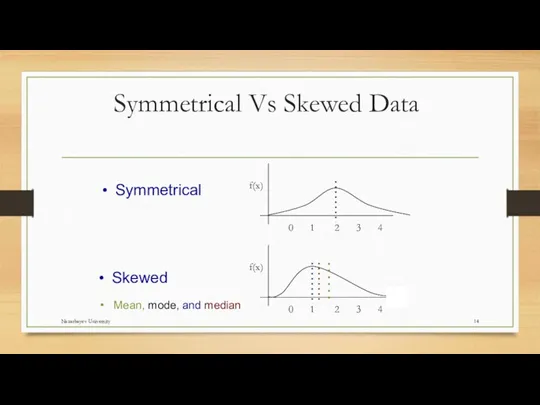
Symmetrical Vs Skewed Data
Skewed
Mean, mode, and median
Symmetrical
Nazarbayev University
Symmetrical Vs Skewed Data
Skewed
Mean, mode, and median
Symmetrical
Nazarbayev University
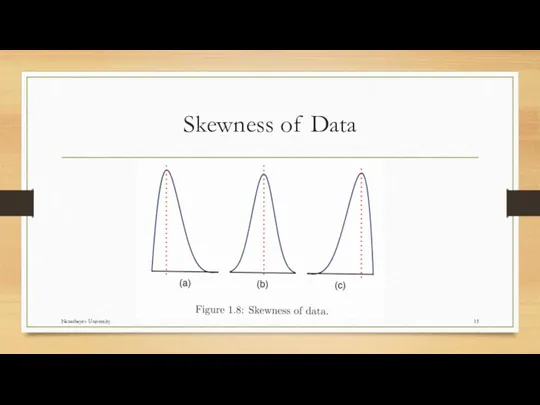
Skewness of Data
Nazarbayev University
Skewness of Data
Nazarbayev University
Skewness?
Nazarbayev University
Skewness?
Nazarbayev University
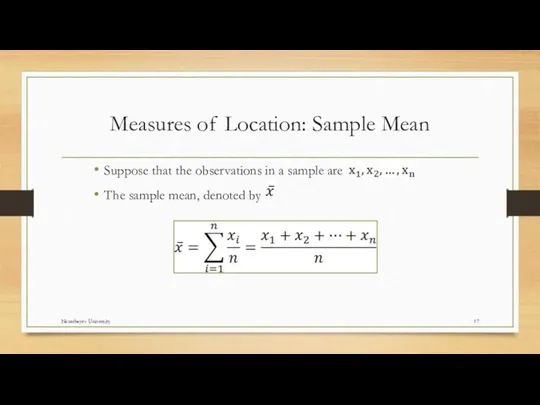
Measures of Location: Sample Mean
Suppose that the observations in a
Measures of Location: Sample Mean
Suppose that the observations in a
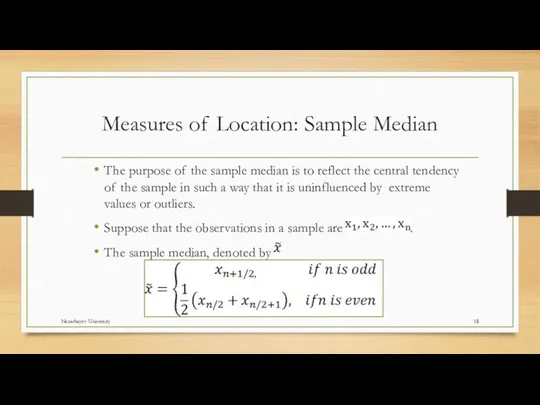
Measures of Location: Sample Median
The purpose of the sample median is
Measures of Location: Sample Median
The purpose of the sample median is
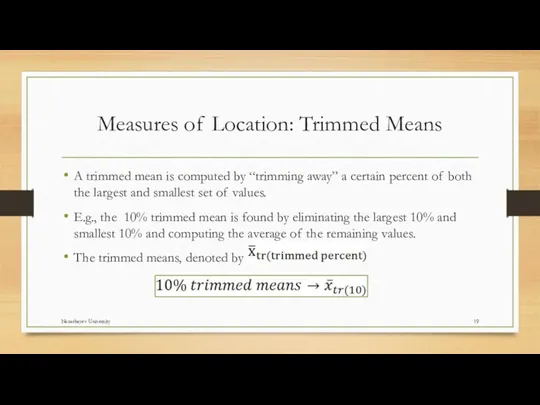
Measures of Location: Trimmed Means
A trimmed mean is computed by “trimming
Measures of Location: Trimmed Means
A trimmed mean is computed by “trimming
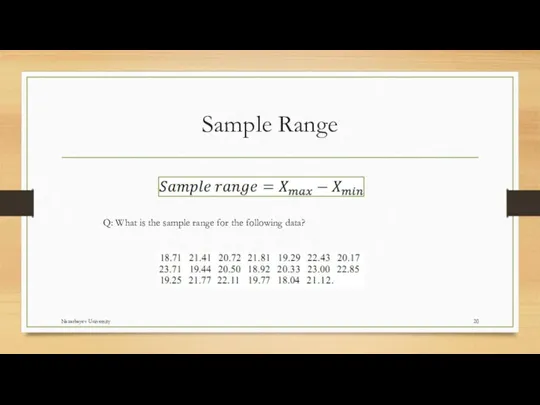
Sample Range
Q: What is the sample range for the following data?
Nazarbayev
Sample Range
Q: What is the sample range for the following data?
Nazarbayev
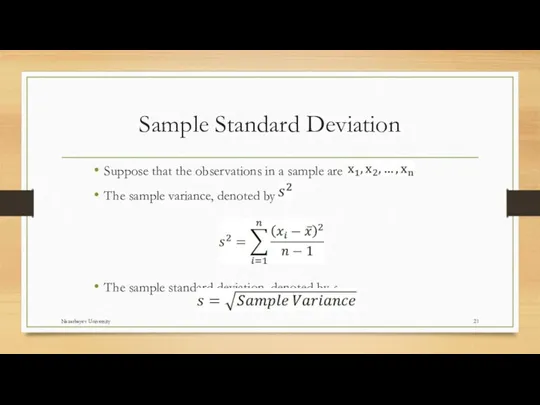
Sample Standard Deviation
Suppose that the observations in a sample are .
The
Sample Standard Deviation
Suppose that the observations in a sample are .
The
Nazarbayev University
Nazarbayev University
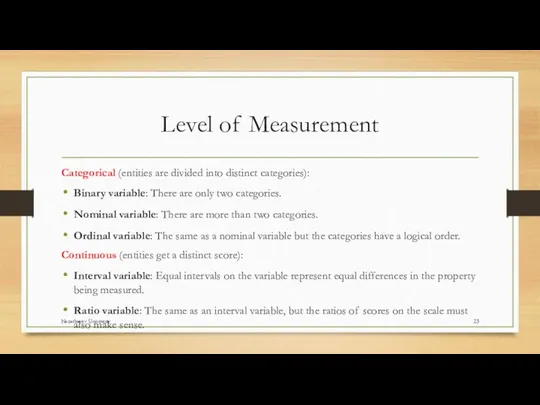
Level of Measurement
Categorical (entities are divided into distinct categories):
Binary variable:
Level of Measurement
Categorical (entities are divided into distinct categories):
Binary variable:
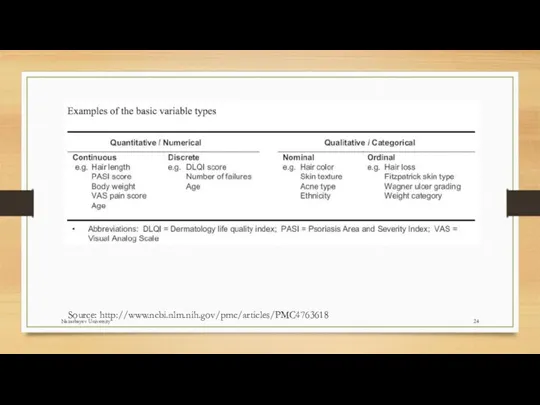
Source: http://www.ncbi.nlm.nih.gov/pmc/articles/PMC4763618
Nazarbayev University
Source: http://www.ncbi.nlm.nih.gov/pmc/articles/PMC4763618
Nazarbayev University
 Векторы. Тест. (Вариант 2)
 Правописание числительных – орфография на уроках математики (Интегрированный урок: русский язык + математика)
 Умножение десятичных дробей. Свойства умножения
 Решение тригонометрических уравнений
 Чётные и нечётные функции
 Осевая и центральная симметрия. Симметричность точек относительно прямой
 Урок – космическое путешествие по математике в 1 классе на тему: Решение примеров вида 15-
 Цифра и число 9
 Элементы математической статистики, комбинаторики и теории вероятностей. Формула бинома Ньютона
 Треугольник. Тест. Задания в группах
 Системы линейных неравенств с одним неизвестным. 9 класс
 Урок по математике в 1 классе. Части величин. Школа 2000 (автор учебника Л.Г. Петерсон)
 Мир фракталов. Творческий проект
 Перпендикулярные прямые
 открытый урок по математике на тему Площадь фигур 4 класс
 Число 10
 Метрологическое обеспечение производства
 презентация к уроку математики Цифра 1 и чичла 1, 2, 3, 4, 5,
 Рациональные числа
 Второй и третий признаки равенства треугольников. 7 класс
 Числовые ряды. Общие определения и свойства. Сходимость рядов. Признаки сходимости. (Семинар 25)
 Открытый урок математики во 2 классе и отчет за аттестационный период
 Урок математики в 1 классе по теме Вычитание
 Сложение отрицательных чисел
 Степени и корни
 Площадь фигуры
 Квадратные уравнения
 Презентация отчёта плана по самообразованию на тему: Занимательные математические игры в старшем дошкольном возрасте