- The normal distribution

Содержание
- 2. The Area under the curve The area under the curve represents everything: 100%.
- 3. The mean is in the middle. 50% of the data is below the mean. 50% of
- 4. Within one standard deviation P(-1
- 5. What percent of the data is between 0 and 1? 68% P(0 P(z P(z>1)
- 6. Part (Yellow) + Part (Brown) =100 100 - Part (Yellow) = Part (Brown) 100 – 84
- 7. Within two standard deviations P(-2 P(1 P(Z
- 8. The Normal Distribution A normal curve is bell shaped. The highest point on the curve is
- 9. Example 1 1,000 students take an intelligence test The mean is 450 and the standard deviation
- 10. Label the bell! The mean value of land and buildings per acre from a sample of
- 11. Label the bell! The mean value of land and buildings per acre from a sample of
- 12. Label the bell! The mean price of new homes from a sample of houses is $155,000
- 13. Convert x to z Z is the standardized value Z= Convert x = 55 with a
- 14. The Calculator Finding P(a 2nd VARS?DISTR Normalcdf In words: (lower limit, upper limit, mean, standard deviation)
- 15. Write the normalcdf for each µ=50 and σ=10 P(20 P(20 P(70 P(14
- 16. ∞ = 1E99 -∞ = -1E99 P(50 P(55 P(-∞ P(-∞
- 18. Скачать презентацию
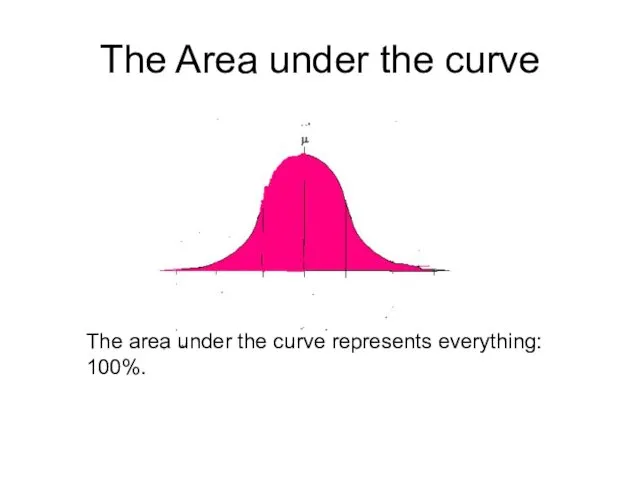
The Area under the curve
The area under the curve represents everything:
The Area under the curve
The area under the curve represents everything:
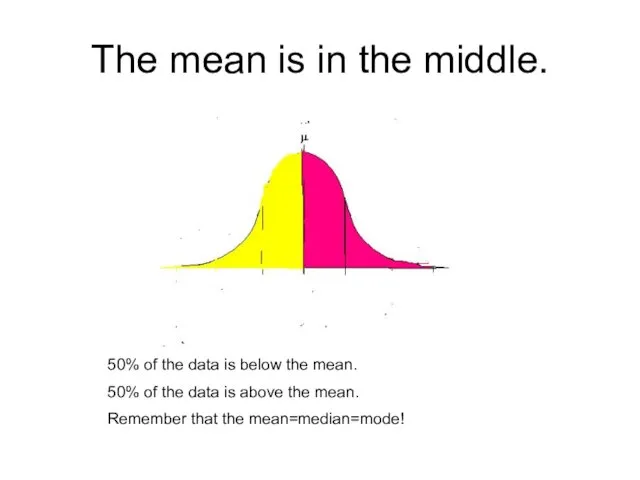
The mean is in the middle.
50% of the data is below
The mean is in the middle.
50% of the data is below
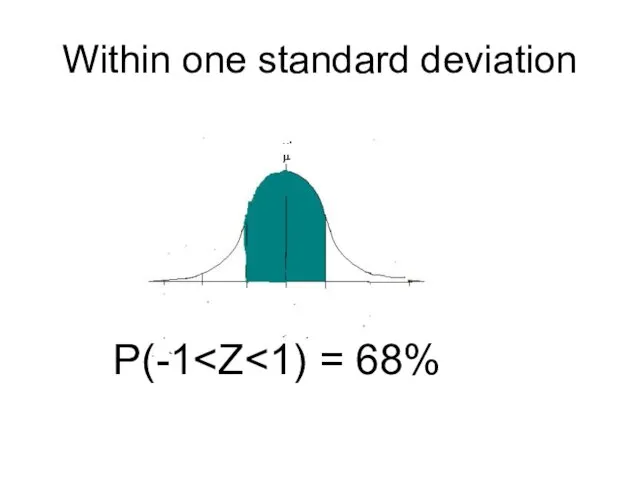
Within one standard deviation
P(-1
Within one standard deviation
P(-1
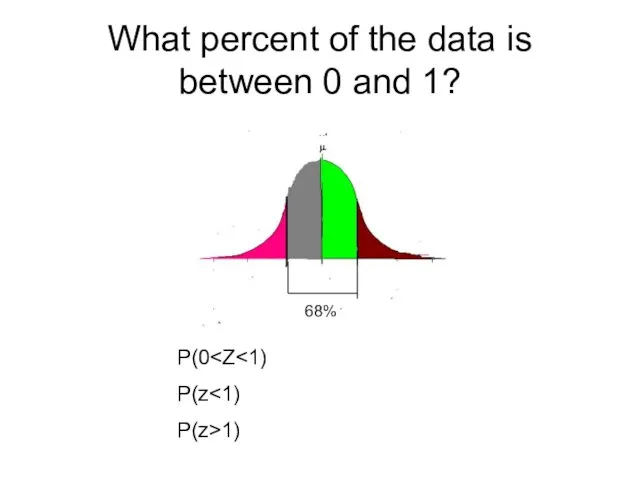
What percent of the data is between 0 and 1?
68%
P(0P(z<1)
P(z>1)
What percent of the data is between 0 and 1?
68%
P(0
P(z>1)
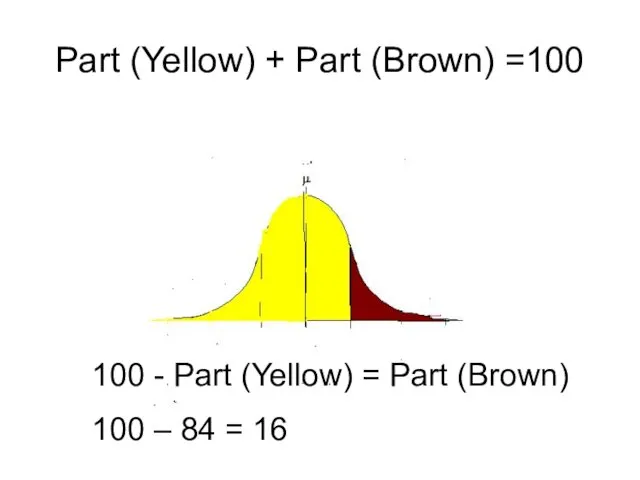
Part (Yellow) + Part (Brown) =100
100 - Part (Yellow) = Part
Part (Yellow) + Part (Brown) =100
100 - Part (Yellow) = Part
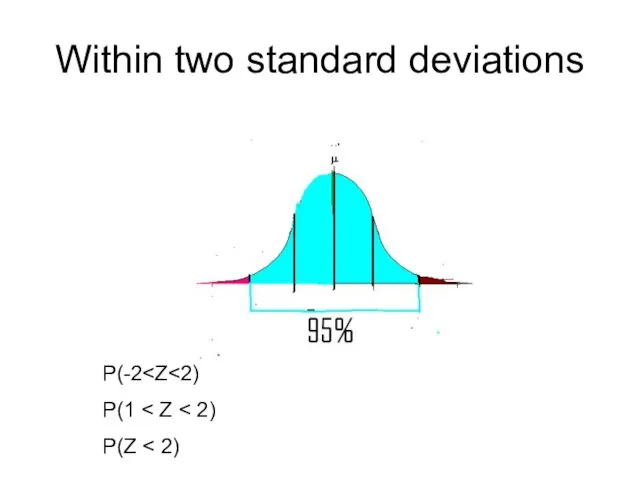
Within two standard deviations
P(-2P(1 < Z < 2)
P(Z < 2)
Within two standard deviations
P(-2
P(Z < 2)
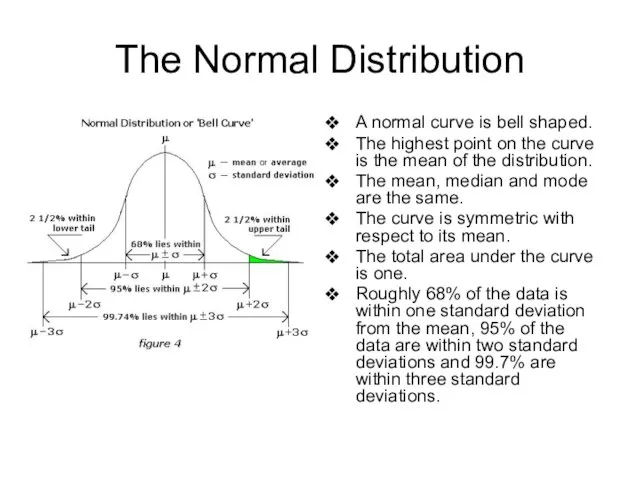
The Normal Distribution
A normal curve is bell shaped.
The highest point on
The Normal Distribution
A normal curve is bell shaped.
The highest point on
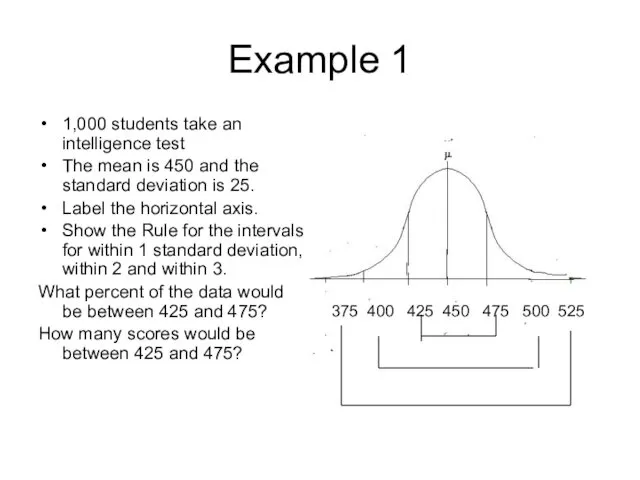
Example 1
1,000 students take an intelligence test
The mean is 450 and
Example 1
1,000 students take an intelligence test
The mean is 450 and
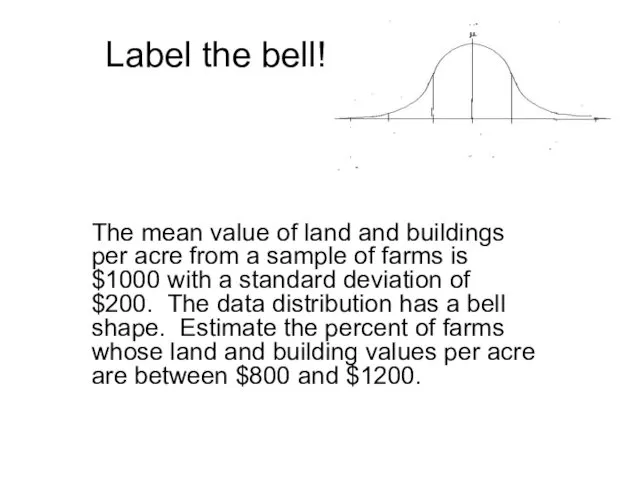
Label the bell!
The mean value of land and buildings per acre
Label the bell!
The mean value of land and buildings per acre
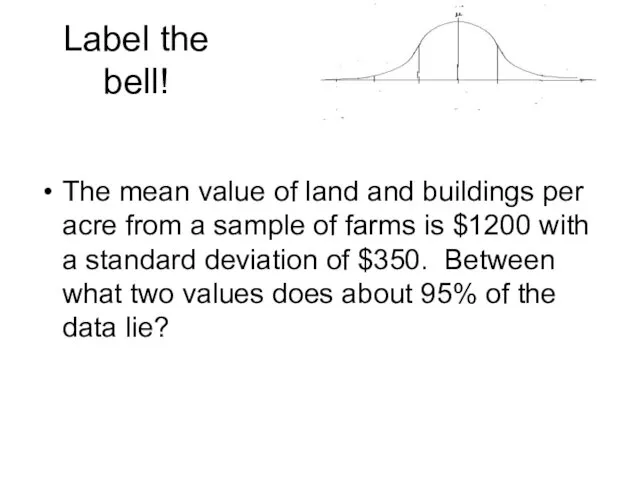
Label the bell!
The mean value of land and buildings per acre
Label the bell!
The mean value of land and buildings per acre
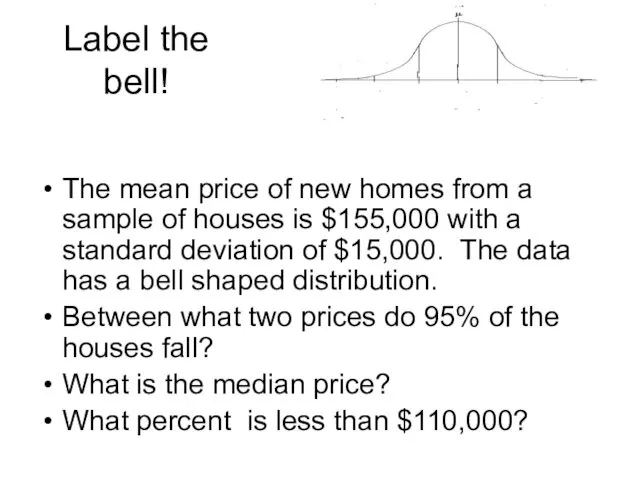
Label the bell!
The mean price of new homes from a sample
Label the bell!
The mean price of new homes from a sample
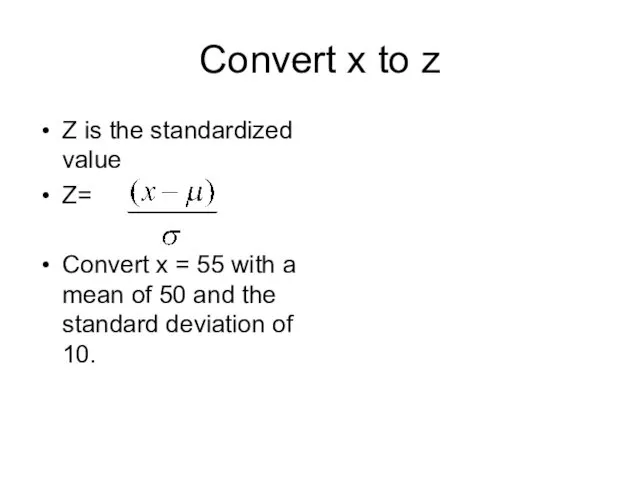
Convert x to z
Z is the standardized value
Z=
Convert x =
Convert x to z
Z is the standardized value
Z=
Convert x =
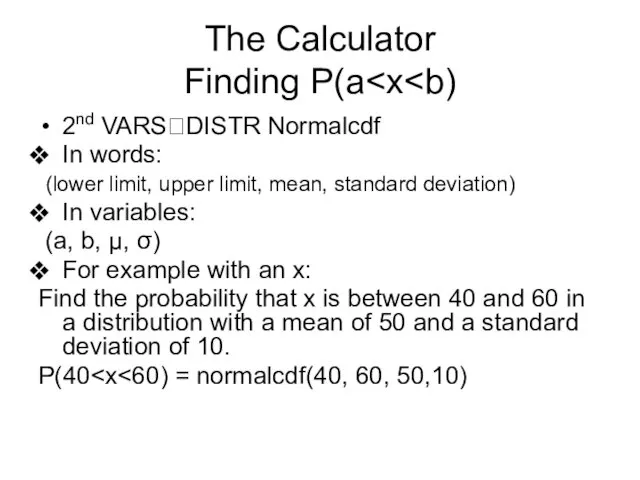
The Calculator
Finding P(a2nd VARS?DISTR Normalcdf
In words:
(lower limit, upper limit,
The Calculator
Finding P(a 2nd VARS?DISTR Normalcdf
In words:
(lower limit, upper limit,
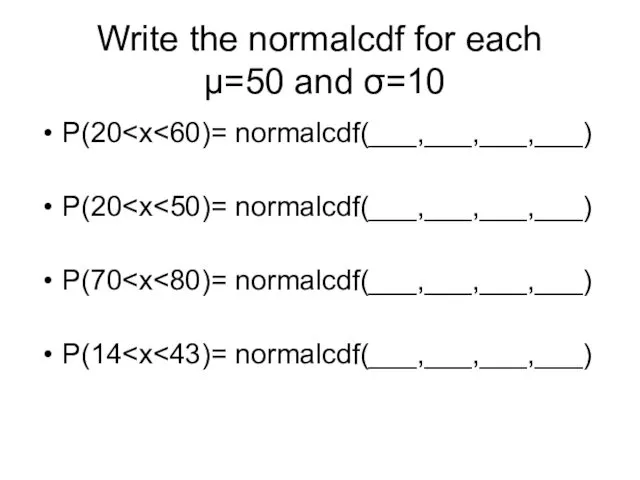
Write the normalcdf for each µ=50 and σ=10
P(20P(20P(70P(14
Write the normalcdf for each µ=50 and σ=10
P(20
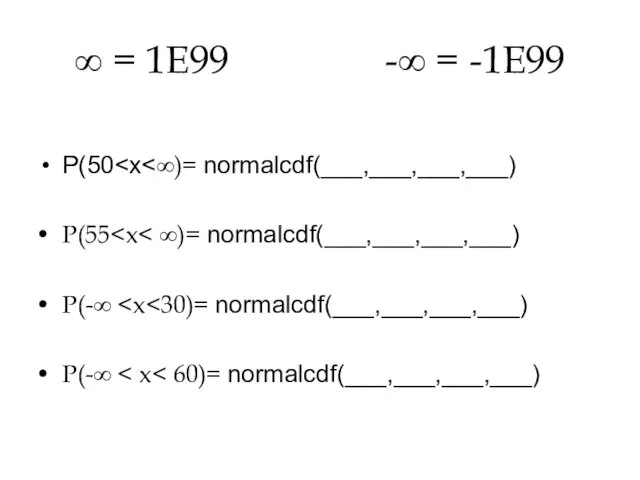
∞ = 1E99 -∞ = -1E99
P(50P(55P(-∞ P(-∞
∞ = 1E99 -∞ = -1E99
P(50
 Математические основы анализа свойств систем и наблюдения их состояния (лекция № 17)
 Движение. Виды движения. Симметрия
 Приёмы умножения на число 9
 Измерение и построение углов
 Математическая игра: Звездный час
 Вычисление интегралов
 Взаимное положение двух прямых
 Межпредметные связи в математике. Подготовка к ЕГЭ
 Метод найменших квадратів. (Тема 4)
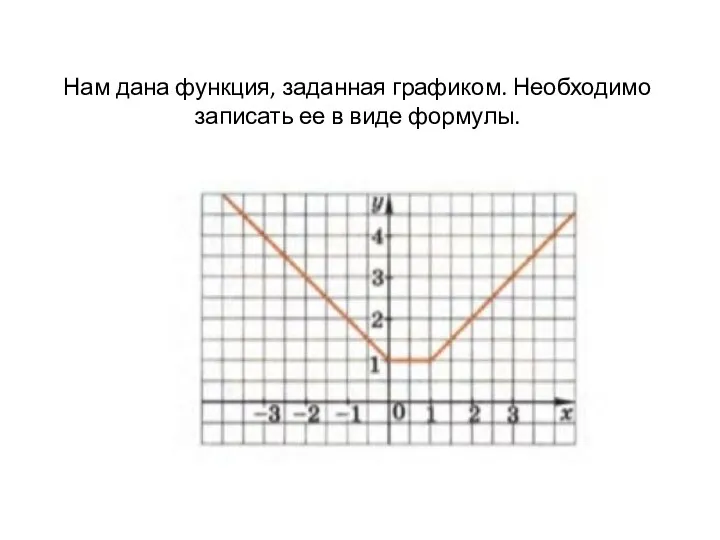 функция, заданная графиком
 Умножение и деление положительных и отрицательных чисел
 2 класс Счет в пределах 100.
 Последовательность изучения таблицы умножения в учебниках математики Л.Г. Петерсон
 Письменное умножение на двузначное число
 Транспортные задачи
 Сложение и вычитание смешанных чисел
 Сложение и вычитание десятичных дробей. Урок математики в 5 классе
 Транспортир. Измерение углов транспортиром
 Математика 3+2
 Презентация: Логические задачи для детей
 Площадь фигуры
 Розв'язуємо задачі на різницеве порівняння двох добутків. Урок №81
 Площади фигур. Обобщающее повторение. 8 класс
 Презентация к уроку Путешествие на остров математики
 Математические основы психологии
 Сложение и вычитание десятичных дробей
 Занимательные задачи по математике
 Математическая викторина ”Своя игра”