- EKG Interpretation

Содержание
- 2. Objectives The Basics Interpretation Clinical Pearls Practice Recognition
- 3. The Normal Conduction System
- 4. Lead Placement aVF
- 5. All Limb Leads
- 6. Precordial Leads
- 7. EKG Distributions Anteroseptal: V1, V2, V3, V4 Anterior: V1–V4 Anterolateral: V4–V6, I, aVL Lateral: I and
- 8. Waveforms
- 9. Interpretation Develop a systematic approach to reading EKGs and use it every time The system we
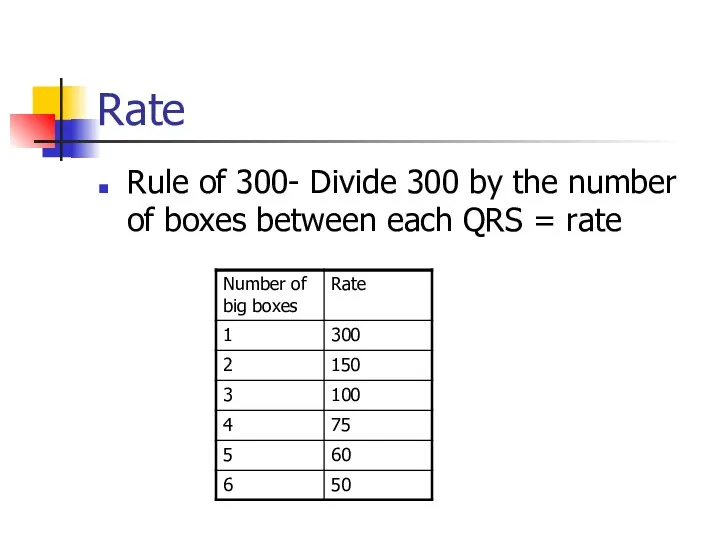
- 10. Rate Rule of 300- Divide 300 by the number of boxes between each QRS = rate
- 11. Rate HR of 60-100 per minute is normal HR > 100 = tachycardia HR
- 12. Differential Diagnosis of Tachycardia
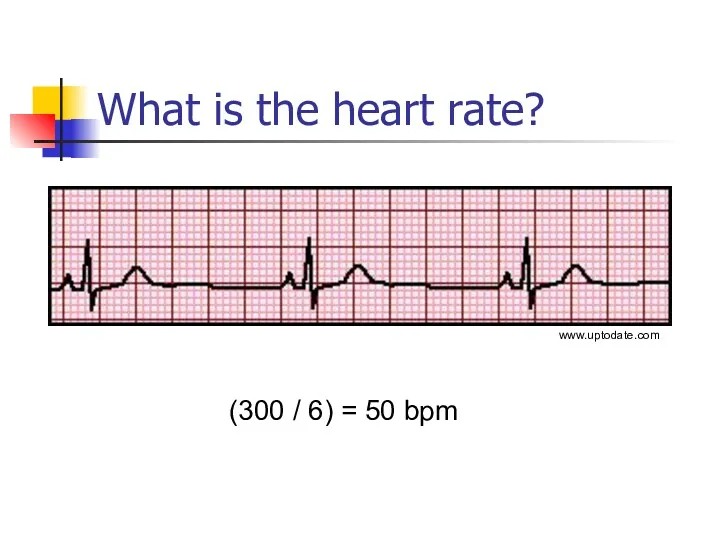
- 13. What is the heart rate? (300 / 6) = 50 bpm www.uptodate.com
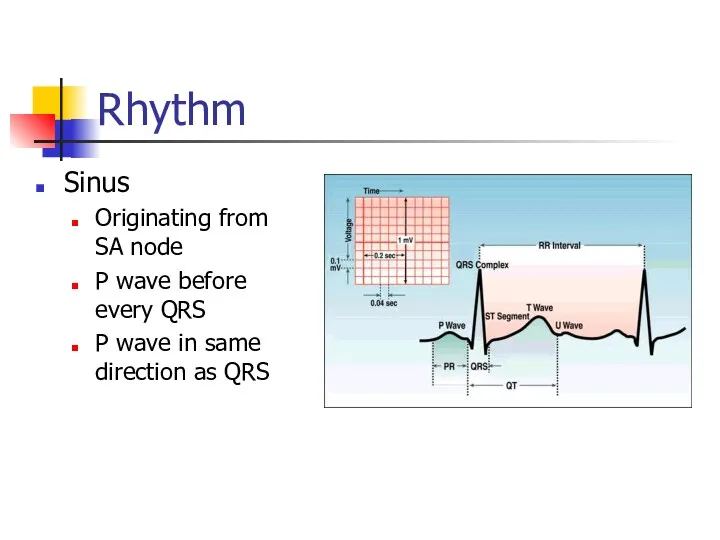
- 14. Rhythm Sinus Originating from SA node P wave before every QRS P wave in same direction
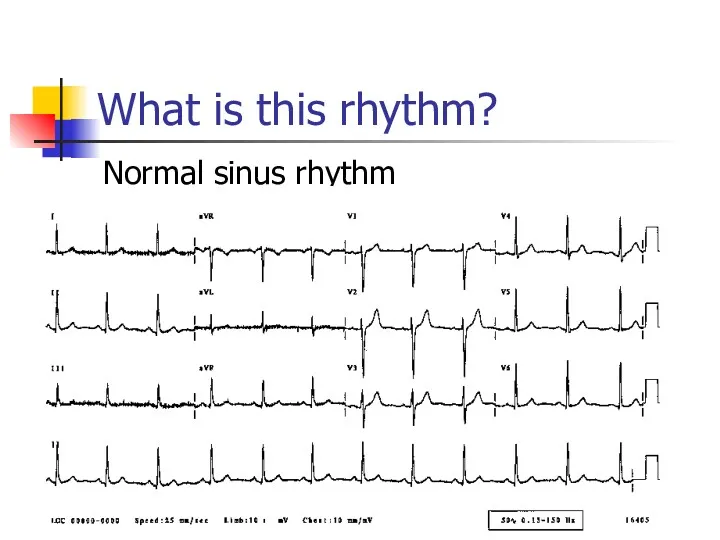
- 15. What is this rhythm? Normal sinus rhythm
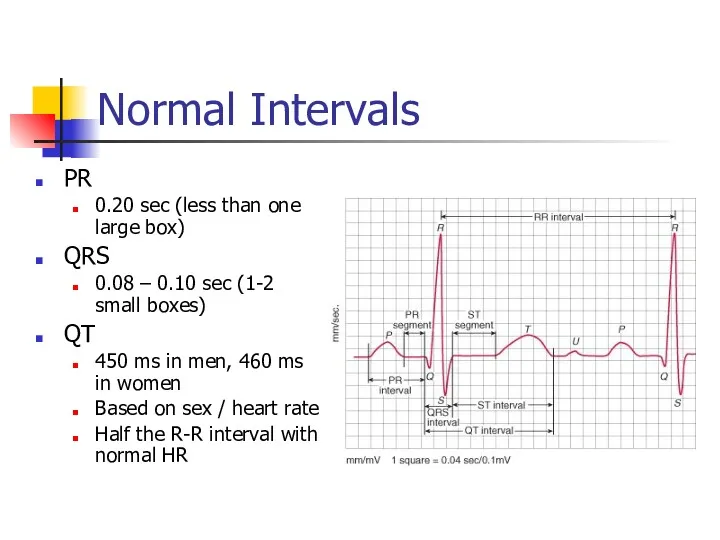
- 16. Normal Intervals PR 0.20 sec (less than one large box) QRS 0.08 – 0.10 sec (1-2
- 17. Prolonged QT Normal Men 450ms Women 460ms Corrected QT (QTc) QTm/√(R-R) Causes Drugs (Na channel blockers)
- 18. Blocks AV blocks First degree block PR interval fixed and > 0.2 sec Second degree block,
- 19. What is this rhythm? First degree AV block PR is fixed and longer than 0.2 sec
- 20. What is this rhythm? Type 1 second degree block (Wenckebach)
- 21. What is this rhythm? Type 2 second degree AV block Dropped QRS
- 22. What is this rhythm? 3rd degree heart block (complete)
- 23. The QRS Axis Represents the overall direction of the heart’s activity Axis of –30 to +90
- 24. The Quadrant Approach QRS up in I and up in aVF = Normal
- 25. What is the axis? Normal- QRS up in I and aVF
- 26. Hypertrophy Add the larger S wave of V1 or V2 in mm, to the larger R
- 27. Ischemia Usually indicated by ST changes Elevation = Acute infarction Depression = Ischemia Can manifest as
- 28. What is the diagnosis? Acute inferior MI with ST elevation in leads II, III, aVF
- 29. What do you see in this EKG? ST depression II, III, aVF, V3-V6 = ischemia
- 30. Let’s Practice The sample EKGs were obtained from the following text:
- 31. Normal Sinus Rhythm Mattu, 2003
- 32. First Degree Heart Block PR interval >200ms
- 33. Accelerated Idioventricular Ventricular escape rhythm, 40-110 bpm Seen in AMI, a marker of reperfusion
- 34. Junctional Rhythm Rate 40-60, no p waves, narrow complex QRS
- 35. Hyperkalemia Tall, narrow and symmetric T waves
- 36. Wellen’s Sign ST elevation and biphasic T wave in V2 and V3 Sign of large proximal
- 37. Brugada Syndrome RBBB or incomplete RBBB in V1-V3 with convex ST elevation
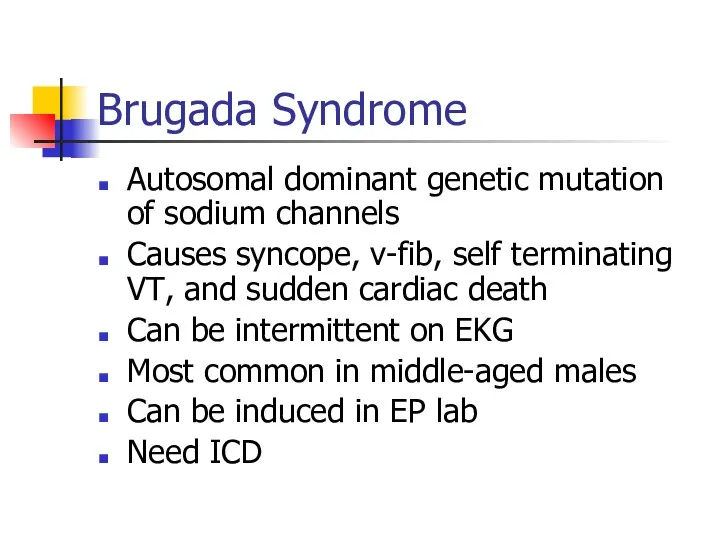
- 38. Brugada Syndrome Autosomal dominant genetic mutation of sodium channels Causes syncope, v-fib, self terminating VT, and
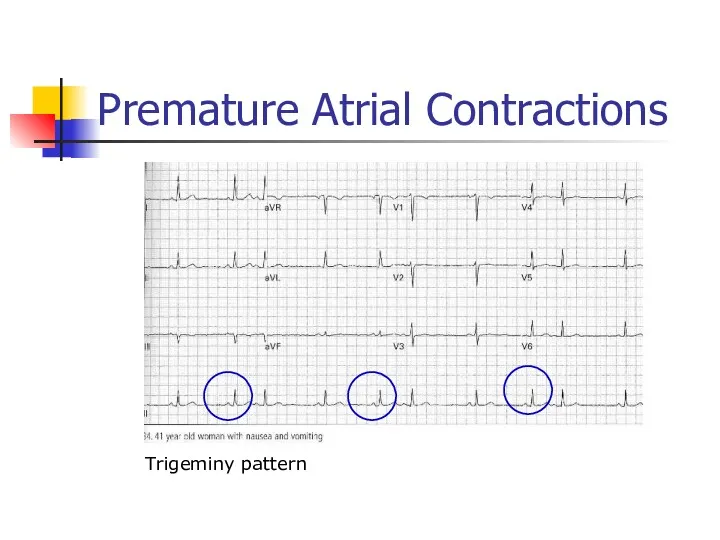
- 39. Premature Atrial Contractions Trigeminy pattern
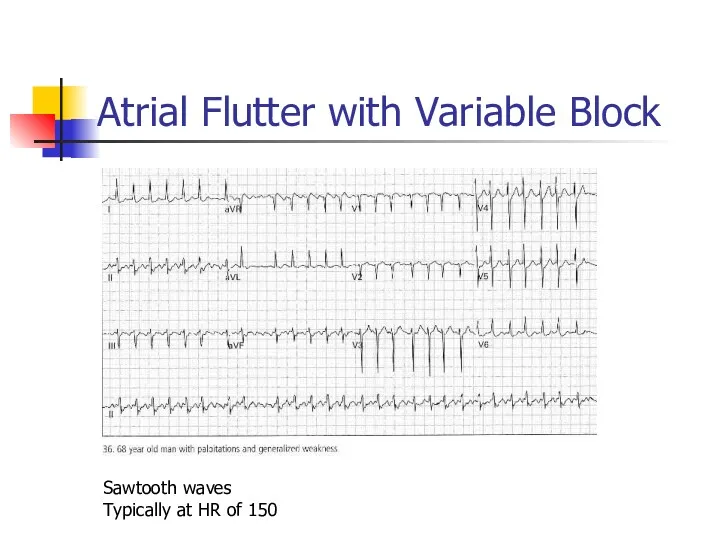
- 40. Atrial Flutter with Variable Block Sawtooth waves Typically at HR of 150
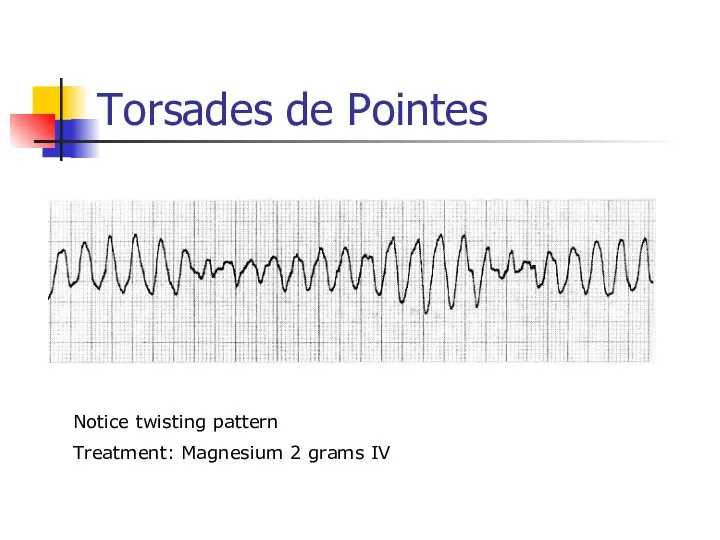
- 41. Torsades de Pointes Notice twisting pattern Treatment: Magnesium 2 grams IV
- 42. Digitalis Dubin, 4th ed. 1989
- 43. Lateral MI Reciprocal changes
- 44. Inferolateral MI ST elevation II, III, aVF ST depression in aVL, V1-V3 are reciprocal changes
- 45. Anterolateral / Inferior Ischemia LVH, AV junctional rhythm, bradycardia
- 46. Left Bundle Branch Block Monophasic R wave in I and V6, QRS > 0.12 sec Loss
- 47. Right Bundle Branch Block V1: RSR prime pattern with inverted T wave V6: Wide deep slurred
- 48. First Degree Heart Block, Mobitz Type I (Wenckebach) PR progressively lengthens until QRS drops
- 49. Supraventricular Tachycardia Narrow complex, regular; retrograde P waves, rate Retrograde P waves
- 50. Right Ventricular Myocardial Infarction Found in 1/3 of patients with inferior MI Increased morbidity and mortality
- 51. Ventricular Tachycardia
- 52. Prolonged QT QT > 450 ms Inferior and anterolateral ischemia
- 53. Second Degree Heart Block, Mobitz Type II PR interval fixed, QRS dropped intermittently
- 54. Acute Pulmonary Embolism SIQIIITIII in 10-15% T-wave inversions, especially occurring in inferior and anteroseptal simultaneously RAD
- 55. Wolff-Parkinson-White Syndrome Short PR interval Prolonged QRS >0.10 sec Delta wave Can simulate ventricular hypertrophy, BBB
- 56. Hypokalemia U waves Can also see PVCs, ST depression, small T waves
- 59. Скачать презентацию
Objectives
The Basics
Interpretation
Clinical Pearls
Practice Recognition
Objectives
The Basics
Interpretation
Clinical Pearls
Practice Recognition
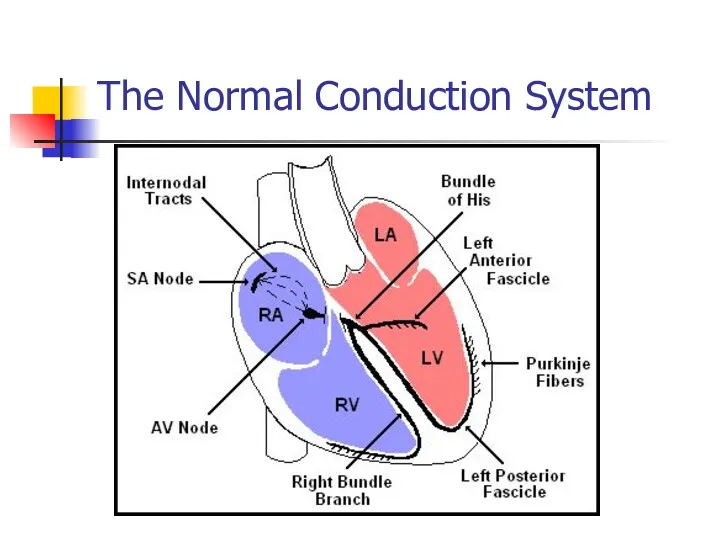
The Normal Conduction System
The Normal Conduction System
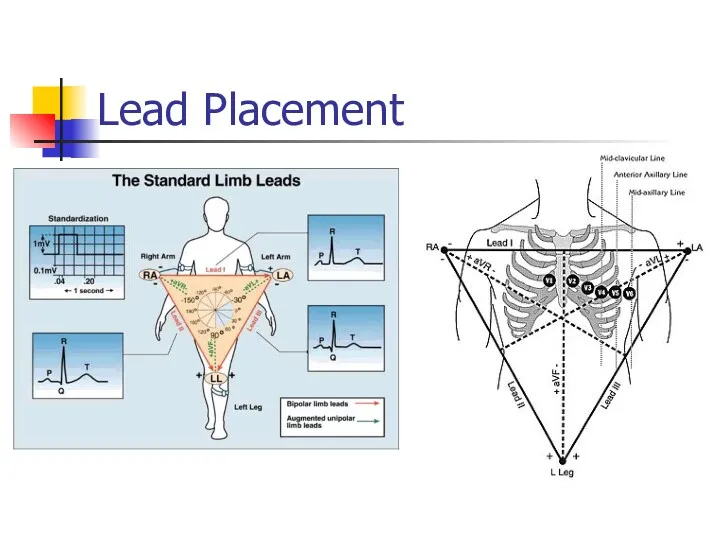
Lead Placement
aVF
Lead Placement
aVF
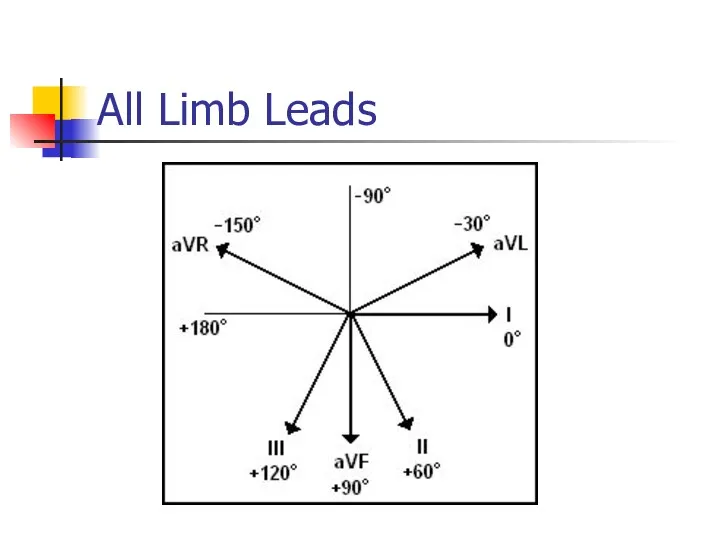
All Limb Leads
All Limb Leads
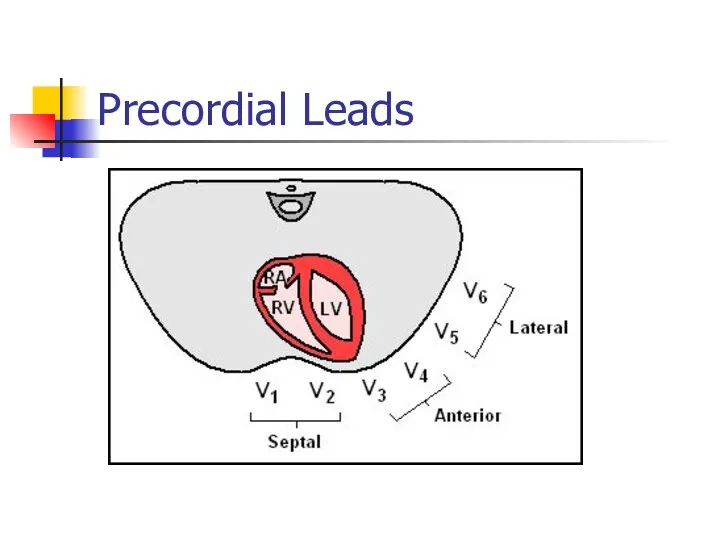
Precordial Leads
Precordial Leads
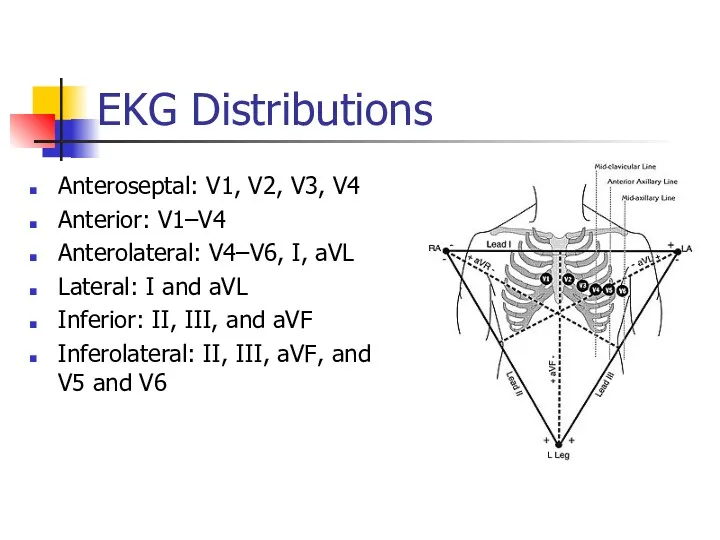
EKG Distributions
Anteroseptal: V1, V2, V3, V4
Anterior: V1–V4
Anterolateral: V4–V6, I, aVL
Lateral: I
EKG Distributions
Anteroseptal: V1, V2, V3, V4
Anterior: V1–V4
Anterolateral: V4–V6, I, aVL
Lateral: I
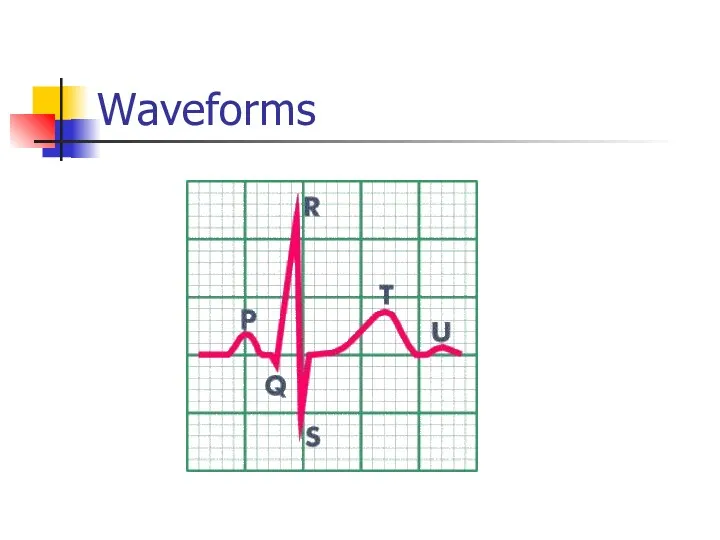
Waveforms
Waveforms
Interpretation
Develop a systematic approach to reading EKGs and use it
Interpretation
Develop a systematic approach to reading EKGs and use it
Rate
Rule of 300- Divide 300 by the number of boxes between
Rate
Rule of 300- Divide 300 by the number of boxes between
Rate
HR of 60-100 per minute is normal
HR > 100 = tachycardia
HR
Rate
HR of 60-100 per minute is normal
HR > 100 = tachycardia
HR
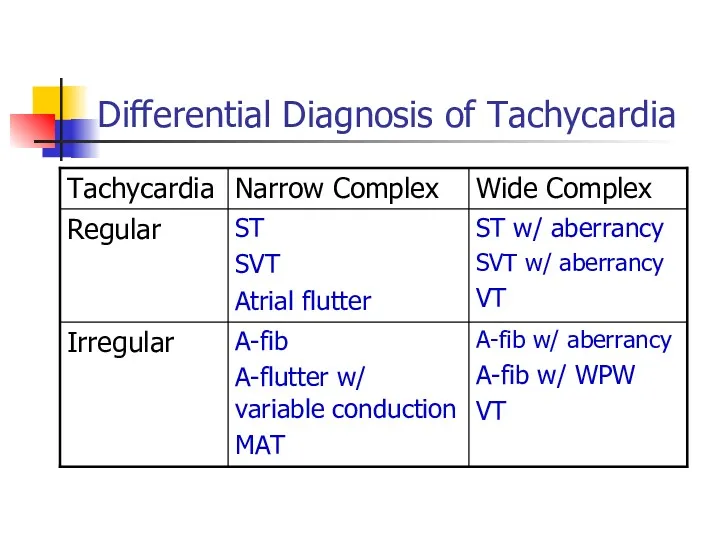
Differential Diagnosis of Tachycardia
Differential Diagnosis of Tachycardia
What is the heart rate?
(300 / 6) = 50 bpm
www.uptodate.com
What is the heart rate?
(300 / 6) = 50 bpm
www.uptodate.com
Rhythm
Sinus
Originating from SA node
P wave before every QRS
P wave in
Rhythm
Sinus
Originating from SA node
P wave before every QRS
P wave in
What is this rhythm?
Normal sinus rhythm
What is this rhythm?
Normal sinus rhythm
Normal Intervals
PR
0.20 sec (less than one large box)
QRS
0.08 – 0.10 sec
Normal Intervals
PR
0.20 sec (less than one large box)
QRS
0.08 – 0.10 sec
Prolonged QT
Normal
Men 450ms
Women 460ms
Corrected QT (QTc)
QTm/√(R-R)
Causes
Drugs (Na channel blockers)
Hypocalcemia, hypomagnesemia,
Prolonged QT
Normal
Men 450ms
Women 460ms
Corrected QT (QTc)
QTm/√(R-R)
Causes
Drugs (Na channel blockers)
Hypocalcemia, hypomagnesemia,
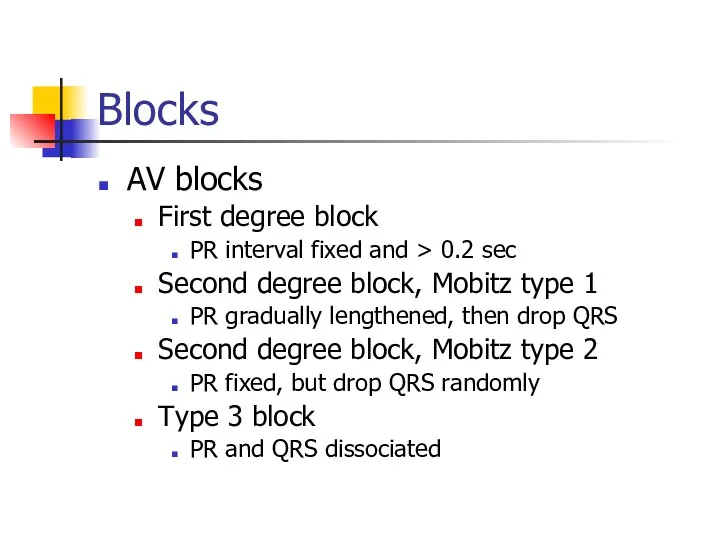
Blocks
AV blocks
First degree block
PR interval fixed and > 0.2 sec
Blocks
AV blocks
First degree block
PR interval fixed and > 0.2 sec
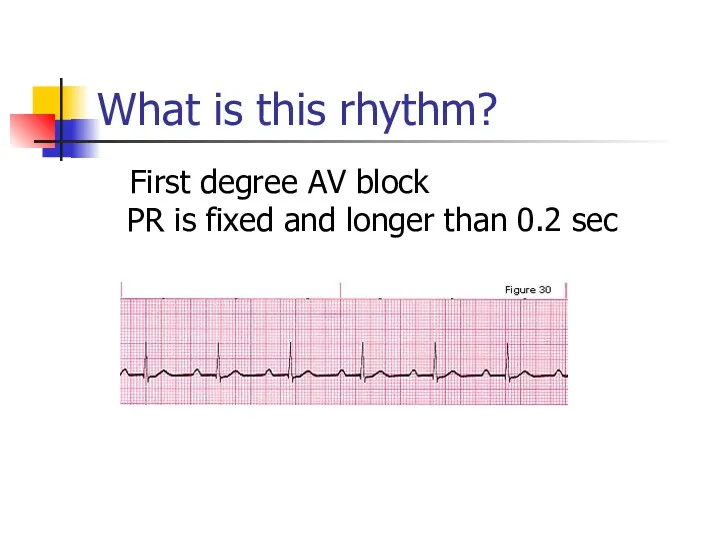
What is this rhythm?
First degree AV block PR is fixed
What is this rhythm?
First degree AV block PR is fixed
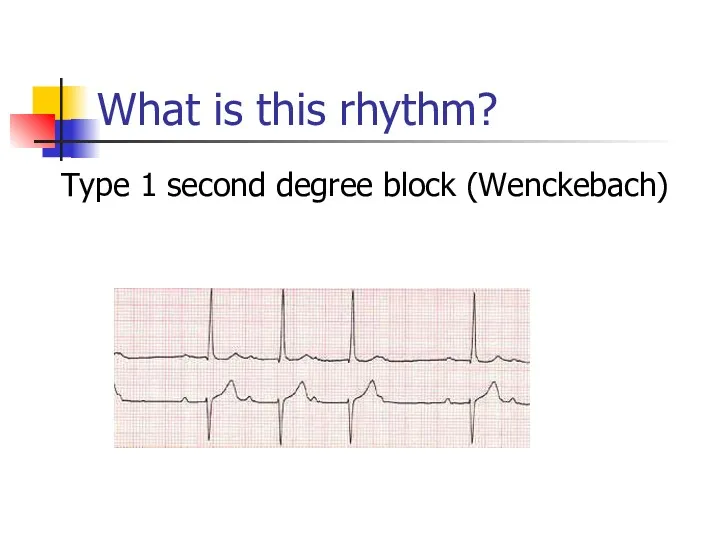
What is this rhythm?
Type 1 second degree block (Wenckebach)
What is this rhythm?
Type 1 second degree block (Wenckebach)
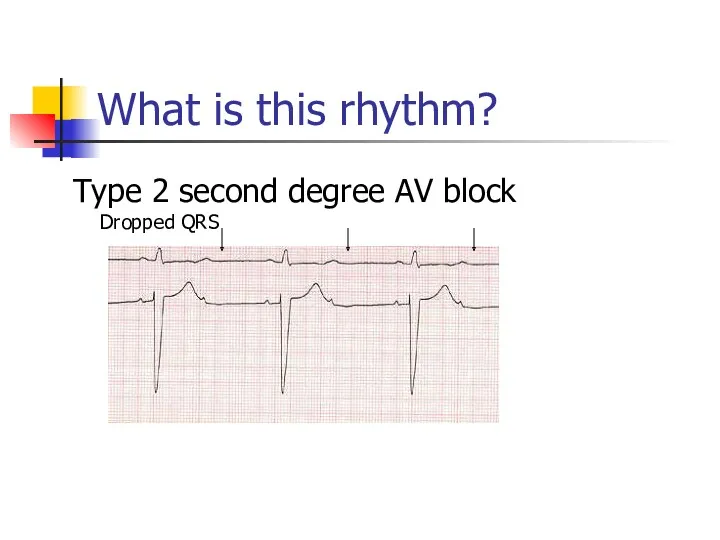
What is this rhythm?
Type 2 second degree AV block Dropped QRS
What is this rhythm?
Type 2 second degree AV block Dropped QRS
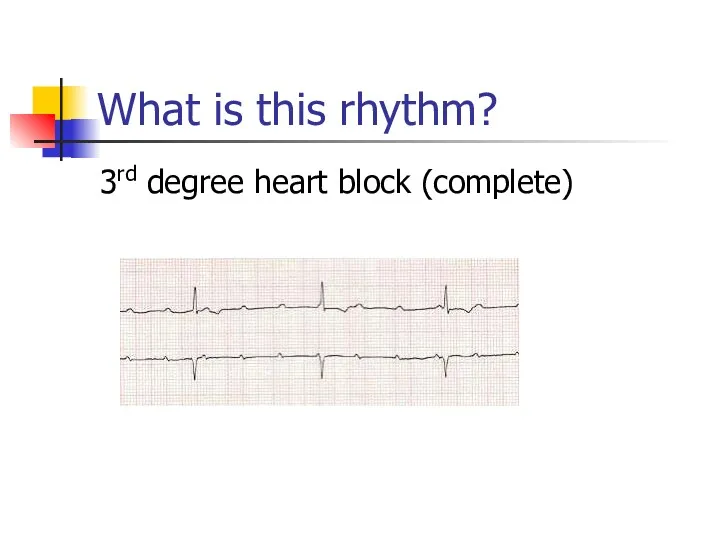
What is this rhythm?
3rd degree heart block (complete)
What is this rhythm?
3rd degree heart block (complete)
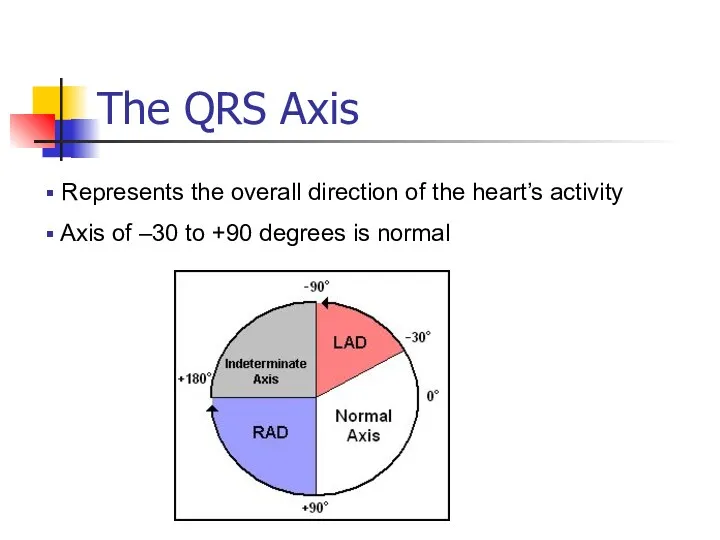
The QRS Axis
Represents the overall direction of the heart’s activity
The QRS Axis
Represents the overall direction of the heart’s activity
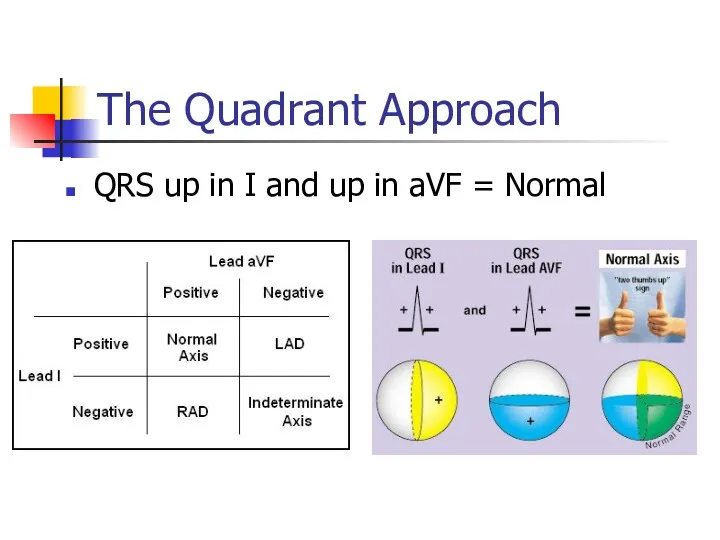
The Quadrant Approach
QRS up in I and up in aVF =
The Quadrant Approach
QRS up in I and up in aVF =
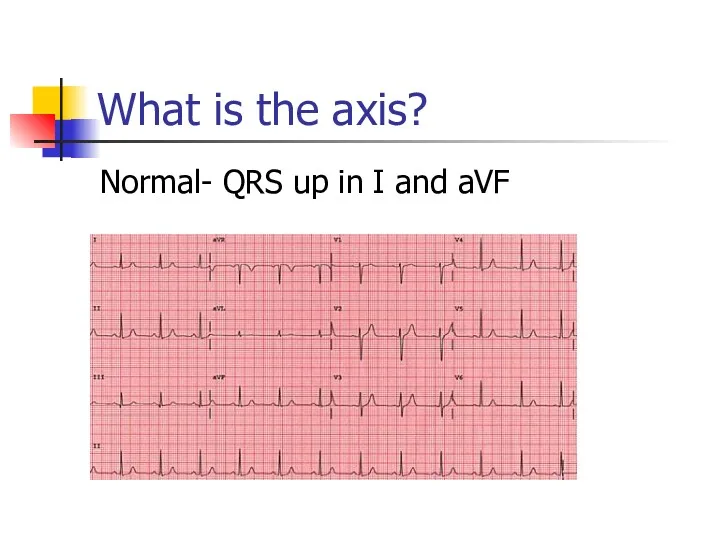
What is the axis?
Normal- QRS up in I and aVF
What is the axis?
Normal- QRS up in I and aVF
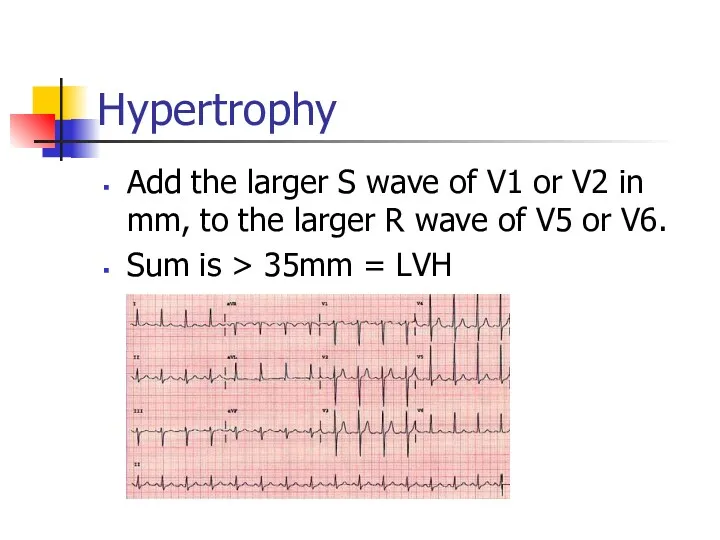
Hypertrophy
Add the larger S wave of V1 or V2 in mm,
Hypertrophy
Add the larger S wave of V1 or V2 in mm,
Ischemia
Usually indicated by ST changes
Elevation = Acute infarction
Depression = Ischemia
Can manifest
Ischemia
Usually indicated by ST changes
Elevation = Acute infarction
Depression = Ischemia
Can manifest
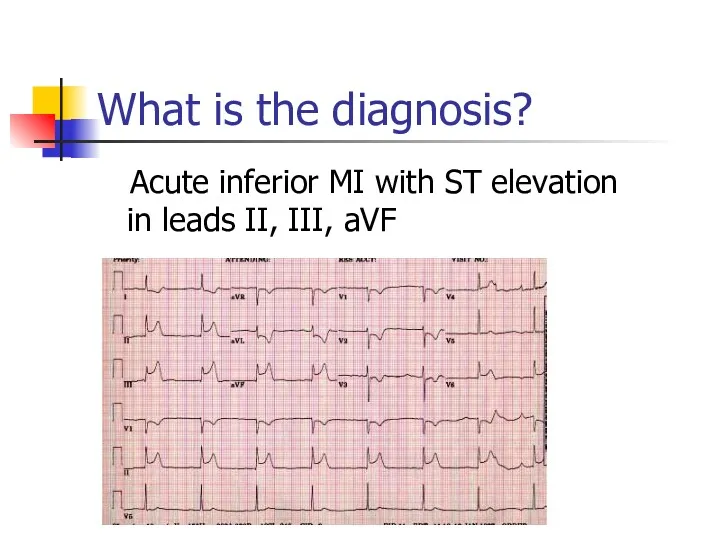
What is the diagnosis?
Acute inferior MI with ST elevation in
What is the diagnosis?
Acute inferior MI with ST elevation in
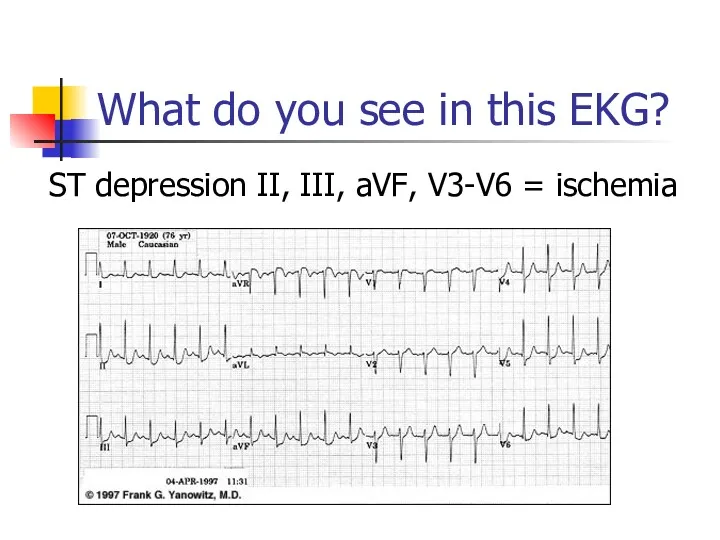
What do you see in this EKG?
ST depression II, III, aVF,
What do you see in this EKG?
ST depression II, III, aVF,
Let’s Practice
The sample EKGs were obtained from the following text:
Let’s Practice
The sample EKGs were obtained from the following text:
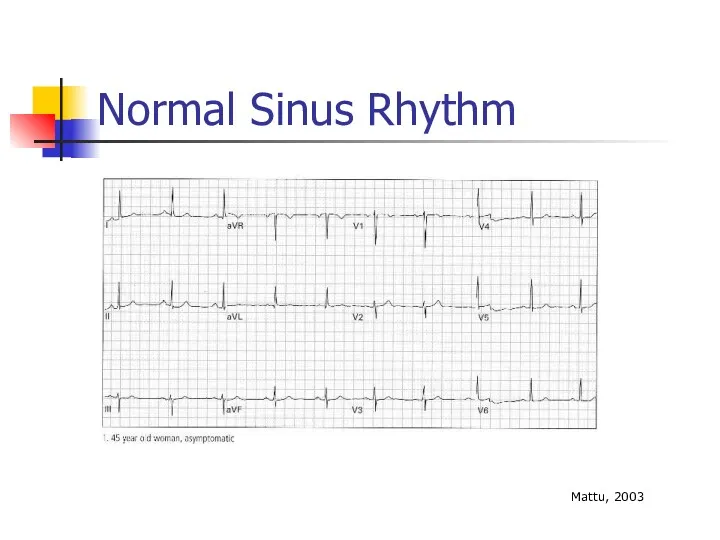
Normal Sinus Rhythm
Mattu, 2003
Normal Sinus Rhythm
Mattu, 2003
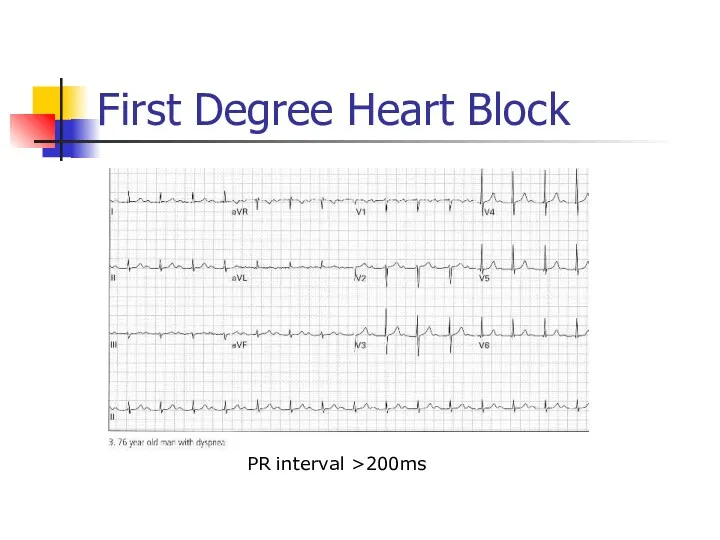
First Degree Heart Block
PR interval >200ms
First Degree Heart Block
PR interval >200ms
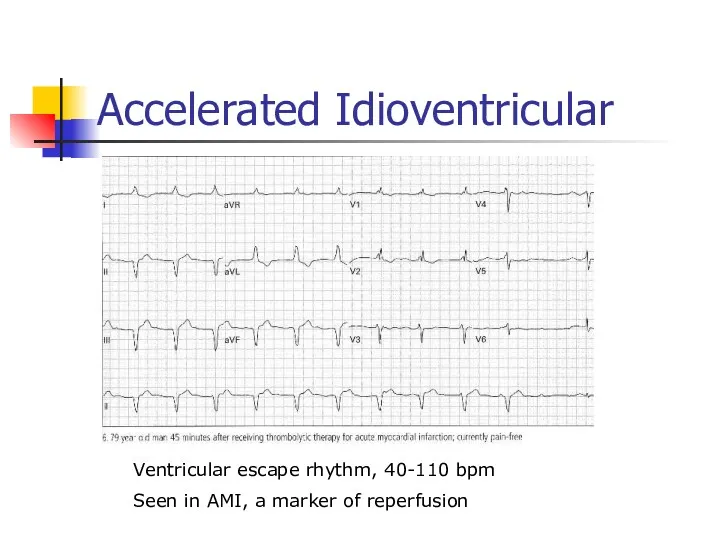
Accelerated Idioventricular
Ventricular escape rhythm, 40-110 bpm
Seen in AMI, a marker of
Accelerated Idioventricular
Ventricular escape rhythm, 40-110 bpm
Seen in AMI, a marker of
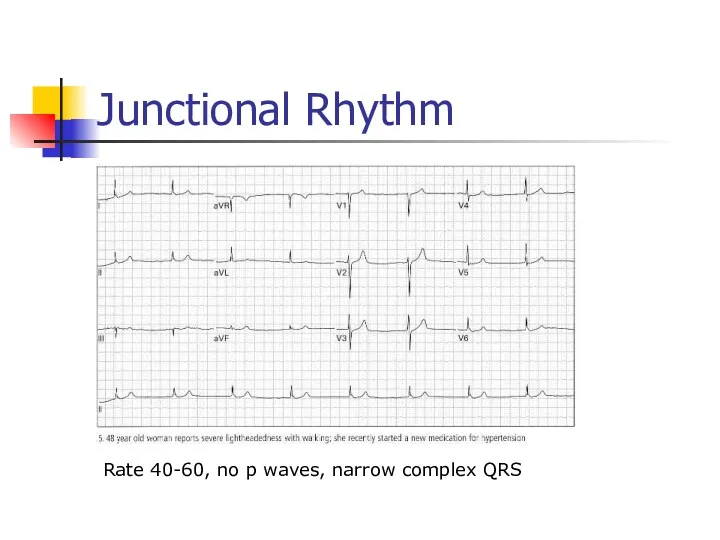
Junctional Rhythm
Rate 40-60, no p waves, narrow complex QRS
Junctional Rhythm
Rate 40-60, no p waves, narrow complex QRS
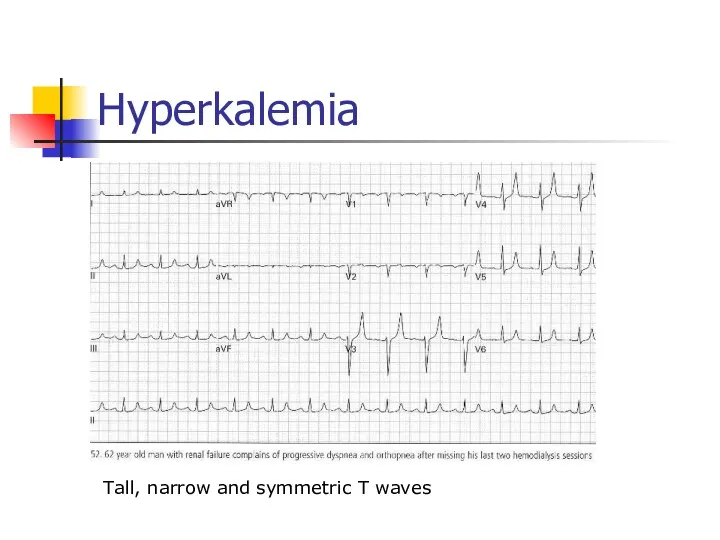
Hyperkalemia
Tall, narrow and symmetric T waves
Hyperkalemia
Tall, narrow and symmetric T waves
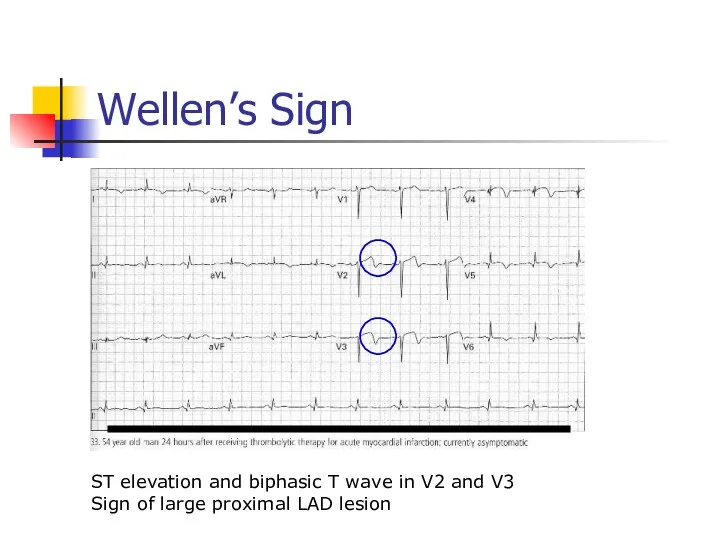
Wellen’s Sign
ST elevation and biphasic T wave in V2 and V3
Sign
Wellen’s Sign
ST elevation and biphasic T wave in V2 and V3
Sign
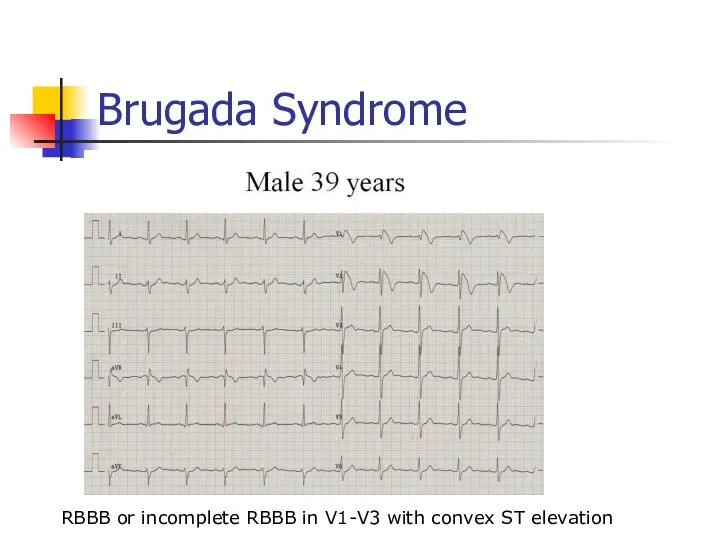
Brugada Syndrome
RBBB or incomplete RBBB in V1-V3 with convex ST elevation
Brugada Syndrome
RBBB or incomplete RBBB in V1-V3 with convex ST elevation
Brugada Syndrome
Autosomal dominant genetic mutation of sodium channels
Causes syncope, v-fib, self
Brugada Syndrome
Autosomal dominant genetic mutation of sodium channels
Causes syncope, v-fib, self
Premature Atrial Contractions
Trigeminy pattern
Premature Atrial Contractions
Trigeminy pattern
Atrial Flutter with Variable Block
Sawtooth waves
Typically at HR of 150
Atrial Flutter with Variable Block
Sawtooth waves
Typically at HR of 150
Torsades de Pointes
Notice twisting pattern
Treatment: Magnesium 2 grams IV
Torsades de Pointes
Notice twisting pattern
Treatment: Magnesium 2 grams IV
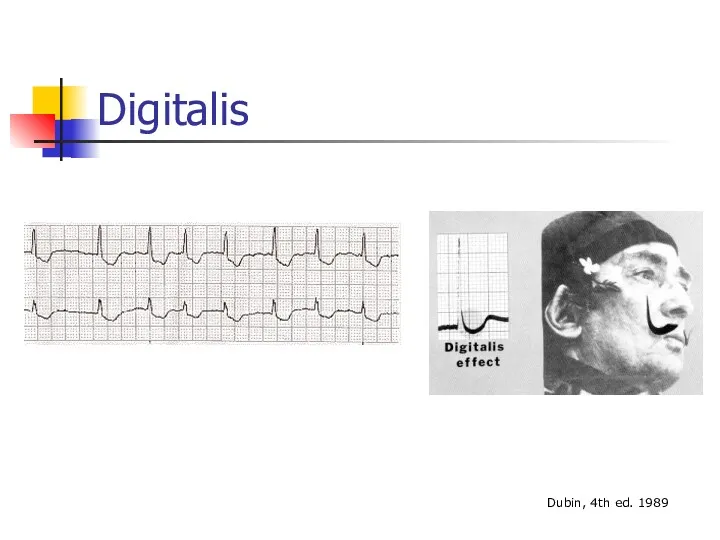
Digitalis
Dubin, 4th ed. 1989
Digitalis
Dubin, 4th ed. 1989
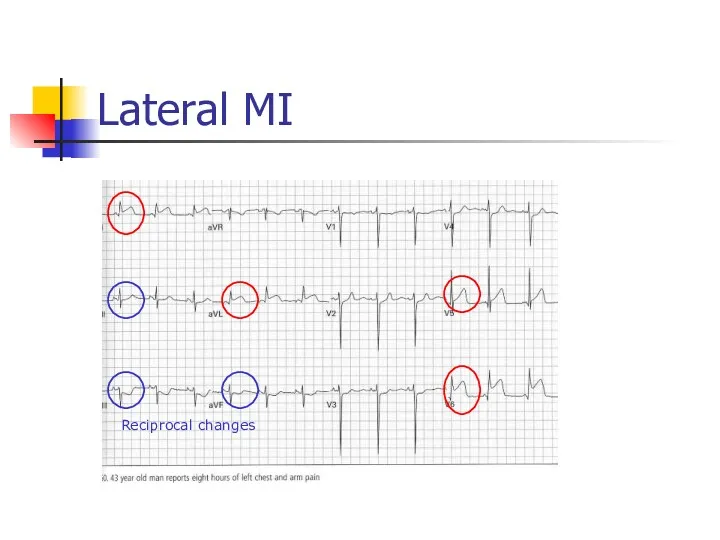
Lateral MI
Reciprocal changes
Lateral MI
Reciprocal changes
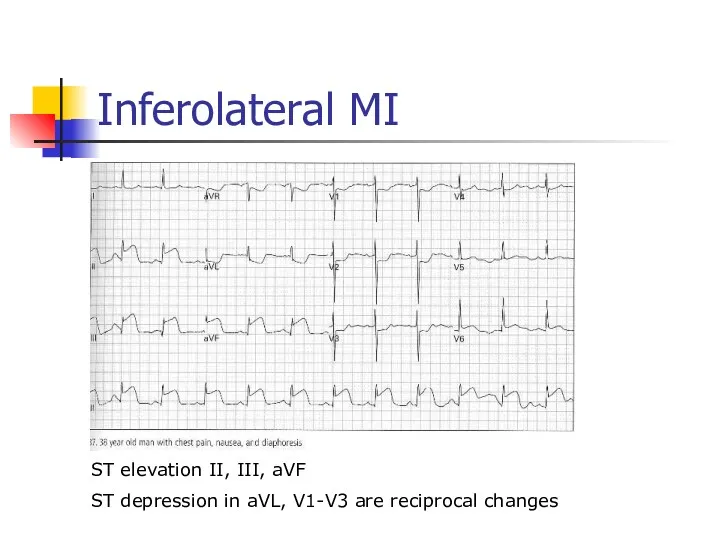
Inferolateral MI
ST elevation II, III, aVF
ST depression in aVL, V1-V3 are
Inferolateral MI
ST elevation II, III, aVF
ST depression in aVL, V1-V3 are
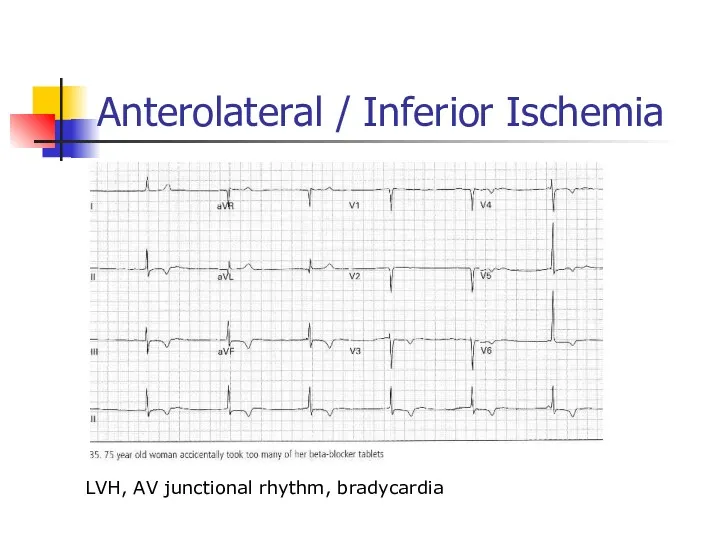
Anterolateral / Inferior Ischemia
LVH, AV junctional rhythm, bradycardia
Anterolateral / Inferior Ischemia
LVH, AV junctional rhythm, bradycardia
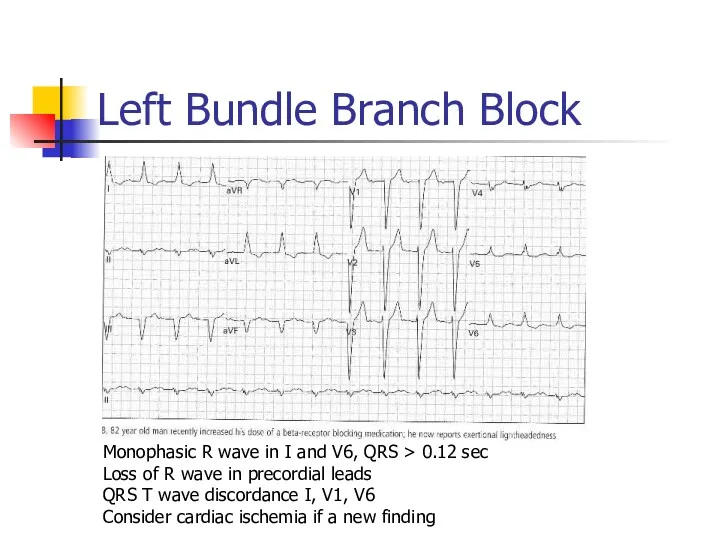
Left Bundle Branch Block
Monophasic R wave in I and V6, QRS
Left Bundle Branch Block
Monophasic R wave in I and V6, QRS
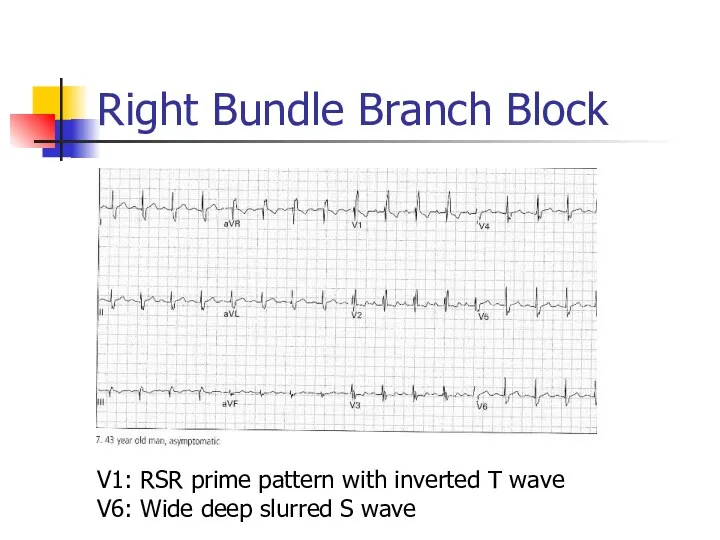
Right Bundle Branch Block
V1: RSR prime pattern with inverted T wave
V6:
Right Bundle Branch Block
V1: RSR prime pattern with inverted T wave
V6:
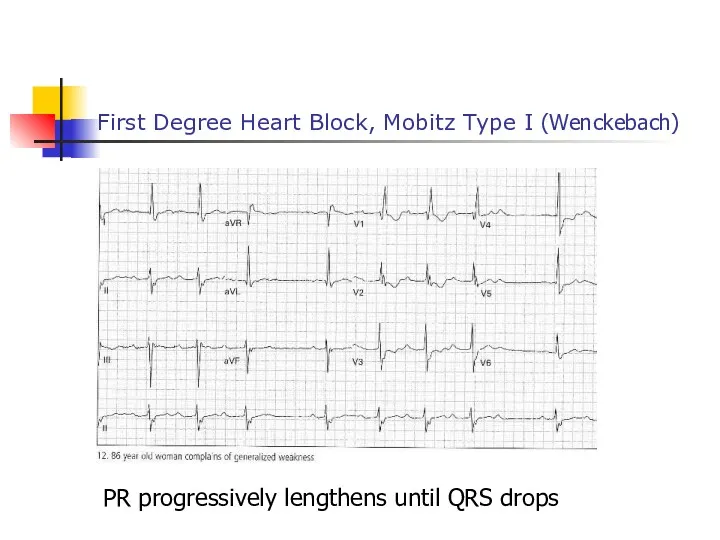
First Degree Heart Block, Mobitz Type I (Wenckebach)
PR progressively lengthens until
First Degree Heart Block, Mobitz Type I (Wenckebach)
PR progressively lengthens until
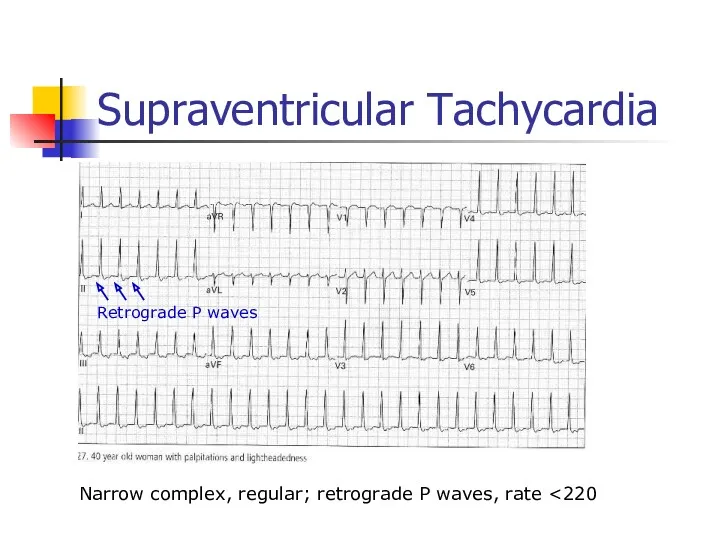
Supraventricular Tachycardia
Narrow complex, regular; retrograde P waves, rate <220
Retrograde P waves
Supraventricular Tachycardia
Narrow complex, regular; retrograde P waves, rate <220
Retrograde P waves
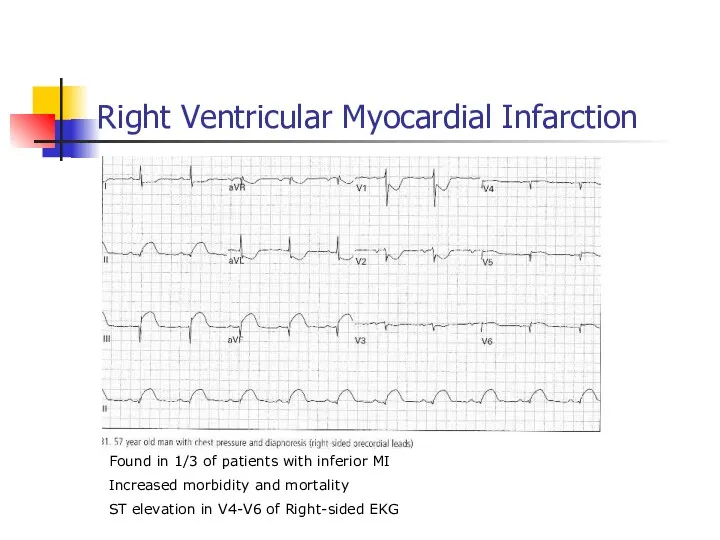
Right Ventricular Myocardial Infarction
Found in 1/3 of patients with inferior MI
Increased
Right Ventricular Myocardial Infarction
Found in 1/3 of patients with inferior MI
Increased
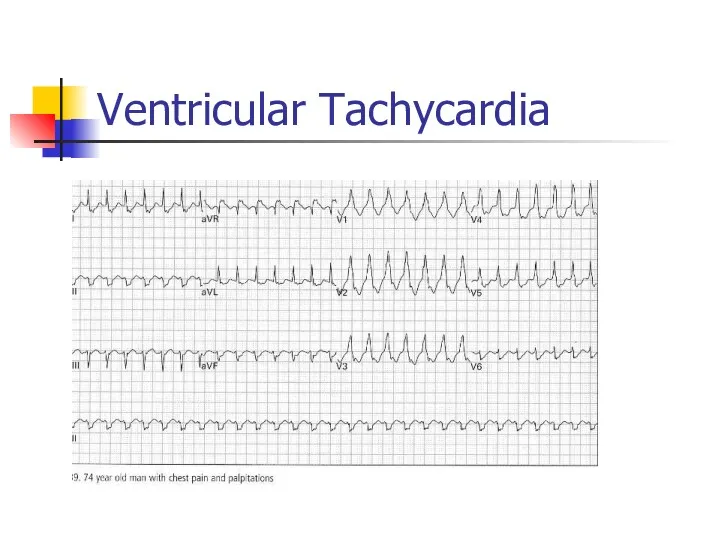
Ventricular Tachycardia
Ventricular Tachycardia
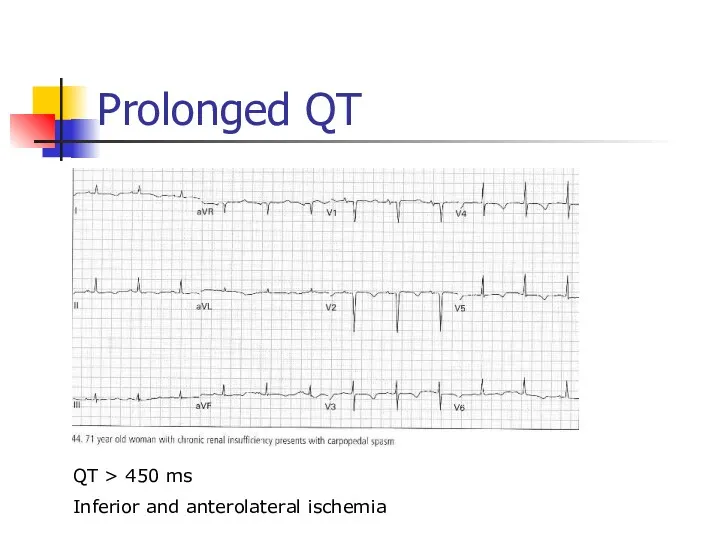
Prolonged QT
QT > 450 ms
Inferior and anterolateral ischemia
Prolonged QT
QT > 450 ms
Inferior and anterolateral ischemia
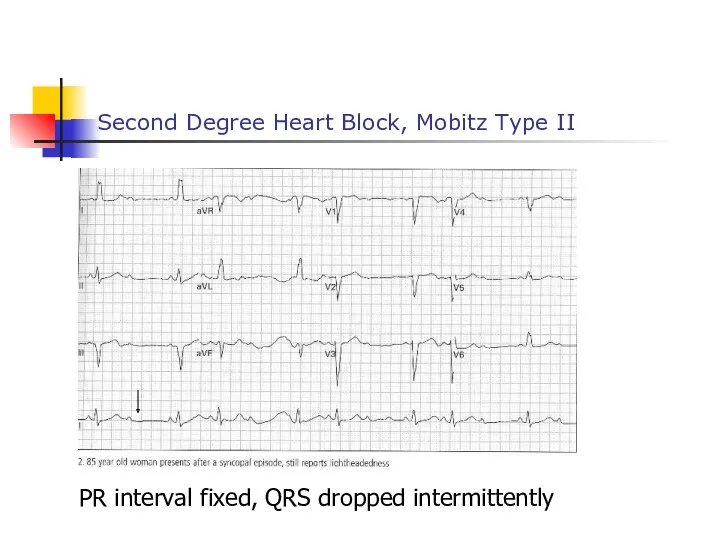
Second Degree Heart Block, Mobitz Type II
PR interval fixed, QRS dropped
Second Degree Heart Block, Mobitz Type II
PR interval fixed, QRS dropped
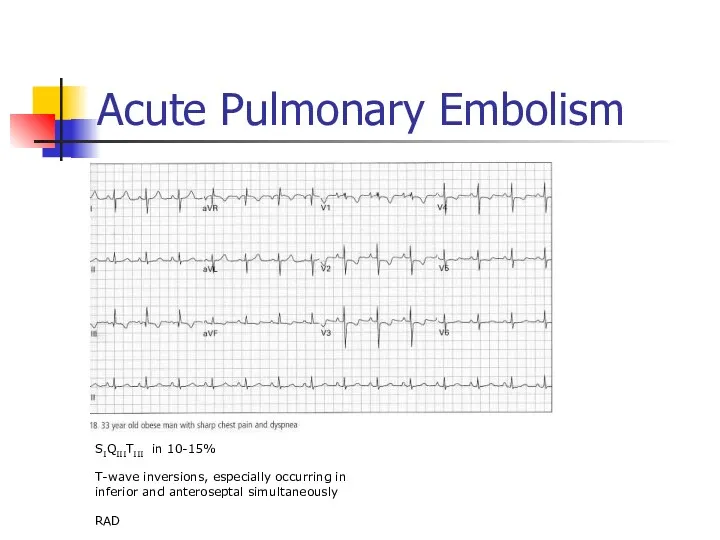
Acute Pulmonary Embolism
SIQIIITIII in 10-15%
T-wave inversions, especially occurring in
Acute Pulmonary Embolism
SIQIIITIII in 10-15%
T-wave inversions, especially occurring in
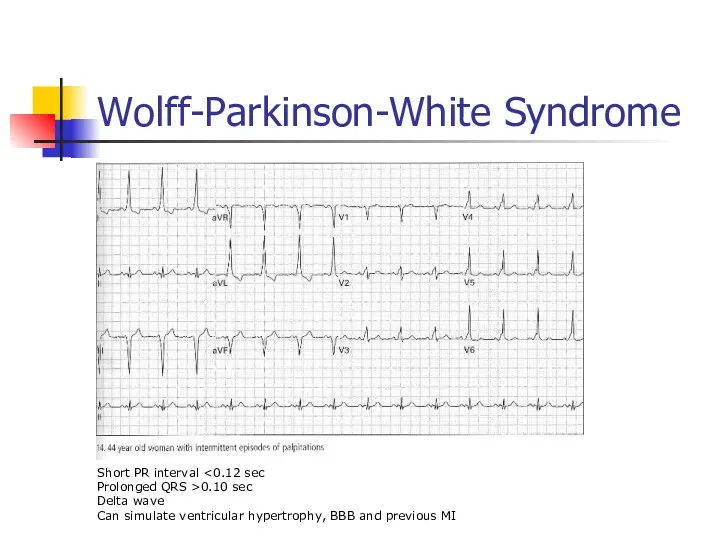
Wolff-Parkinson-White Syndrome
Short PR interval <0.12 sec
Prolonged QRS >0.10 sec
Delta wave
Can simulate
Wolff-Parkinson-White Syndrome
Short PR interval <0.12 sec
Prolonged QRS >0.10 sec
Delta wave
Can simulate
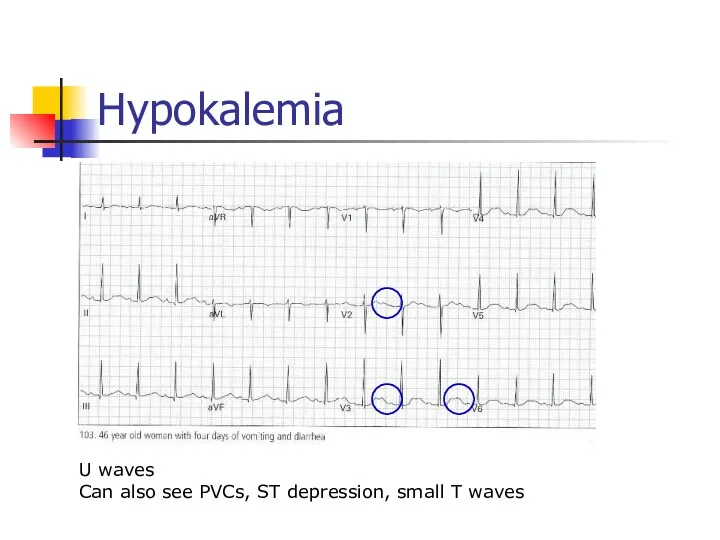
Hypokalemia
U waves
Can also see PVCs, ST depression, small T waves
Hypokalemia
U waves
Can also see PVCs, ST depression, small T waves
 Общие правила оказания первой доврачебной помощи. Алгоритм оказания первой помощи. Юридические и моральные аспекты
 Клинические формы вторичного туберкулеза
 Рентгеноконтрастные исследования и препараты
 Анатомо-физиологические особенности эндокринной системы у детей
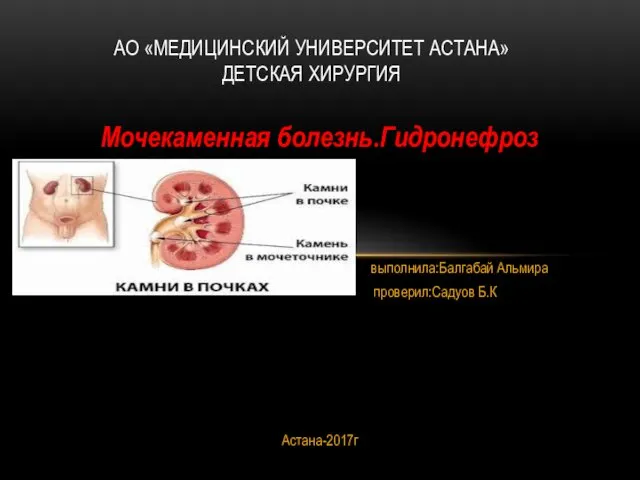 Мочекаменная болезнь. Гидронефроз
 Вич и Спид
 Інфузійна терапія
 Градация доказательств и уровни рекомендаций
 Особенности сестринского ухода за инфекционными больными. Сестринский процесс. Сестринский диагноз
 Анализ затрат на лекарственные средства с помощью ABC/VEV методологии
 Моногибридті будандастыру. Гибридологиялық зерттеу әдісі
 Опухоли. Онкология
 Анонимные Наркоманы г. Йошкар-Ола
 Энтеробиоз: определение
 Ожирение. Степени ожирения
 Генетика человека. Генные болезни
 Острые воспалительные заболевания матки и придатков как причина развития клиники острого живота в гинекологии
 Лекарственная токсикология
 Орталық және шеткі жүйке жүйесінің клиникалық физиологиясы бен биохимиясы
 История развития психогенетики в мировой науке
 Ас қорыту жүйесіне жалпы шолу
 Микробиологическая диагностика брюшного тифа, паратифов и других сальмонеллезных инфекций. Пищевые отравления и их диагностика
 Лабораторная диагностика заболеваний, вызываемых извитыми формами бактерий. Спирохетозы (сифилис, лептоспироз, возвратные тифы)
 Жарақаттар
 Диагностическая информативность онкомаркеров в гинекологии
 Специфическая (антидотная) фармакотерапия острых отравлений
 Эректильная дисфункция (ЭД)
 Лекарственные препараты по химии