- Myocardial Infarction

Содержание
- 2. The interior of the heart is composed of valves, chambers, and associated vessels. Definition : A
- 3. The external structures of the heart include the ventricles, atria, arteries and veins. Arteries carry blood
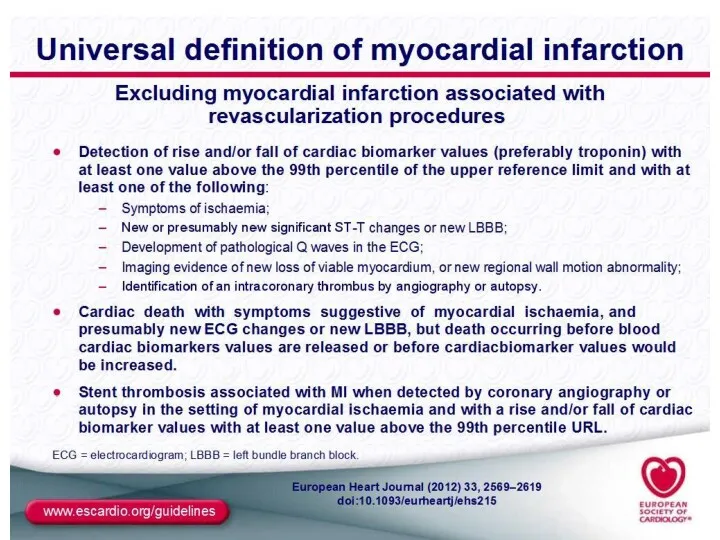
- 4. DEFINITION Myocardial infarction (MI) – ischaemic necrosis is almost always due to the formation of occlusive
- 7. (Progressive Build-Up of Plaque in Coronary Artery) Plaque may build-up in a coronary artery at the
- 8. Posterior Heart Arteries The coronary arteries supply blood to the heart muscle. The right coronary artery
- 9. Anterior Heart Arteries The coronary arteries supply blood to the heart muscle. The right coronary artery
- 10. INTERNATIONAL CLASSIFICATION OF DEASESES – 10 ACUTE MI - WITH PATHOLOGICAL Q-WAVE ACUTE MI – WITHOUT
- 11. Classification of MI TYPE 1 – Acute coronary syndrom:primary coronary event- plaque rupture, erosion, ulceration, coronary
- 12. Heart Attack Symptoms Symptoms of a possible heart attack include chest pain and pain that radiates
- 13. Causes, & Risk Factors Most heart attacks are caused by a clot that blocks one of
- 14. RISK FACTORS Nonmodifable : Age (> 45 ) Male gender Family history (genetic predisposition) Aethnic origin
- 15. Heart Attack Symptoms & Signs : Chest pain behind the sternum (breastbone) is a major symptom
- 16. PRESENTATION (urgent diagnosis) Sudden intensity chest pain usually similar in nature to angina, but of greater
- 17. HEART ATTACK SYMPTOMS The pain can be intense and severe or quite subtle and confusing. It
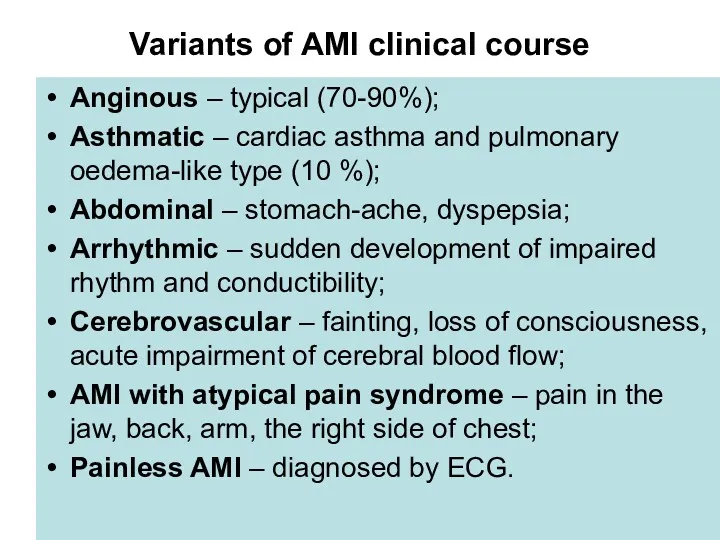
- 18. Variants of AMI clinical course Anginous – typical (70-90%); Asthmatic – cardiac asthma and pulmonary oedema-like
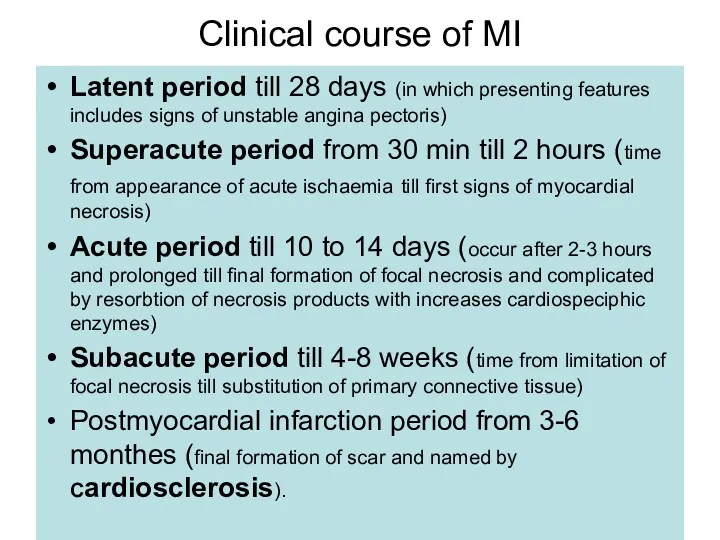
- 19. Clinical course of MI Latent period till 28 days (in which presenting features includes signs of
- 20. Criterias of diagnosis Typical clinical signs (combination of history) Typical ECG changes (Q-wave, ST-segment, T-wave) Biochemical
- 21. DIAGNOSIS OF MI The diagnosis is based on thorough analysis of clinical manifestations, ECG, and necrosis
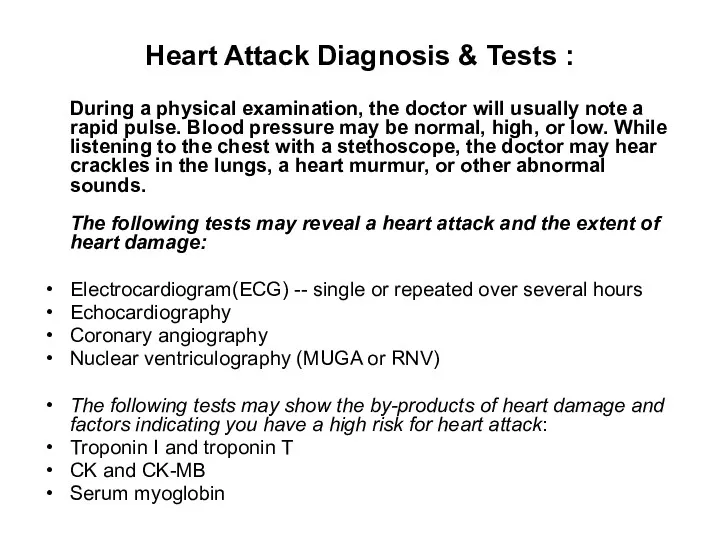
- 22. Heart Attack Diagnosis & Tests : During a physical examination, the doctor will usually note a
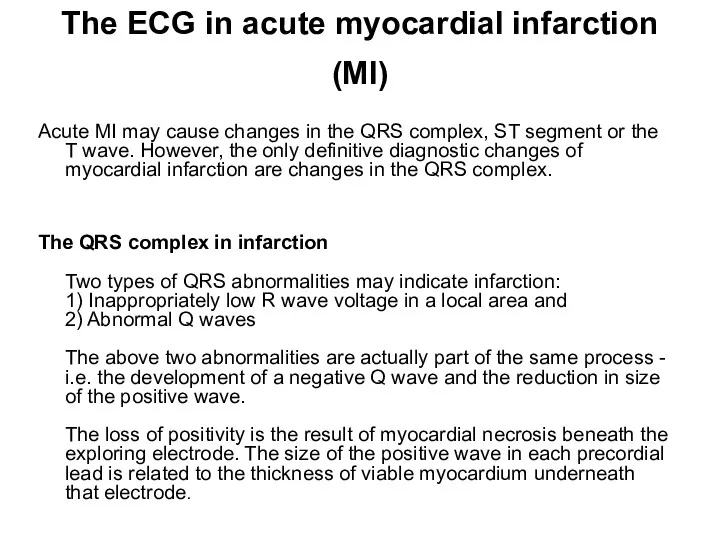
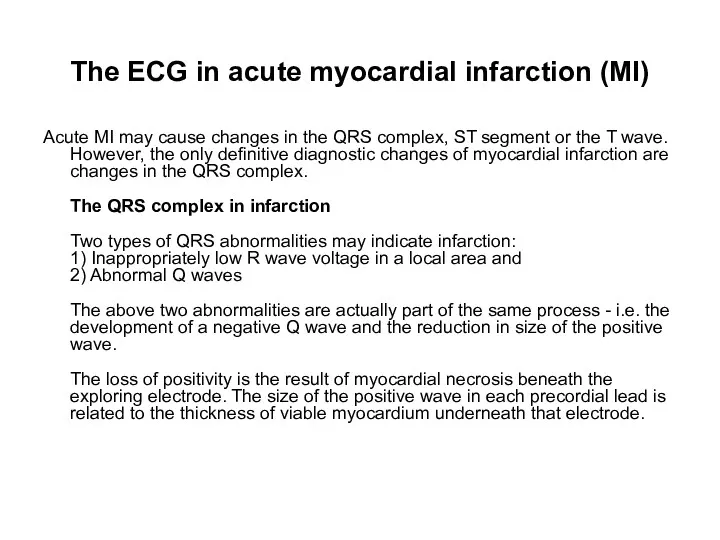
- 23. The ECG in acute myocardial infarction (MI) Acute MI may cause changes in the QRS complex,
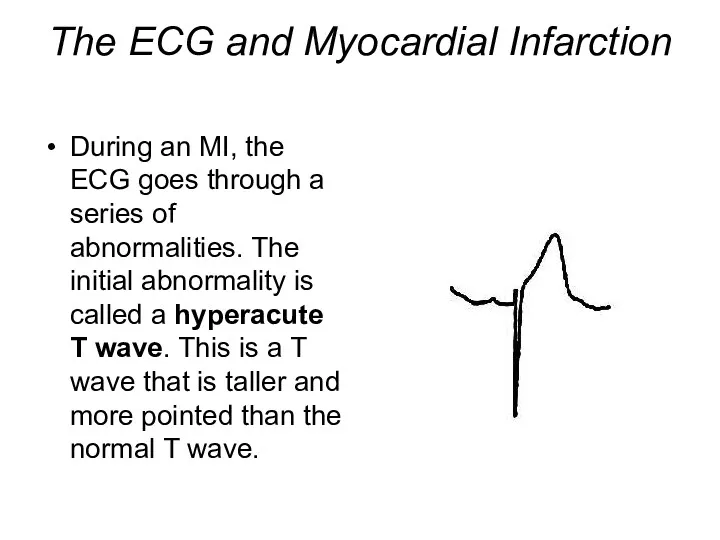
- 24. The ECG and Myocardial Infarction During an MI, the ECG goes through a series of abnormalities.
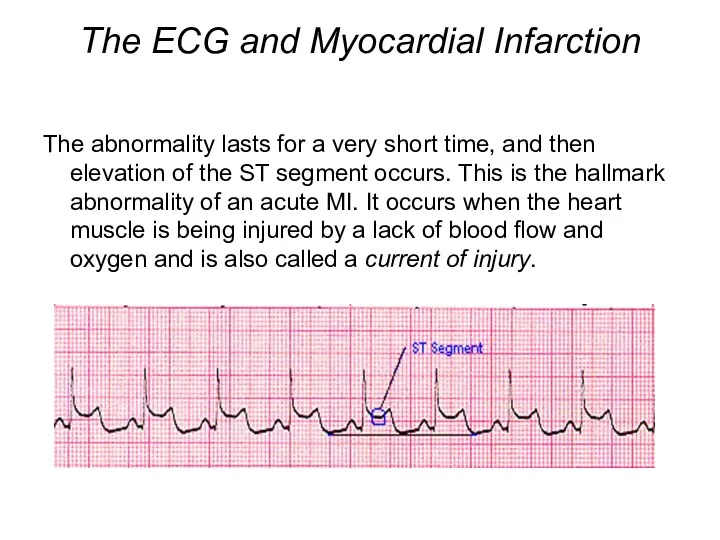
- 25. The ECG and Myocardial Infarction The abnormality lasts for a very short time, and then elevation
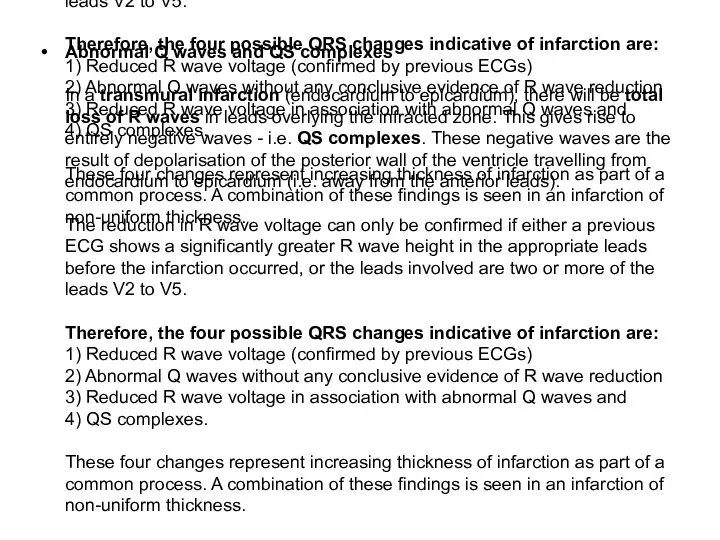
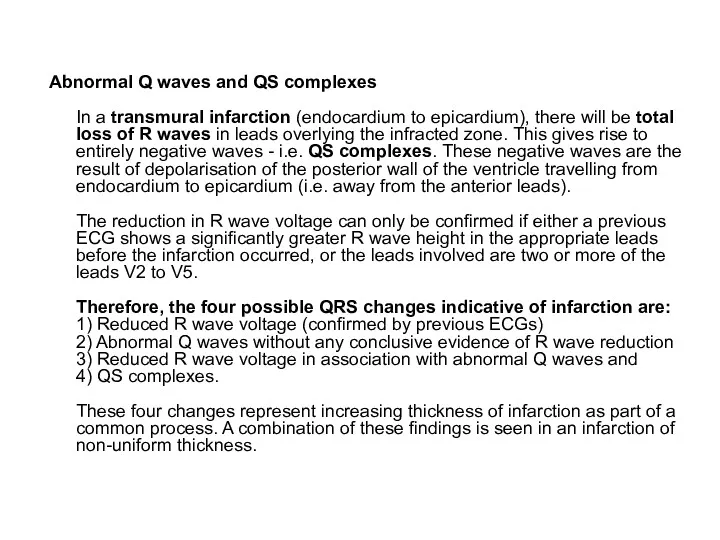
- 26. Abnormal Q waves and QS complexes In a transmural infarction (endocardium to epicardium), there will be
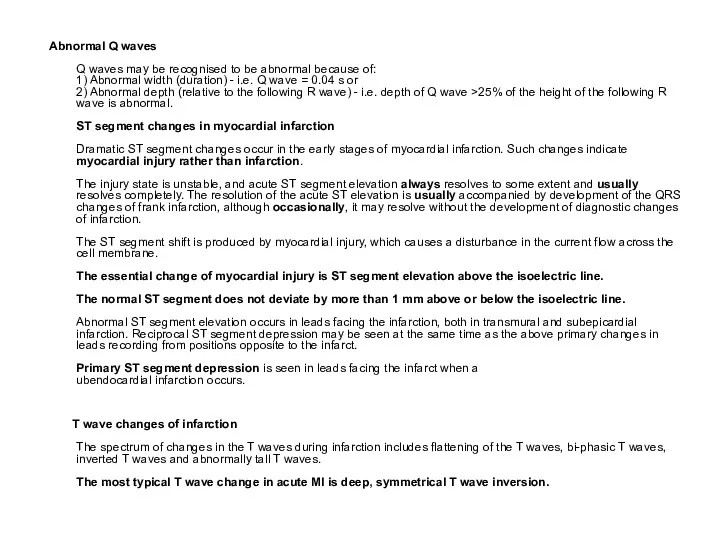
- 27. Abnormal Q waves Q waves may be recognised to be abnormal because of: 1) Abnormal width
- 28. The essential change of myocardial injury is ST segment elevation above the isoelectric line. The normal
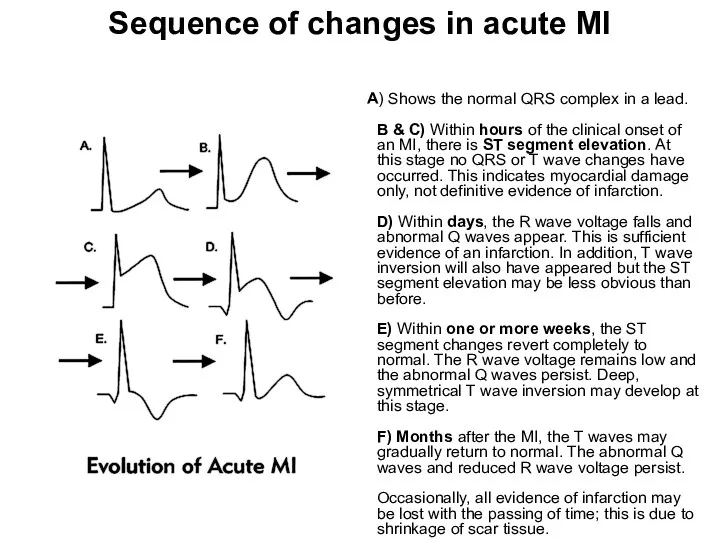
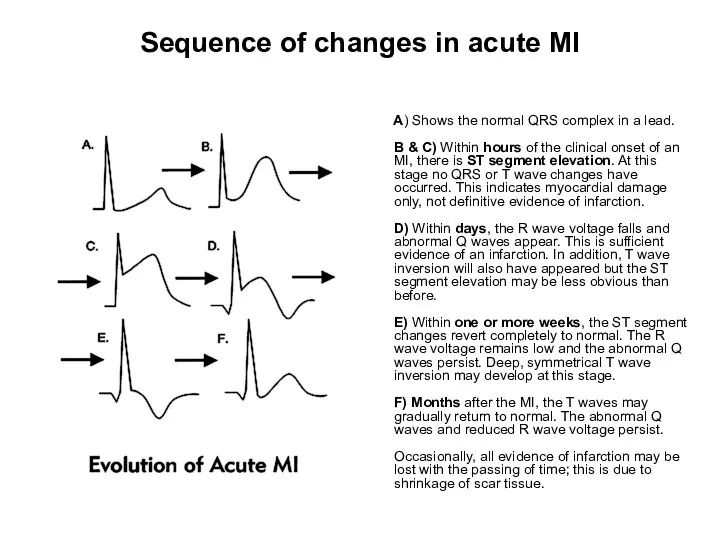
- 29. Sequence of changes in acute MI A) Shows the normal QRS complex in a lead. B
- 30. Left Circumflex Artery or Right Coronary Artery An ECG can not only tell you if an
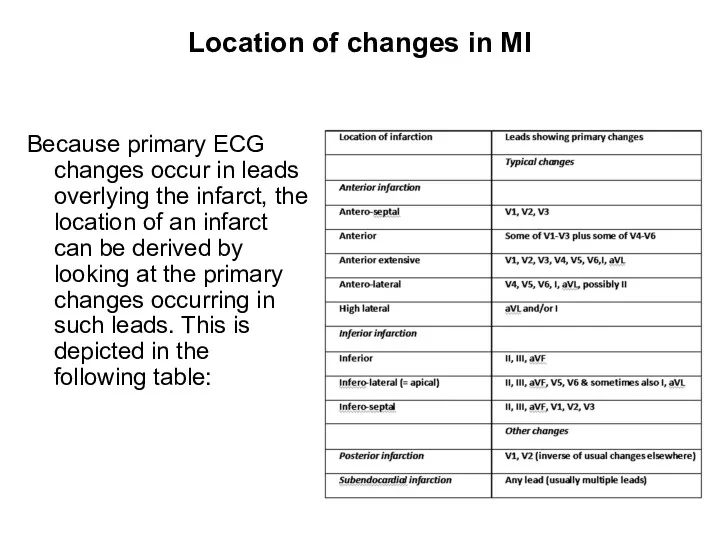
- 31. Location of changes in MI Because primary ECG changes occur in leads overlying the infarct, the
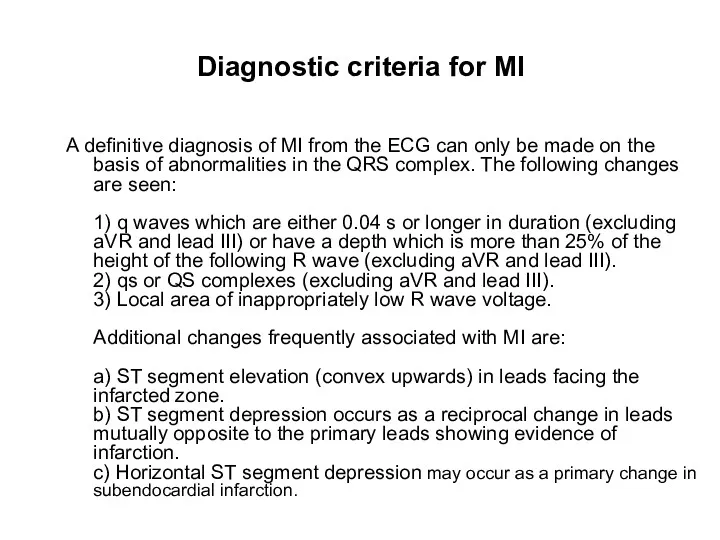
- 32. Diagnostic criteria for MI A definitive diagnosis of MI from the ECG can only be made
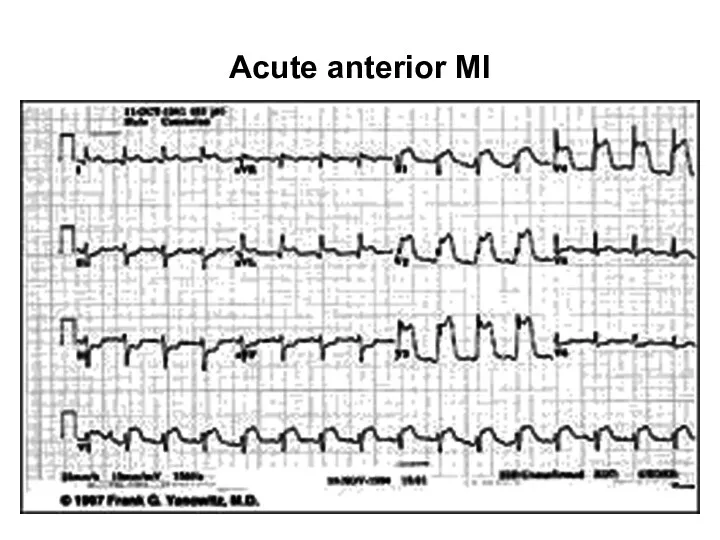
- 34. Acute anterior MI
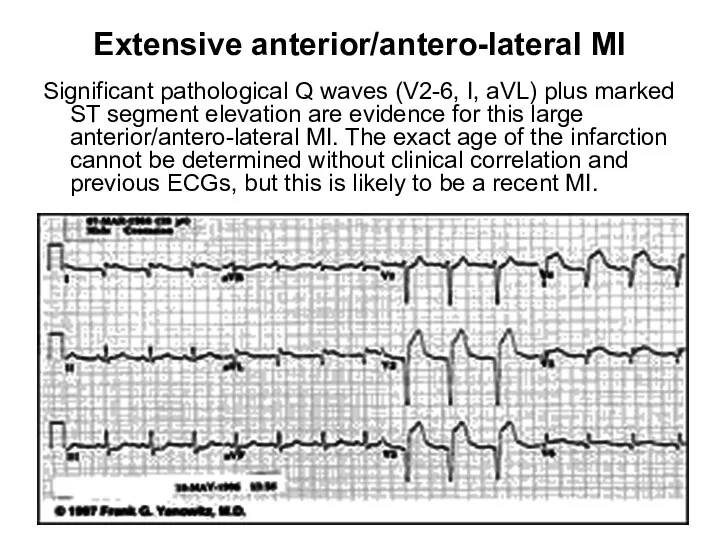
- 35. Extensive anterior/antero-lateral MI Significant pathological Q waves (V2-6, I, aVL) plus marked ST segment elevation are
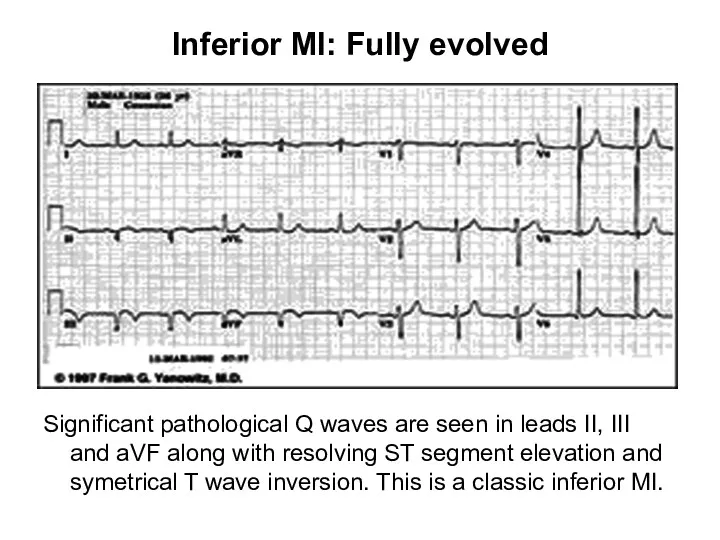
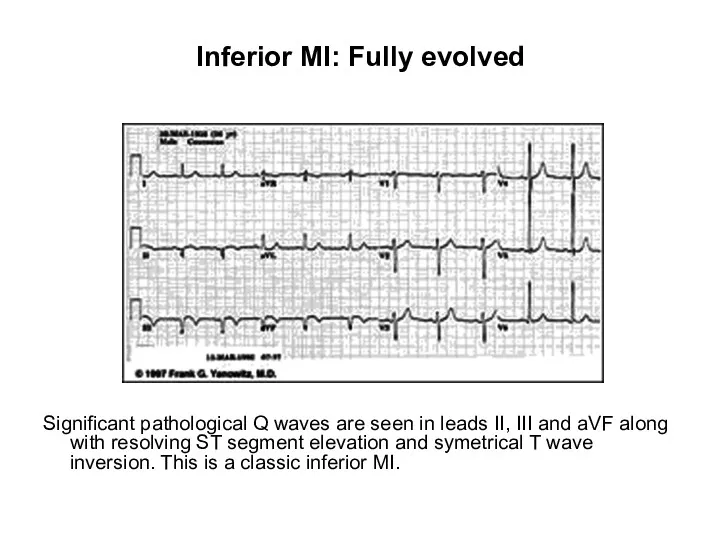
- 36. Inferior MI: Fully evolved Significant pathological Q waves are seen in leads II, III and aVF
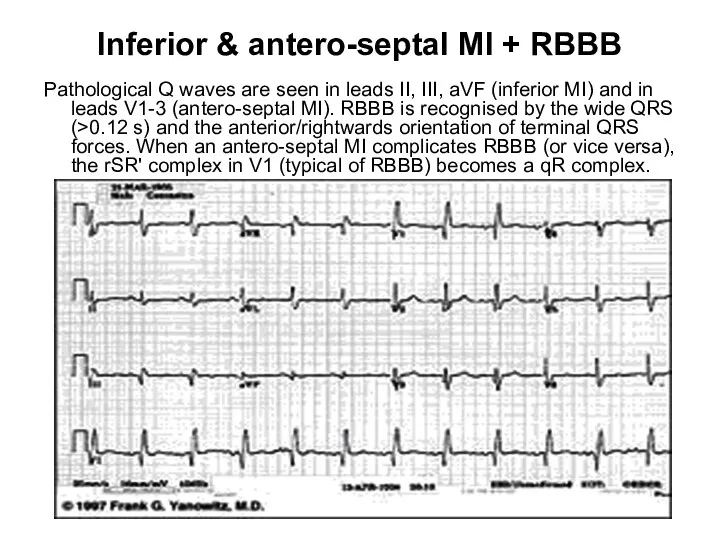
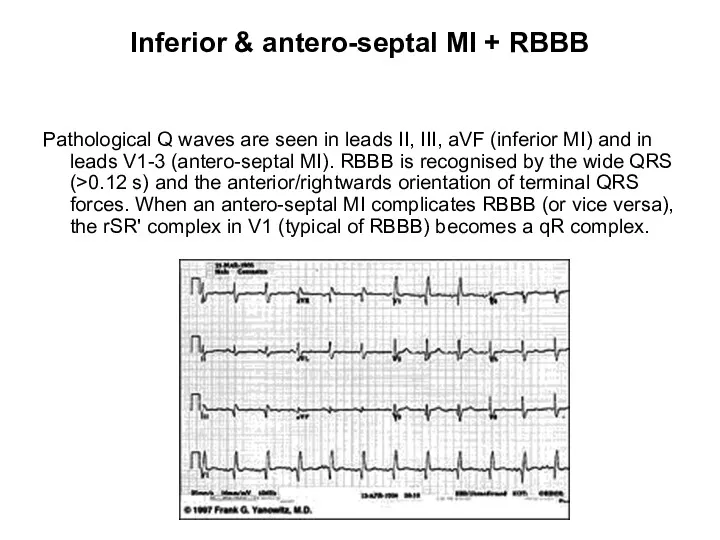
- 37. Inferior & antero-septal MI + RBBB Pathological Q waves are seen in leads II, III, aVF
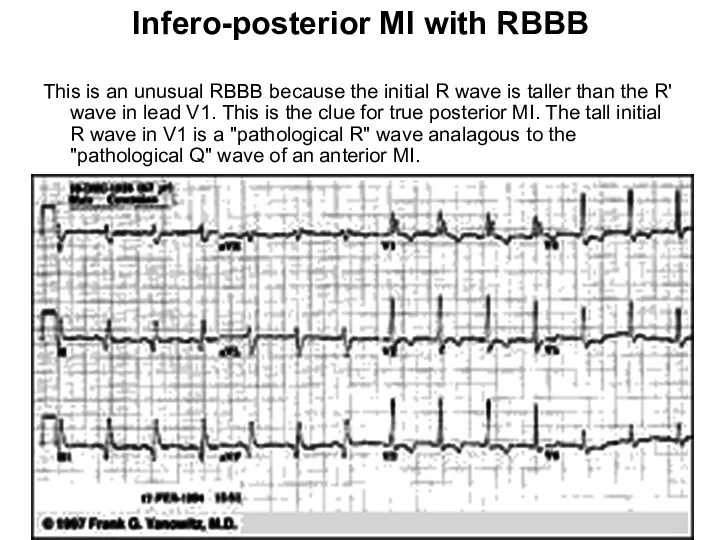
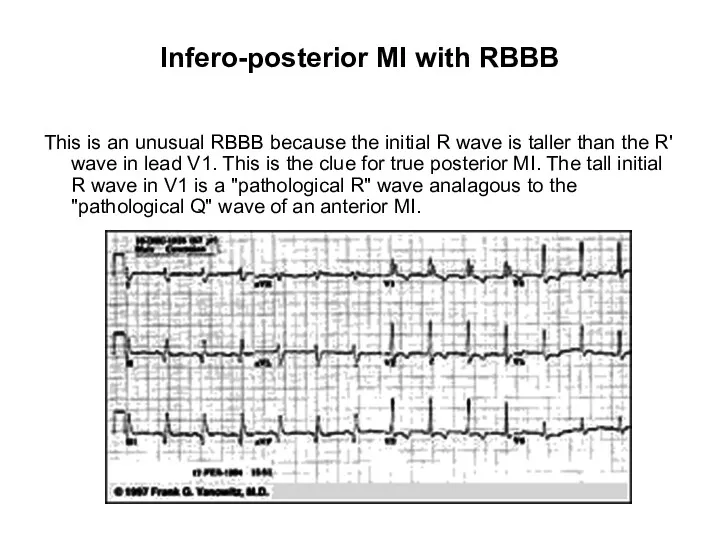
- 38. Infero-posterior MI with RBBB This is an unusual RBBB because the initial R wave is taller
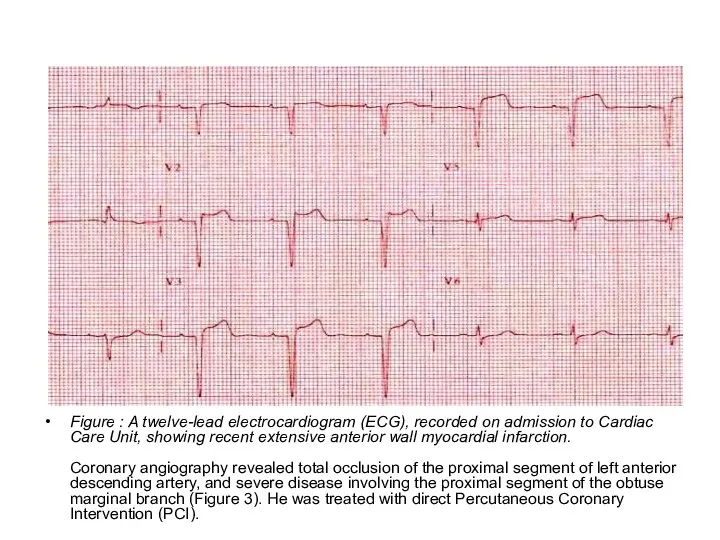
- 39. extensive anterior wall myocardial infarction. Figure : A twelve-lead electrocardiogram (ECG), recorded on admission to Cardiac
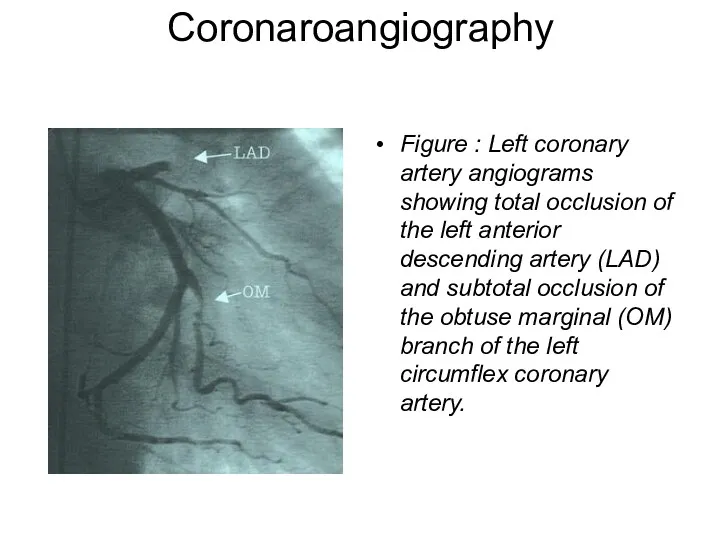
- 40. Coronaroangiography Figure : Left coronary artery angiograms showing total occlusion of the left anterior descending artery
- 41. Heart Attack Treatment A heart attack is a medical emergency! Hospitalization is required and, possibly, intensive
- 42. Management of Patients with non-ST-elevation AMI in the prehospital setting Calling an ambulance Clinical death –
- 43. Management of Patients with non-ST-elevation AMI in the prehospital setting Inspection and physical examination Taking ECG
- 44. TREATMENT OF NON-ST-ELEVATION AMI A list and range of obligatory medical services 1. Antithrombotic drugs: acetylsalicylic
- 45. TREATMENT OF NON-ST-ELEVATION AMI A list and range of obligatory medical services 2. Anticoagulants: Unfractionated heparin
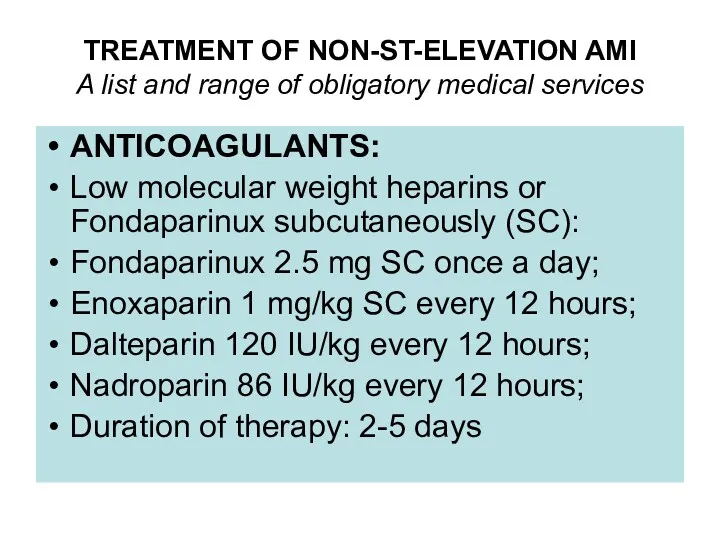
- 46. TREATMENT OF NON-ST-ELEVATION AMI A list and range of obligatory medical services ANTICOAGULANTS: Low molecular weight
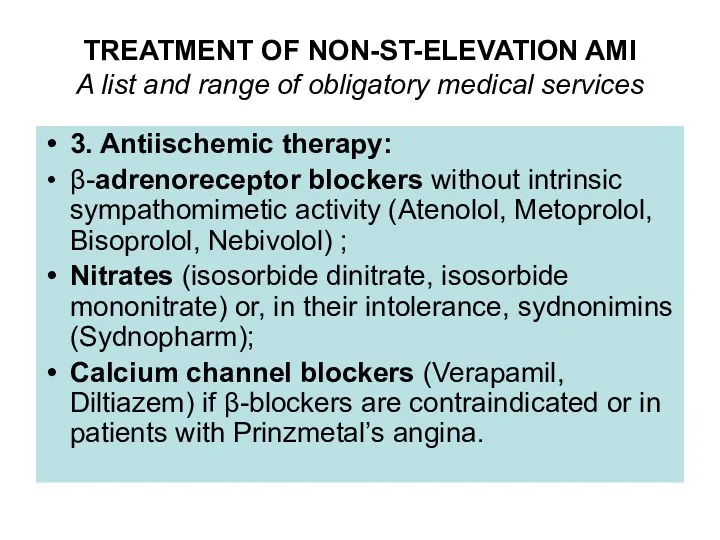
- 47. TREATMENT OF NON-ST-ELEVATION AMI A list and range of obligatory medical services 3. Antiischemic therapy: β-adrenoreceptor
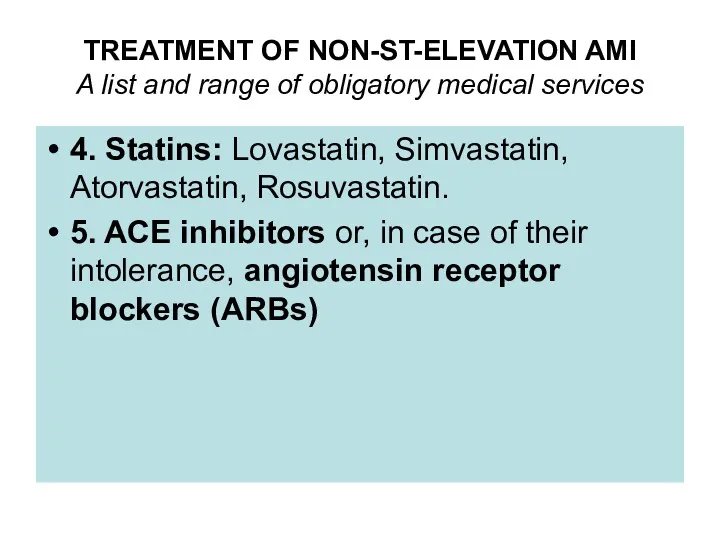
- 48. TREATMENT OF NON-ST-ELEVATION AMI A list and range of obligatory medical services 4. Statins: Lovastatin, Simvastatin,
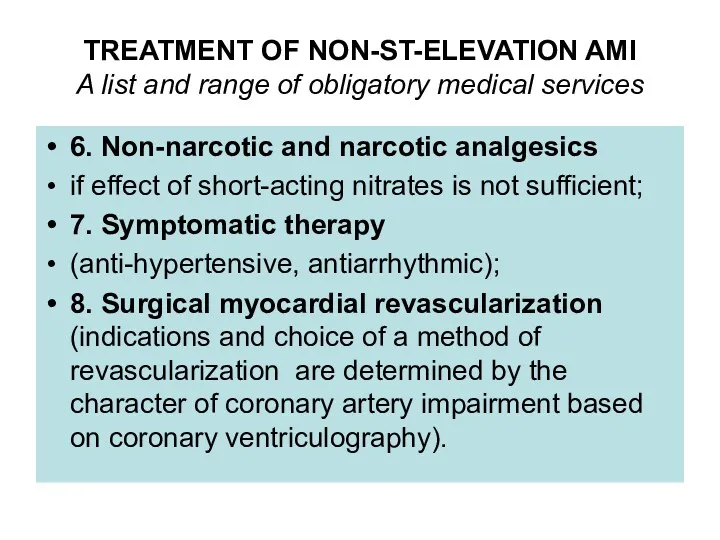
- 49. TREATMENT OF NON-ST-ELEVATION AMI A list and range of obligatory medical services 6. Non-narcotic and narcotic
- 50. Heart Attack Treatment PAIN CONTROL MEDICATIONS Sublingual (under the tongue) or intravenous (IV) nitrates such as
- 51. Basic therapy in ST-elevation AMI 1 – Pain relief (morphine 2-4 mg IV, every 10-15 minutes);
- 52. Basic therapy in ST-elevation AMI 6 – β-blockers to all patients who have no contraindications; 7
- 53. Thrombolysis Streptokinase – 1500 000 U in 100 ml of saline given as an IV infusion
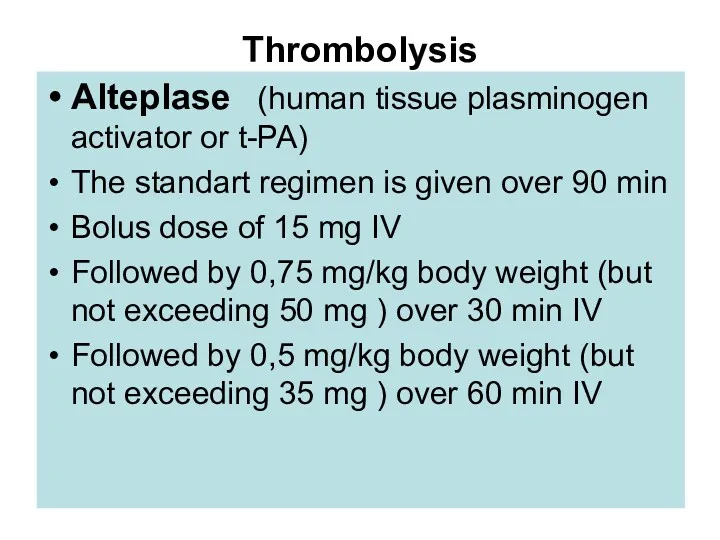
- 54. Thrombolysis Alteplase (human tissue plasminogen activator or t-PA) The standart regimen is given over 90 min
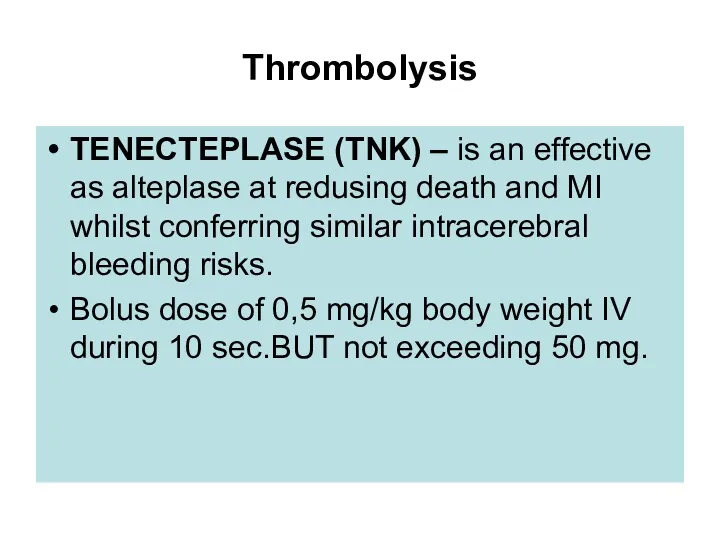
- 55. Thrombolysis TENECTEPLASE (TNK) – is an effective as alteplase at redusing death and MI whilst conferring
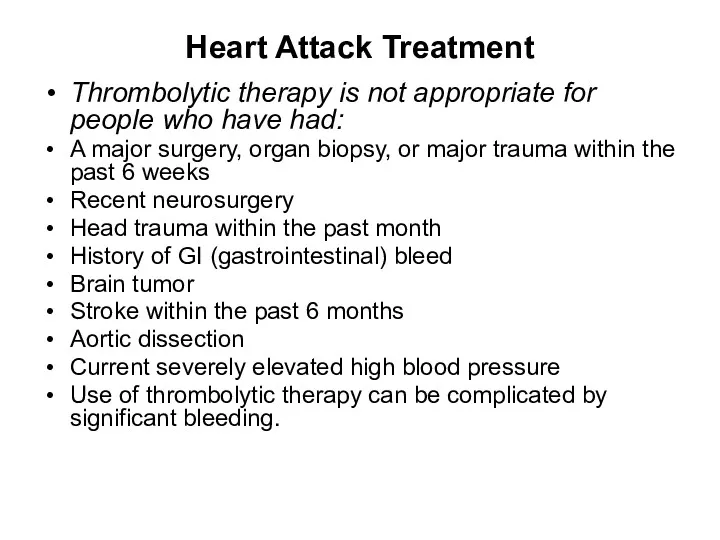
- 56. Heart Attack Treatment Thrombolytic therapy is not appropriate for people who have had: A major surgery,
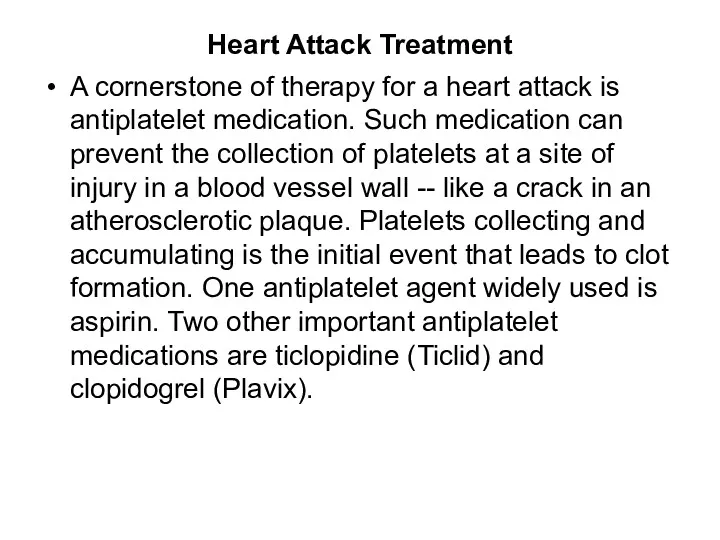
- 57. Heart Attack Treatment A cornerstone of therapy for a heart attack is antiplatelet medication. Such medication
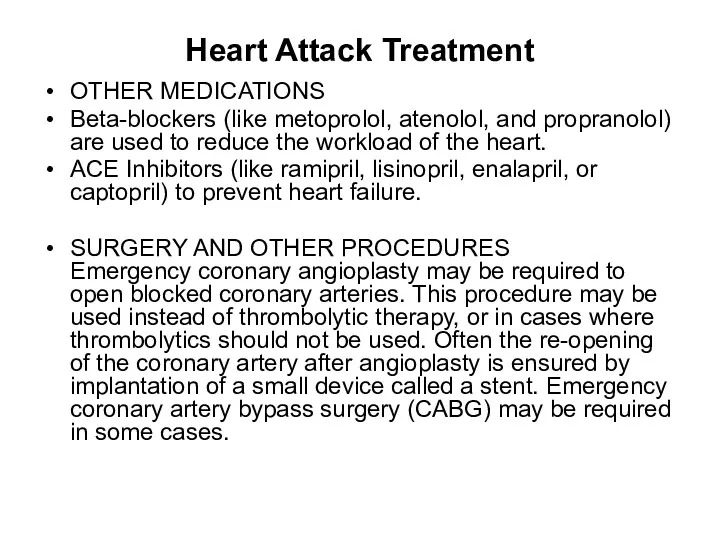
- 58. Heart Attack Treatment OTHER MEDICATIONS Beta-blockers (like metoprolol, atenolol, and propranolol) are used to reduce the
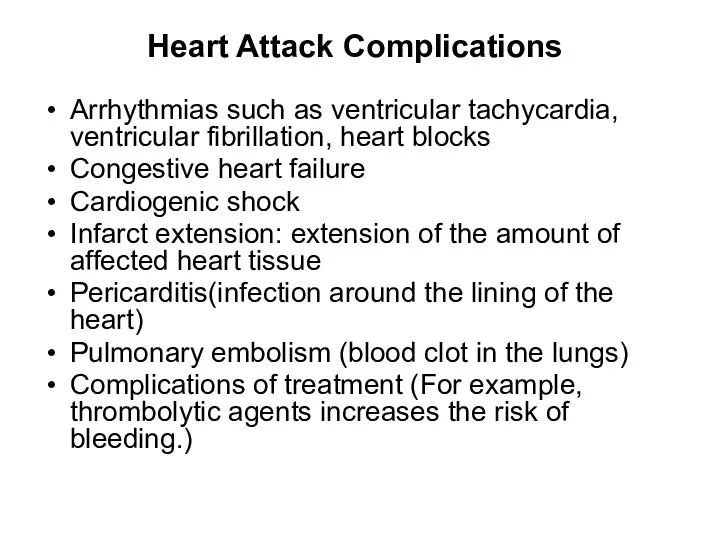
- 61. Heart Attack Complications Arrhythmias such as ventricular tachycardia, ventricular fibrillation, heart blocks Congestive heart failure Cardiogenic
- 62. Heart Attack Prognosis (Expectations) The expected outcome varies with the amount and location of damaged tissue.
- 63. Heart Attack Prevention To prevent a heart attack- control risk factors Control blood pressure. Control total
- 64. Heart Attack Prevention Lose weight if patient are overweight. Exercise daily or several times a week
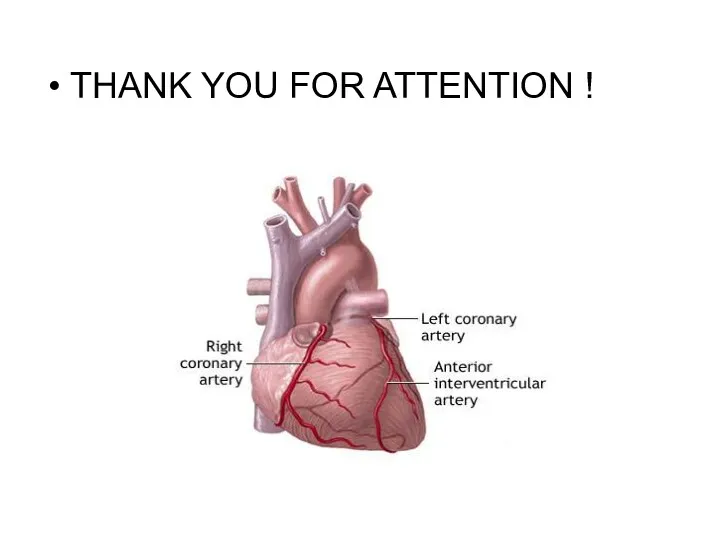
- 65. THANK YOU FOR ATTENTION !
- 66. (Post Myocardial Infarction ECG Wave Tracings) Various phases can be seen through ECG wave tracings following
- 68. Heart Attack Treatment : A heart attack is a medical emergency! Hospitalization is required and, possibly,
- 69. Thrombolytic therapy is not appropriate for people who have had: A major surgery, organ biopsy, or
- 70. Heart Attack Prognosis (Expectations) : The expected outcome varies with the amount and location of damaged
- 71. Heart Attack Complications : Arrhythmiassuch as ventricular tachycardia, ventricular fibrillation, heart blocks Congestive heart failure Cardiogenic
- 72. INTRODUCTION Despite its low sensitivity and specificity (67% and 72%, respectively), exercise testing has remained one
- 73. CASE PRESENTATION On October 02, 2006, a 56 year-old smoker male presented to our emergency room
- 74. On November 21, 2006, he presented to our ER again with several hours of mid-sternal chest
- 75. Figure 2: A twelve-lead electrocardiogram (ECG), recorded on admission to Cardiac Care Unit, showing recent extensive
- 76. Figure 3: Left coronary artery angiograms showing total occlusion of the left anterior descending artery (LAD)
- 77. DISCUSSION Exercise stress testing has traditionally served as a noninvasive tool in the diagnosis of coronary
- 78. Typical or definite angina (table 1) makes the pretest probability of obstructive CAD so high that
- 79. Major non-electrocardiographic observations that carry prognostic importance include the maximum work capacity, the peak systolic blood
- 80. These changes may lead to the conversion of previously stable and non-obstructive plaques to unstable and
- 81. ECG Basics The electrocardiogram (ECG) is a diagnostic tool that measures and records the electrical activity
- 82. ECG Leads - Views of the Heart The ECG records the electrical activity that results when
- 83. Duration of a waveform, segment, or interval is determined by counting the blocks from the beginning
- 84. P-Wave: represents atrial depolarization - the time necessary for an electrical impulse from the sinoatrial (SA)
- 85. QRS Complex: represents ventricular depolarisation. The QRS complex consists of 3 waves: the Q wave, the
- 86. Q-T Interval: represents the time necessary for ventricular depolarization and repolarization. Location: Extends from the beginning
- 87. S-T Segment: represents the end of the ventricular depolarization and the beginning of ventricular repolarization. Location:
- 88. The ECG and Myocardial Infarction During an MI, the ECG goes through a series of abnormalities.
- 89. ST Elevation The abnormality lasts for a very short time, and then elevation of the ST
- 90. Left Circumflex Artery or Right Coronary Artery An ECG can not only tell you if an
- 91. Right Ventricular Myocardial Infarction EKG Characteristics This EKG shows an Acute Inferior Myocardial Infarction which is
- 92. ECG Rounds A 76-year-old retired physician came to the clinic for a medical check-up. He had
- 93. Inferior Myocardial Infarction with AV Block
- 94. Characteristics Both bradyarrhythmias and conduction disturbances can be seen with myocardial infarctions and are generally related
- 95. The ECG in acute myocardial infarction (MI) Acute MI may cause changes in the QRS complex,
- 96. Abnormal Q waves and QS complexes In a transmural infarction (endocardium to epicardium), there will be
- 97. Abnormal Q waves Q waves may be recognised to be abnormal because of: 1) Abnormal width
- 98. Sequence of changes in acute MI A) Shows the normal QRS complex in a lead. B
- 99. Location of changes in MI Because primary ECG changes occur in leads overlying the infarct, the
- 100. Examples of ECGs depicting MI Antero-septal MI: Fully evolved The QS complexes, resolving ST segment elevation
- 101. Acute anterior MI
- 102. Extensive anterior/antero-lateral MI Significant pathological Q waves (V2-6, I, aVL) plus marked ST segment elevation are
- 103. High lateral wall MI
- 104. Inferior MI: Fully evolved Significant pathological Q waves are seen in leads II, III and aVF
- 105. Inferior & antero-septal MI + RBBB Pathological Q waves are seen in leads II, III, aVF
- 106. Postero-lateral MI: Fully evolved The "true" posterior MI is recognised by pathological R waves in leads
- 107. Infero-posterior MI with RBBB This is an unusual RBBB because the initial R wave is taller
- 108. Diagnostic criteria for MI A definitive diagnosis of MI from the ECG can only be made
- 109. Reciprocal changes In addition to the primary changes that occur in the ECG leads facing the
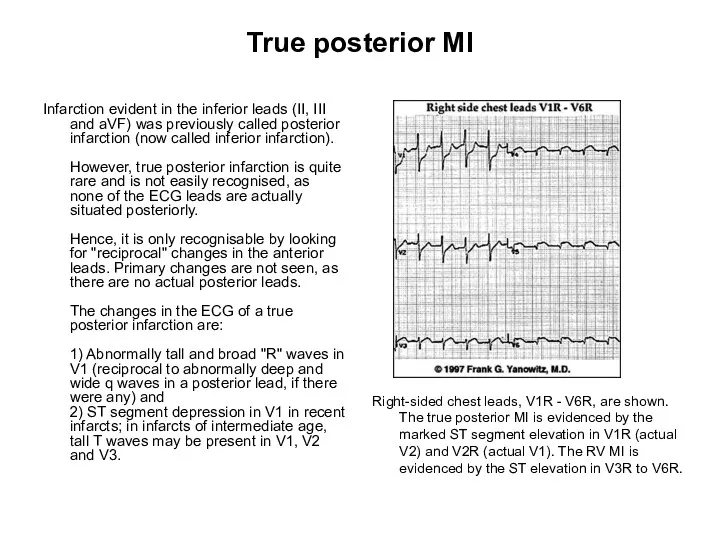
- 110. True posterior MI Infarction evident in the inferior leads (II, III and aVF) was previously called
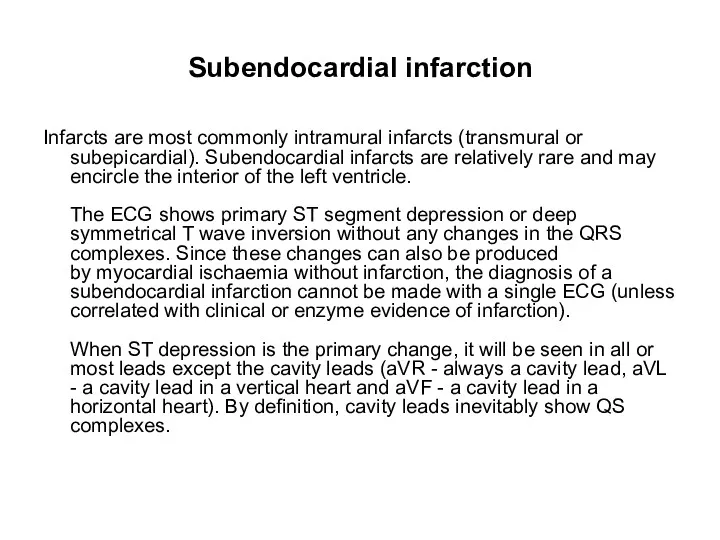
- 111. Subendocardial infarction Infarcts are most commonly intramural infarcts (transmural or subepicardial). Subendocardial infarcts are relatively rare
- 113. Скачать презентацию
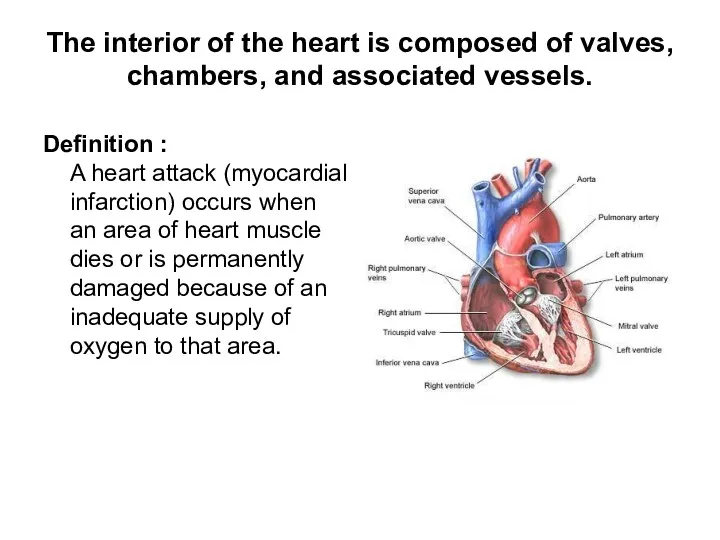
The interior of the heart is composed of valves, chambers, and
The interior of the heart is composed of valves, chambers, and
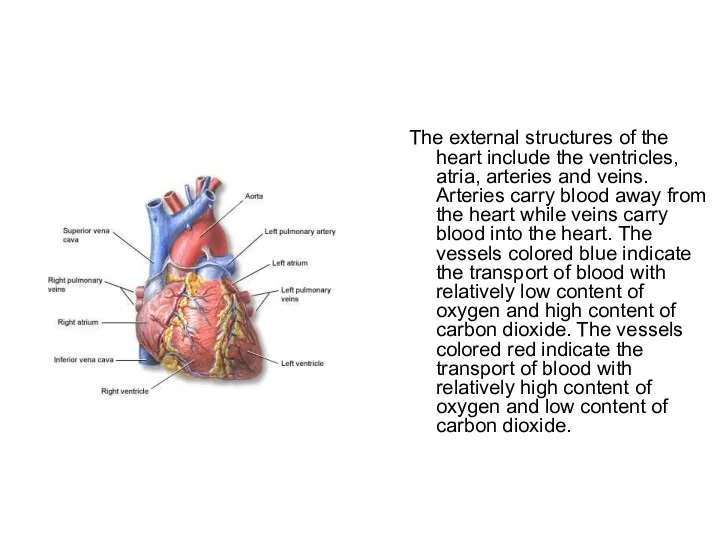
The external structures of the heart include the ventricles, atria, arteries
The external structures of the heart include the ventricles, atria, arteries
DEFINITION
Myocardial infarction (MI) – ischaemic necrosis is almost always due to
DEFINITION
Myocardial infarction (MI) – ischaemic necrosis is almost always due to
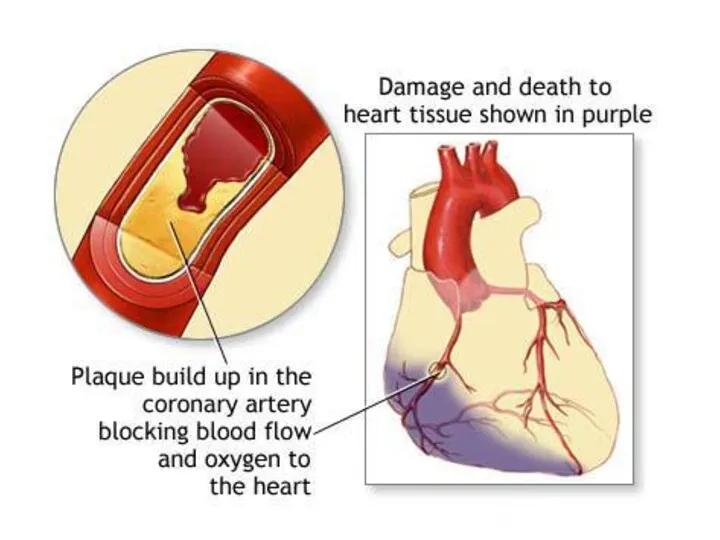
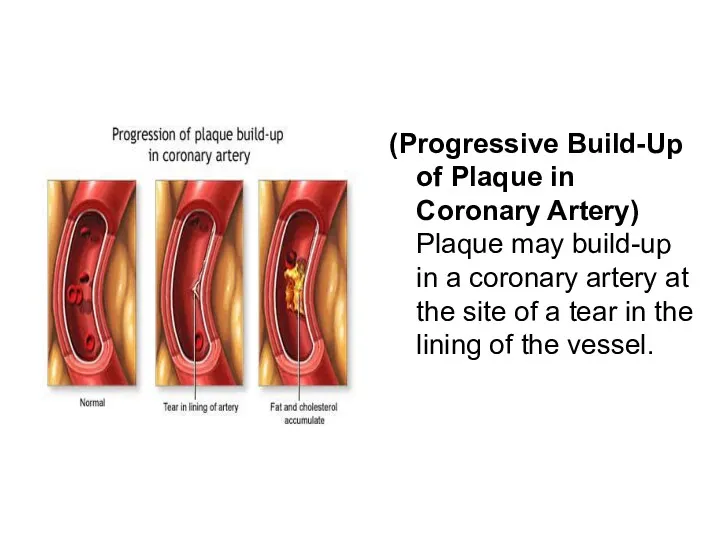
(Progressive Build-Up of Plaque in Coronary Artery)
Plaque may build-up in a
(Progressive Build-Up of Plaque in Coronary Artery) Plaque may build-up in a
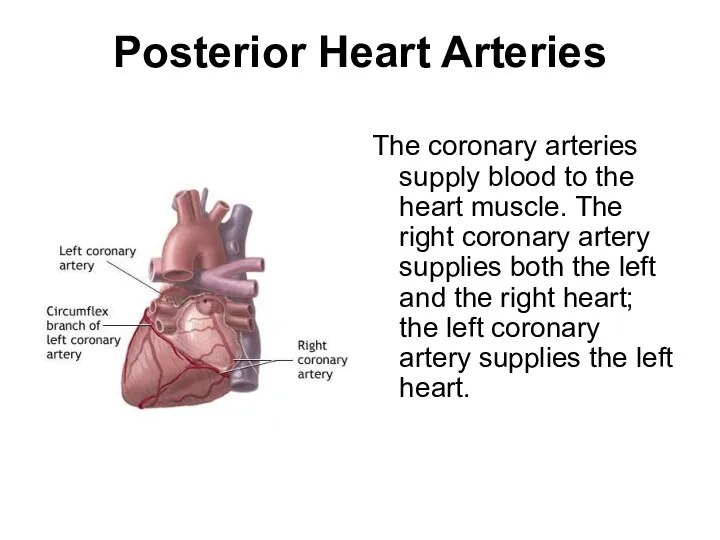
Posterior Heart Arteries
The coronary arteries supply blood to the heart muscle.
Posterior Heart Arteries
The coronary arteries supply blood to the heart muscle.
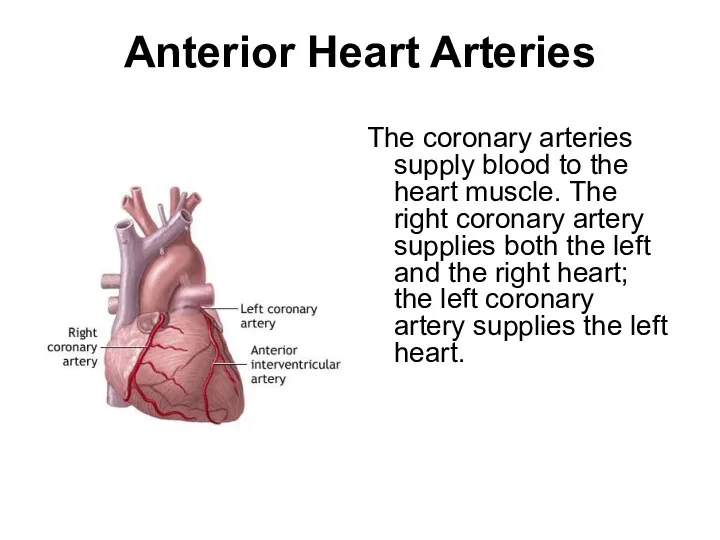
Anterior Heart Arteries
The coronary arteries supply blood to the heart muscle.
Anterior Heart Arteries
The coronary arteries supply blood to the heart muscle.
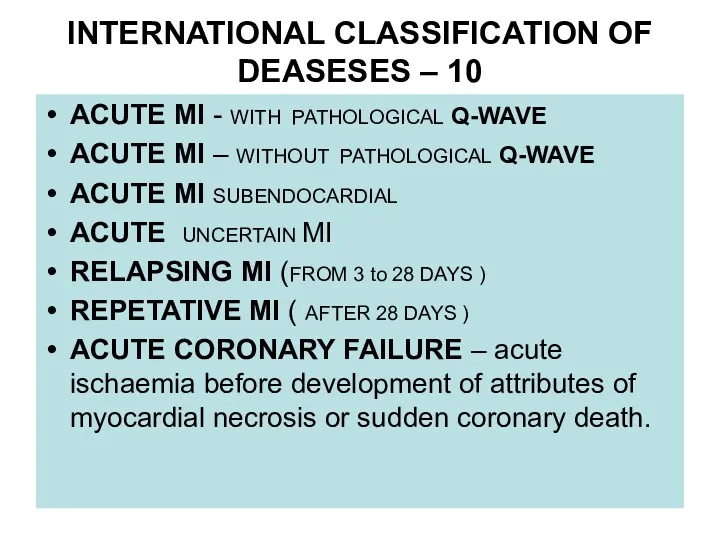
INTERNATIONAL CLASSIFICATION OF DEASESES – 10
ACUTE MI - WITH PATHOLOGICAL
INTERNATIONAL CLASSIFICATION OF DEASESES – 10
ACUTE MI - WITH PATHOLOGICAL
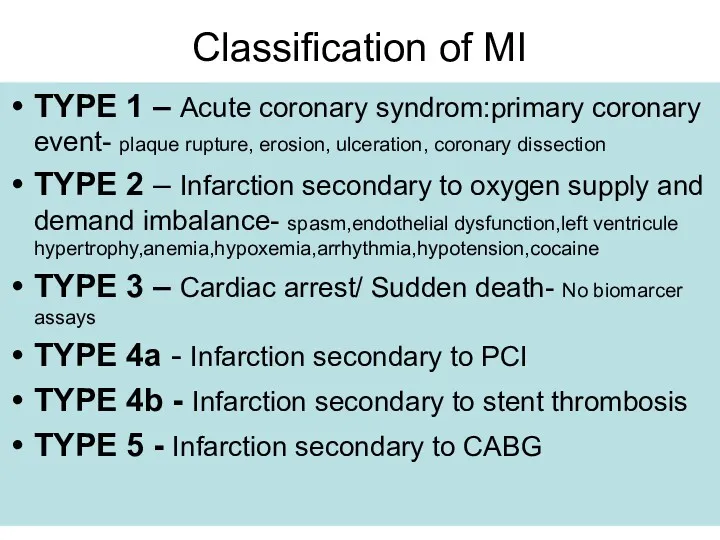
Classification of MI
TYPE 1 – Acute coronary syndrom:primary coronary event- plaque
Classification of MI
TYPE 1 – Acute coronary syndrom:primary coronary event- plaque
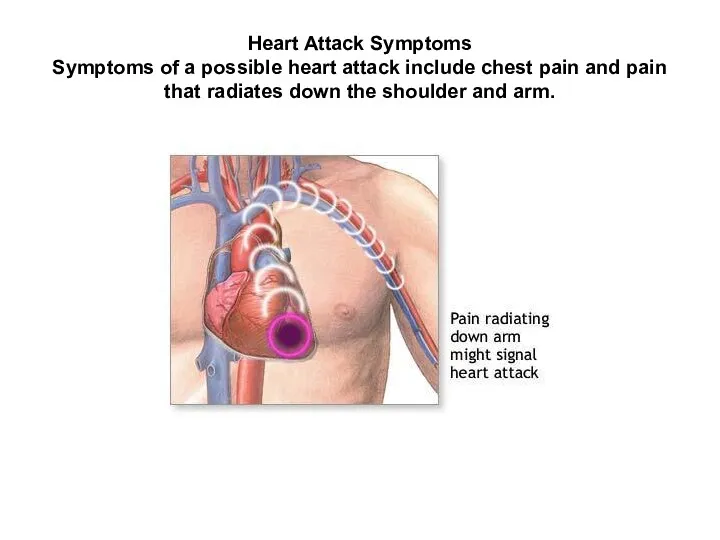
Heart Attack Symptoms
Symptoms of a possible heart attack include chest pain
Heart Attack Symptoms Symptoms of a possible heart attack include chest pain
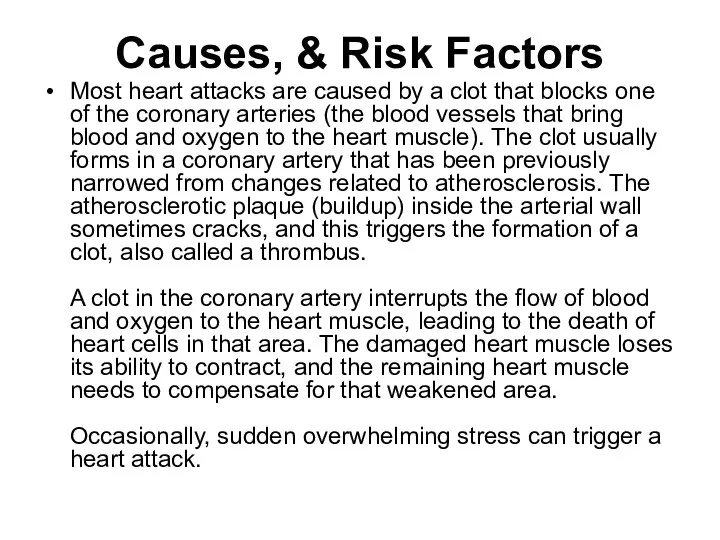
Causes, & Risk Factors
Most heart attacks are caused by a clot
Causes, & Risk Factors
Most heart attacks are caused by a clot
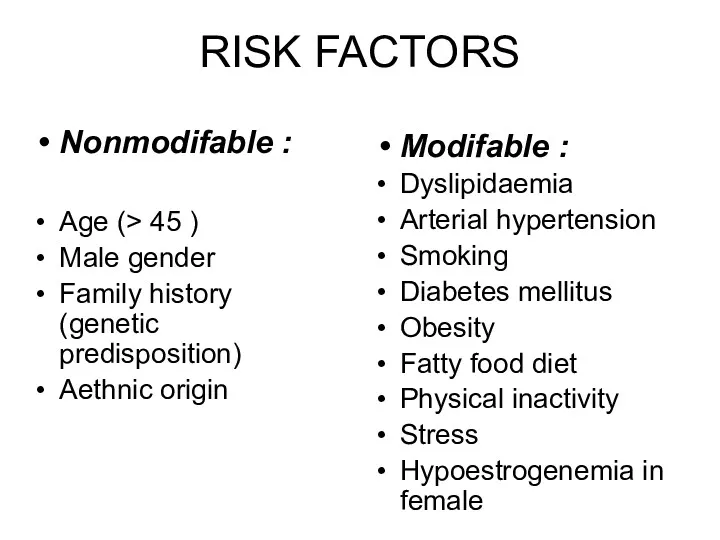
RISK FACTORS
Nonmodifable :
Age (> 45 )
Male gender
Family history (genetic predisposition)
Aethnic origin
RISK FACTORS
Nonmodifable :
Age (> 45 )
Male gender
Family history (genetic predisposition)
Aethnic origin
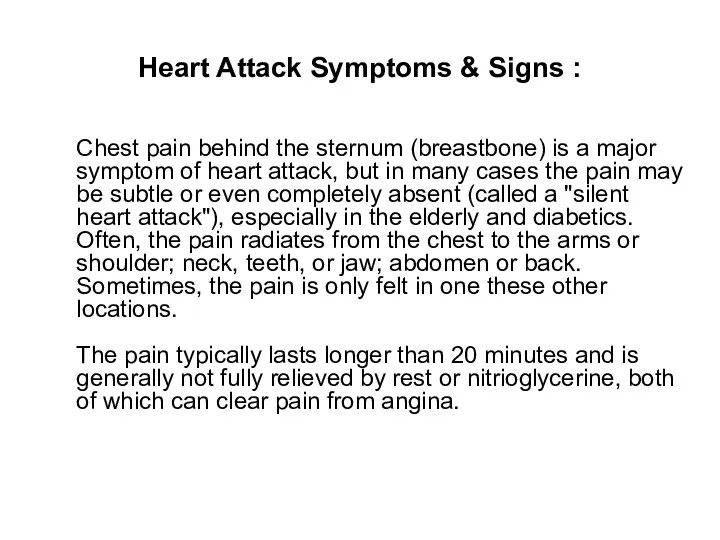
Heart Attack Symptoms & Signs :
Chest pain behind the sternum (breastbone)
Heart Attack Symptoms & Signs :
Chest pain behind the sternum (breastbone)
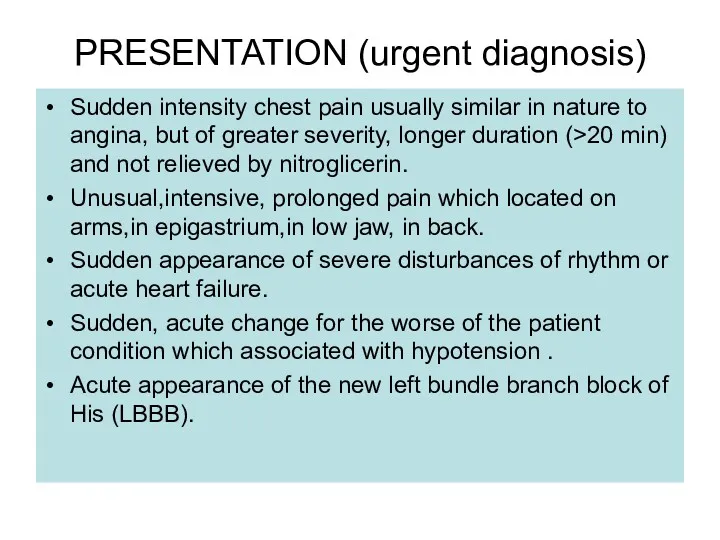
PRESENTATION (urgent diagnosis)
Sudden intensity chest pain usually similar in nature to
PRESENTATION (urgent diagnosis)
Sudden intensity chest pain usually similar in nature to
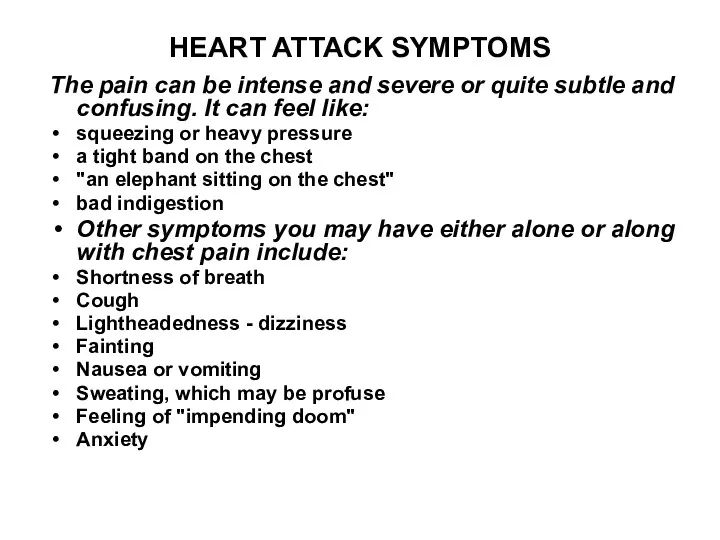
HEART ATTACK SYMPTOMS
The pain can be intense and severe or quite
HEART ATTACK SYMPTOMS
The pain can be intense and severe or quite
Variants of AMI clinical course
Anginous – typical (70-90%);
Asthmatic – cardiac asthma
Variants of AMI clinical course
Anginous – typical (70-90%);
Asthmatic – cardiac asthma
Clinical course of MI
Latent period till 28 days (in which presenting
Clinical course of MI
Latent period till 28 days (in which presenting
Criterias of diagnosis
Typical clinical signs (combination of history)
Typical ECG changes (Q-wave,
Criterias of diagnosis
Typical clinical signs (combination of history)
Typical ECG changes (Q-wave,
DIAGNOSIS OF MI
The diagnosis is based on thorough analysis of clinical
DIAGNOSIS OF MI
The diagnosis is based on thorough analysis of clinical
Heart Attack Diagnosis & Tests :
During a physical examination, the doctor
Heart Attack Diagnosis & Tests :
During a physical examination, the doctor
The ECG in acute myocardial infarction (MI)
Acute MI may cause
The ECG in acute myocardial infarction (MI)
Acute MI may cause
The ECG and Myocardial Infarction
During an MI, the ECG goes through
The ECG and Myocardial Infarction
During an MI, the ECG goes through
The ECG and Myocardial Infarction
The abnormality lasts for a very short
The ECG and Myocardial Infarction
The abnormality lasts for a very short
Abnormal Q waves and QS complexes
In a transmural infarction (endocardium
Abnormal Q waves and QS complexes In a transmural infarction (endocardium
Abnormal Q waves
Q waves may be recognised to be abnormal
Abnormal Q waves Q waves may be recognised to be abnormal
The essential change of myocardial injury is ST segment elevation above
The essential change of myocardial injury is ST segment elevation above
Sequence of changes in acute MI
A) Shows the normal QRS
Sequence of changes in acute MI
A) Shows the normal QRS
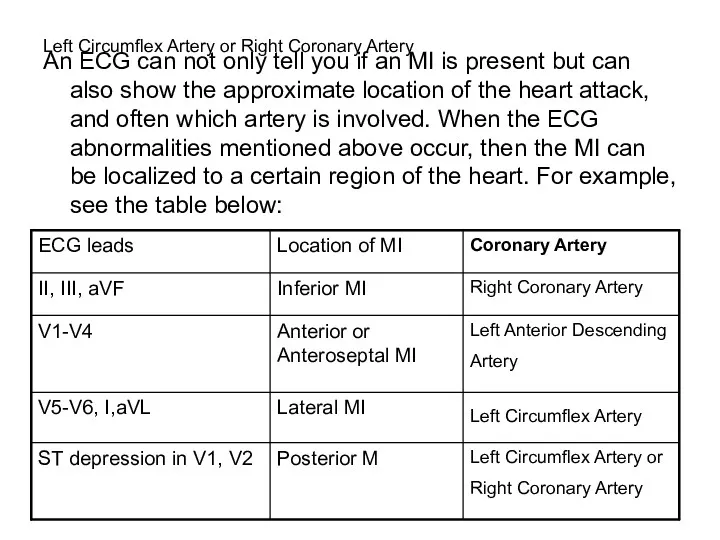
Left Circumflex Artery or Right Coronary Artery
An ECG can not
Left Circumflex Artery or Right Coronary Artery
An ECG can not
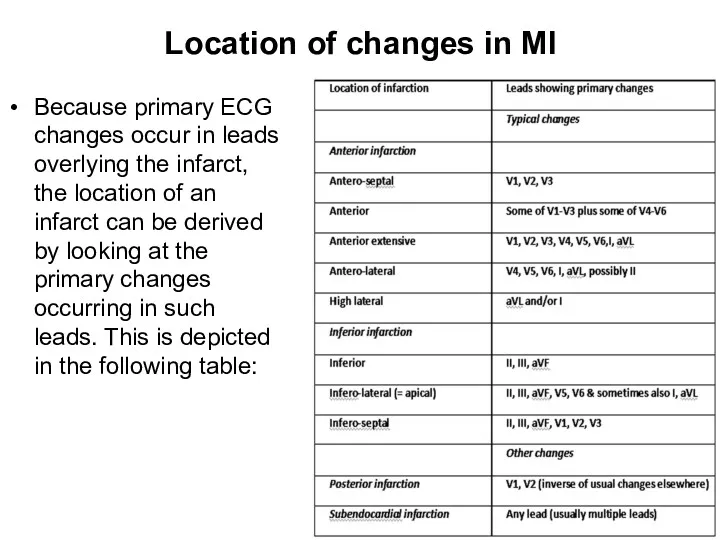
Location of changes in MI
Because primary ECG changes occur in leads
Location of changes in MI
Because primary ECG changes occur in leads
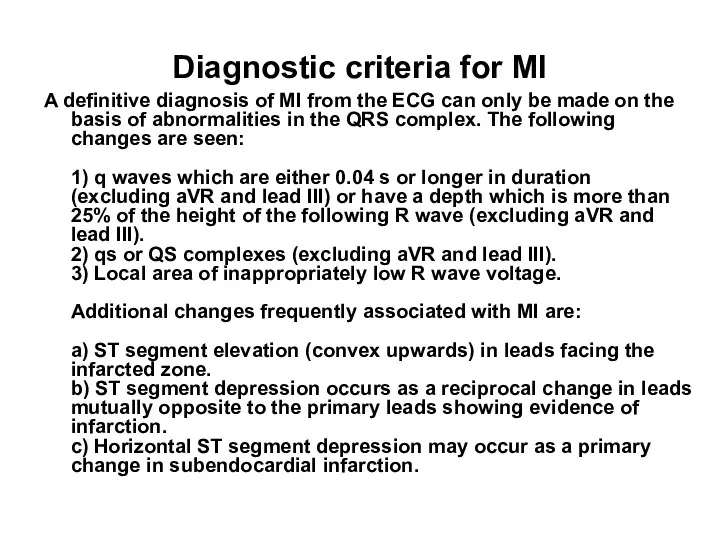
Diagnostic criteria for MI
A definitive diagnosis of MI from the ECG
Diagnostic criteria for MI
A definitive diagnosis of MI from the ECG
Acute anterior MI
Acute anterior MI
Extensive anterior/antero-lateral MI
Significant pathological Q waves (V2-6, I, aVL) plus marked
Extensive anterior/antero-lateral MI
Significant pathological Q waves (V2-6, I, aVL) plus marked
Inferior MI: Fully evolved
Significant pathological Q waves are seen in leads
Inferior MI: Fully evolved
Significant pathological Q waves are seen in leads
Inferior & antero-septal MI + RBBB
Pathological Q waves are seen in
Inferior & antero-septal MI + RBBB
Pathological Q waves are seen in
Infero-posterior MI with RBBB
This is an unusual RBBB because the initial
Infero-posterior MI with RBBB
This is an unusual RBBB because the initial
extensive anterior wall myocardial infarction.
Figure : A twelve-lead electrocardiogram (ECG), recorded
extensive anterior wall myocardial infarction.
Figure : A twelve-lead electrocardiogram (ECG), recorded
Coronaroangiography
Figure : Left coronary artery angiograms showing total occlusion of the
Coronaroangiography
Figure : Left coronary artery angiograms showing total occlusion of the
Heart Attack Treatment
A heart attack is a medical emergency! Hospitalization is
Heart Attack Treatment
A heart attack is a medical emergency! Hospitalization is
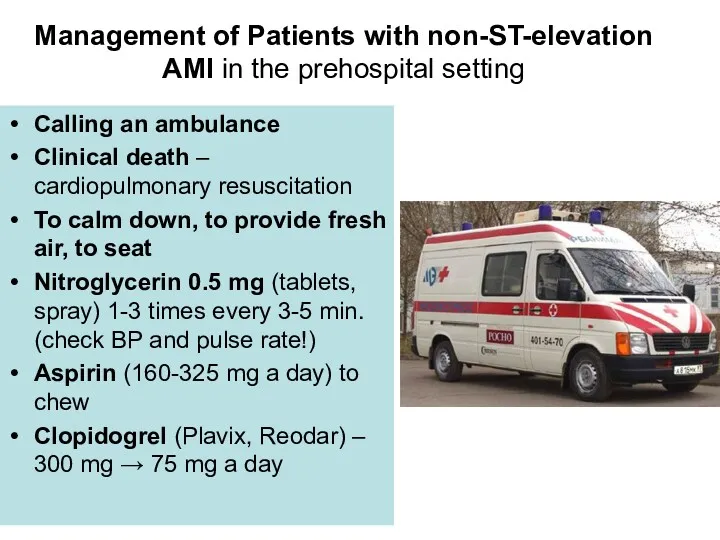
Management of Patients with non-ST-elevation AMI in the prehospital setting
Calling an
Management of Patients with non-ST-elevation AMI in the prehospital setting
Calling an
Management of Patients with non-ST-elevation AMI in the prehospital setting
Inspection and
Management of Patients with non-ST-elevation AMI in the prehospital setting
Inspection and
TREATMENT OF NON-ST-ELEVATION AMI
A list and range of obligatory medical services
1.
TREATMENT OF NON-ST-ELEVATION AMI
A list and range of obligatory medical services
1.
TREATMENT OF NON-ST-ELEVATION AMI
A list and range of obligatory medical services
2.
TREATMENT OF NON-ST-ELEVATION AMI
A list and range of obligatory medical services
2.
TREATMENT OF NON-ST-ELEVATION AMI
A list and range of obligatory medical services
ANTICOAGULANTS:
TREATMENT OF NON-ST-ELEVATION AMI
A list and range of obligatory medical services
ANTICOAGULANTS:
TREATMENT OF NON-ST-ELEVATION AMI
A list and range of obligatory medical services
3.
TREATMENT OF NON-ST-ELEVATION AMI
A list and range of obligatory medical services
3.
TREATMENT OF NON-ST-ELEVATION AMI
A list and range of obligatory medical services
4.
TREATMENT OF NON-ST-ELEVATION AMI
A list and range of obligatory medical services
4.
TREATMENT OF NON-ST-ELEVATION AMI
A list and range of obligatory medical services
6.
TREATMENT OF NON-ST-ELEVATION AMI
A list and range of obligatory medical services
6.
Heart Attack Treatment
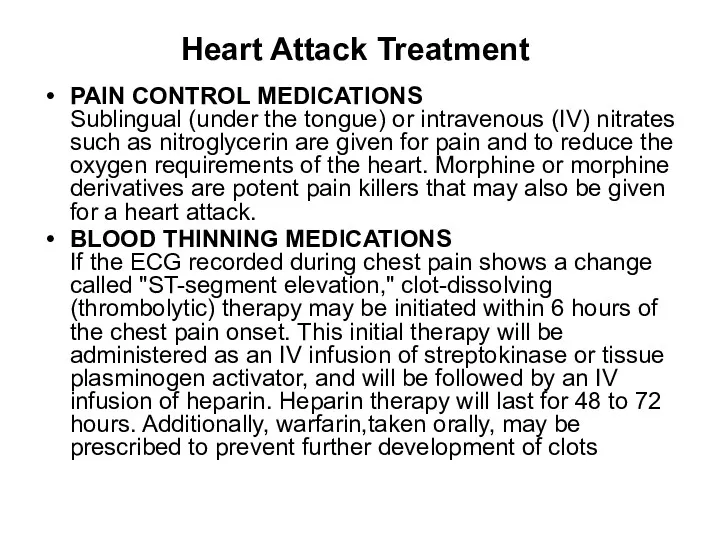
PAIN CONTROL MEDICATIONS
Sublingual (under the tongue) or intravenous (IV)
Heart Attack Treatment
PAIN CONTROL MEDICATIONS Sublingual (under the tongue) or intravenous (IV)
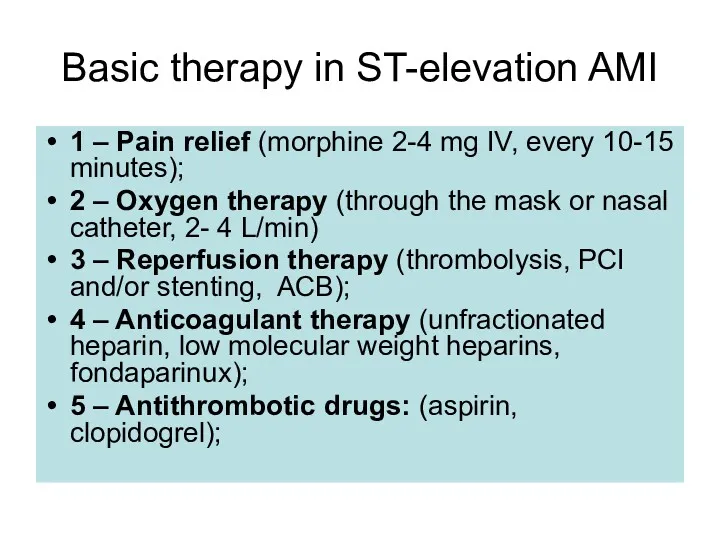
Basic therapy in ST-elevation AMI
1 – Pain relief (morphine 2-4 mg
Basic therapy in ST-elevation AMI
1 – Pain relief (morphine 2-4 mg
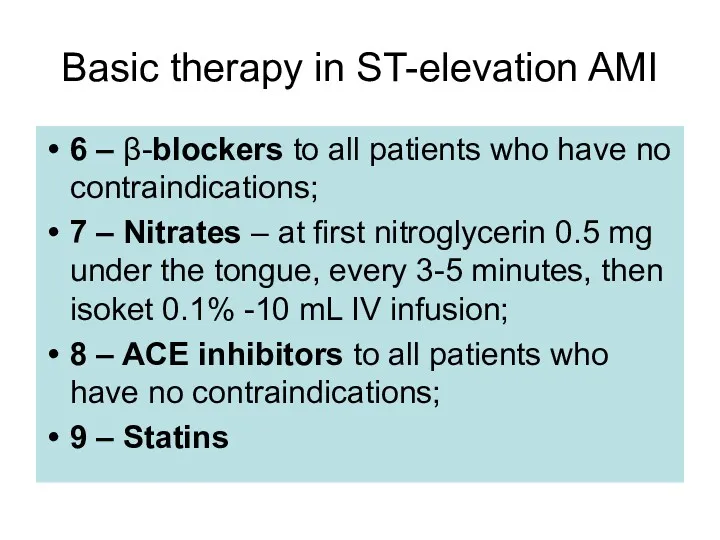
Basic therapy in ST-elevation AMI
6 – β-blockers to all patients who
Basic therapy in ST-elevation AMI
6 – β-blockers to all patients who
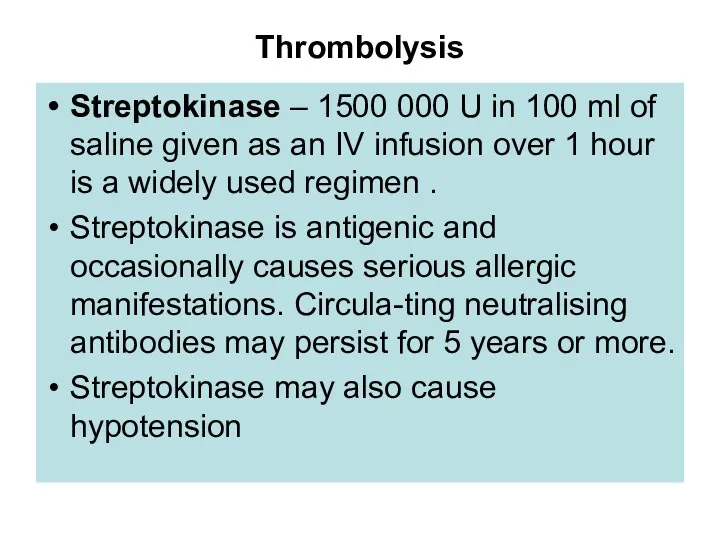
Thrombolysis
Streptokinase – 1500 000 U in 100 ml of saline given
Thrombolysis
Streptokinase – 1500 000 U in 100 ml of saline given
Thrombolysis
Alteplase (human tissue plasminogen activator or t-PA)
The standart regimen is given
Thrombolysis
Alteplase (human tissue plasminogen activator or t-PA)
The standart regimen is given
Thrombolysis
TENECTEPLASE (TNK) – is an effective as alteplase at redusing death
Thrombolysis
TENECTEPLASE (TNK) – is an effective as alteplase at redusing death
Heart Attack Treatment
Thrombolytic therapy is not appropriate for people who have
Heart Attack Treatment
Thrombolytic therapy is not appropriate for people who have
Heart Attack Treatment
A cornerstone of therapy for a heart attack is
Heart Attack Treatment
A cornerstone of therapy for a heart attack is
Heart Attack Treatment
OTHER MEDICATIONS
Beta-blockers (like metoprolol, atenolol, and propranolol) are used
Heart Attack Treatment
OTHER MEDICATIONS
Beta-blockers (like metoprolol, atenolol, and propranolol) are used
Heart Attack Complications
Arrhythmias such as ventricular tachycardia, ventricular fibrillation, heart blocks
Heart Attack Complications
Arrhythmias such as ventricular tachycardia, ventricular fibrillation, heart blocks
Heart Attack Prognosis (Expectations)
The expected outcome varies with the amount and
Heart Attack Prognosis (Expectations)
The expected outcome varies with the amount and
Heart Attack Prevention
To prevent a heart attack- control risk factors
Control
Heart Attack Prevention
To prevent a heart attack- control risk factors
Control
Heart Attack Prevention
Lose weight if patient are overweight.
Exercise daily or several
Heart Attack Prevention
Lose weight if patient are overweight.
Exercise daily or several
THANK YOU FOR ATTENTION !
THANK YOU FOR ATTENTION !
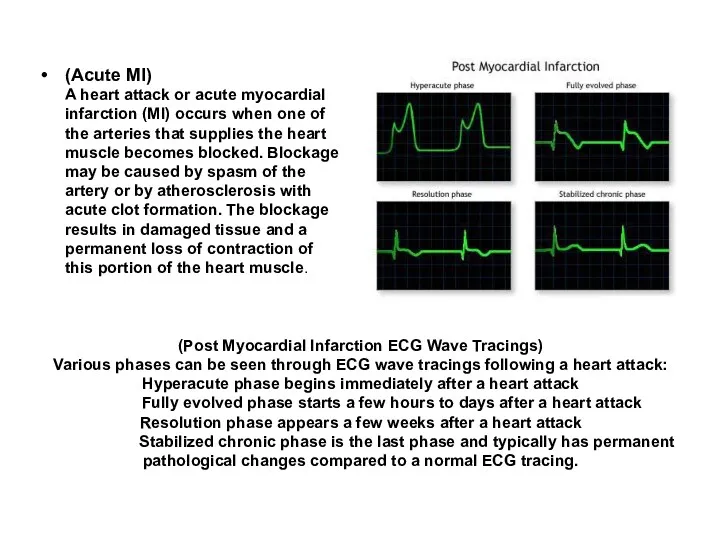
(Post Myocardial Infarction ECG Wave Tracings)
Various phases can be seen through
(Post Myocardial Infarction ECG Wave Tracings) Various phases can be seen through

Heart Attack Treatment :
A heart attack is a medical emergency! Hospitalization
Heart Attack Treatment :
A heart attack is a medical emergency! Hospitalization
Thrombolytic therapy is not appropriate for people who have had:
A major
Thrombolytic therapy is not appropriate for people who have had:
A major
Heart Attack Prognosis (Expectations) :
The expected outcome varies with the amount
Heart Attack Prognosis (Expectations) :
The expected outcome varies with the amount
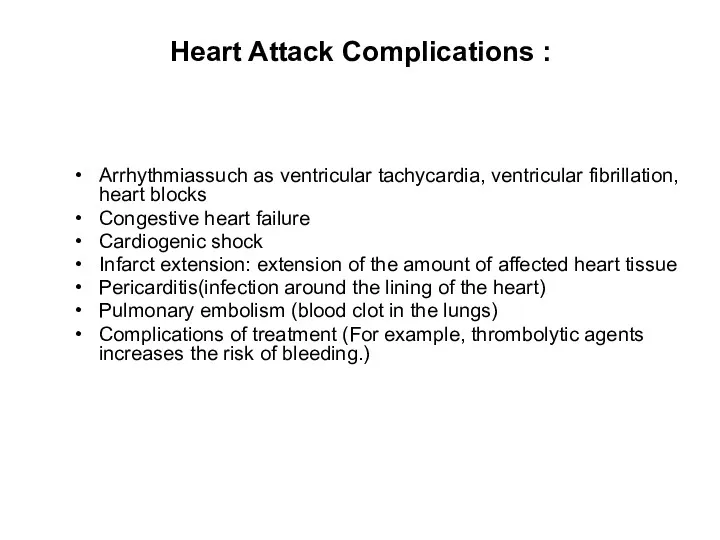
Heart Attack Complications :
Arrhythmiassuch as ventricular tachycardia, ventricular fibrillation, heart blocks
Heart Attack Complications :
Arrhythmiassuch as ventricular tachycardia, ventricular fibrillation, heart blocks
INTRODUCTION
Despite its low sensitivity and specificity (67% and 72%, respectively), exercise
INTRODUCTION
Despite its low sensitivity and specificity (67% and 72%, respectively), exercise
CASE PRESENTATION
On October 02, 2006, a 56 year-old smoker male presented
CASE PRESENTATION
On October 02, 2006, a 56 year-old smoker male presented
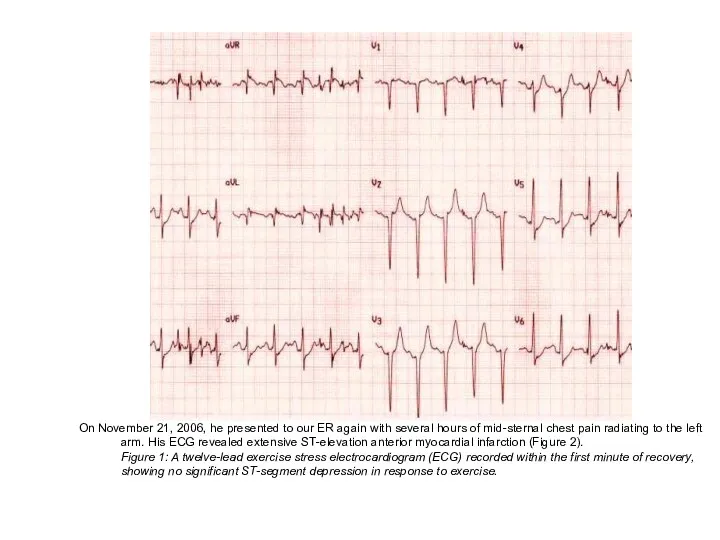
On November 21, 2006, he presented to our ER again with
On November 21, 2006, he presented to our ER again with
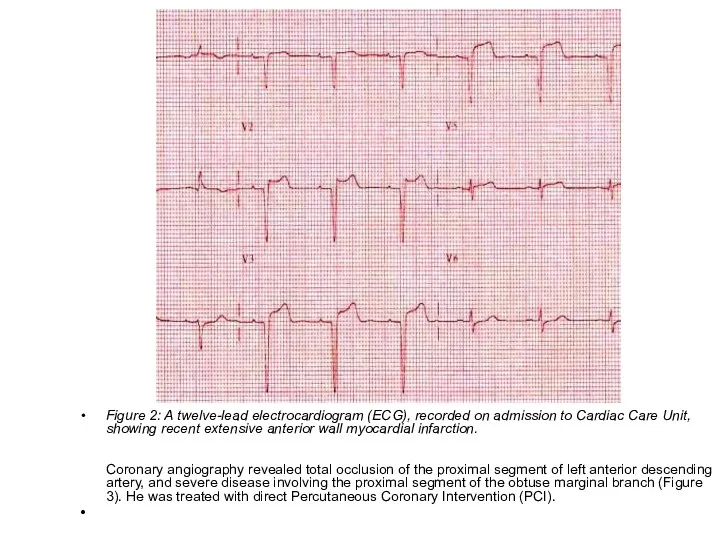
Figure 2: A twelve-lead electrocardiogram (ECG), recorded on admission to Cardiac
Figure 2: A twelve-lead electrocardiogram (ECG), recorded on admission to Cardiac
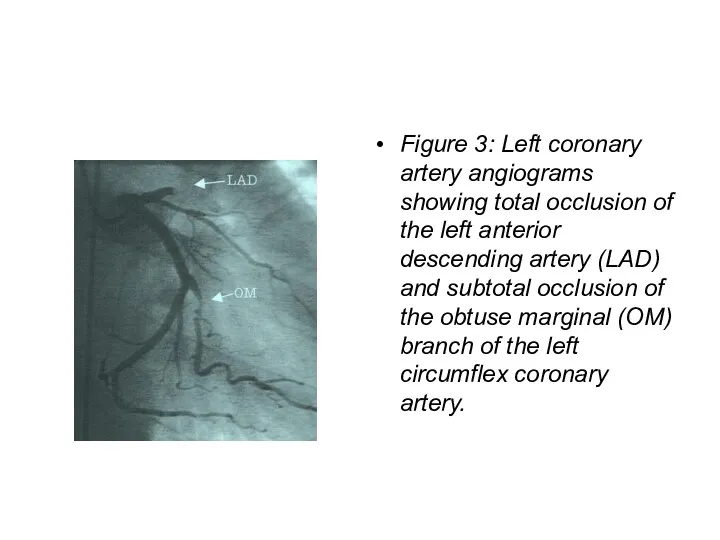
Figure 3: Left coronary artery angiograms showing total occlusion of the
Figure 3: Left coronary artery angiograms showing total occlusion of the
DISCUSSION
Exercise stress testing has traditionally served as a noninvasive tool in
DISCUSSION
Exercise stress testing has traditionally served as a noninvasive tool in
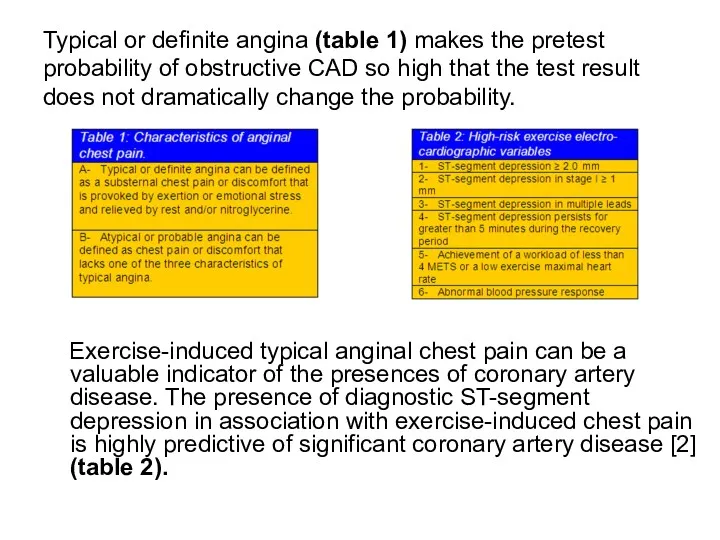
Typical or definite angina (table 1) makes the pretest probability of
Typical or definite angina (table 1) makes the pretest probability of
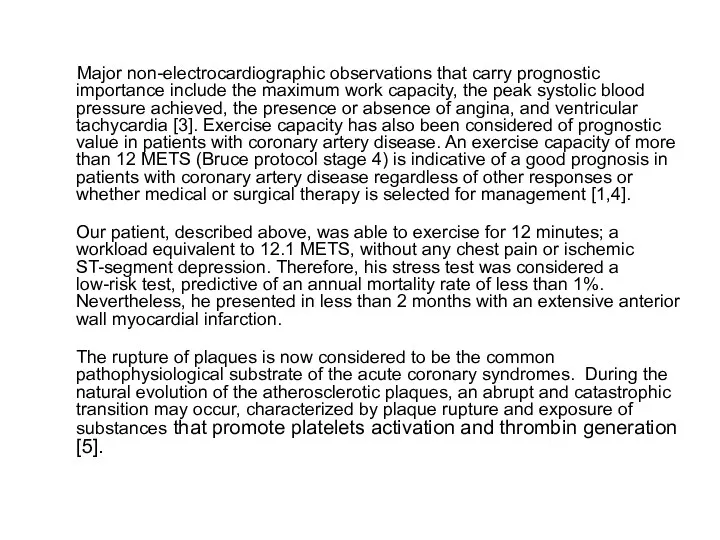
Major non-electrocardiographic observations that carry prognostic importance include the maximum
Major non-electrocardiographic observations that carry prognostic importance include the maximum
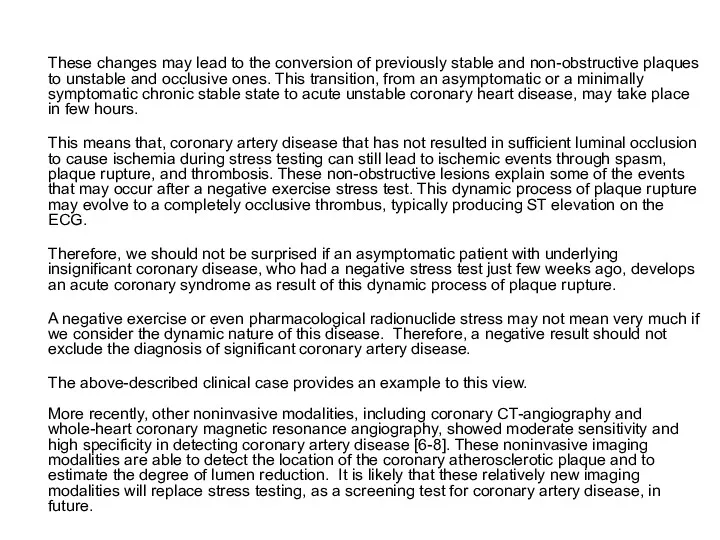
These changes may lead to the conversion of previously stable and
These changes may lead to the conversion of previously stable and
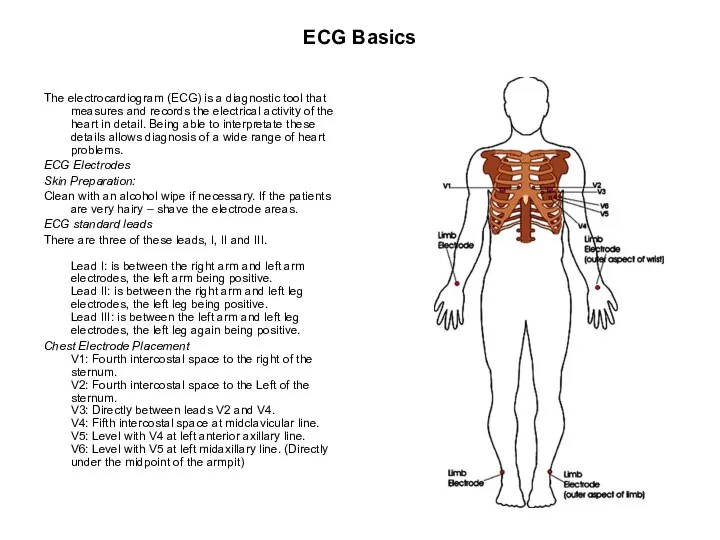
ECG Basics
The electrocardiogram (ECG) is a diagnostic tool that measures and
ECG Basics
The electrocardiogram (ECG) is a diagnostic tool that measures and
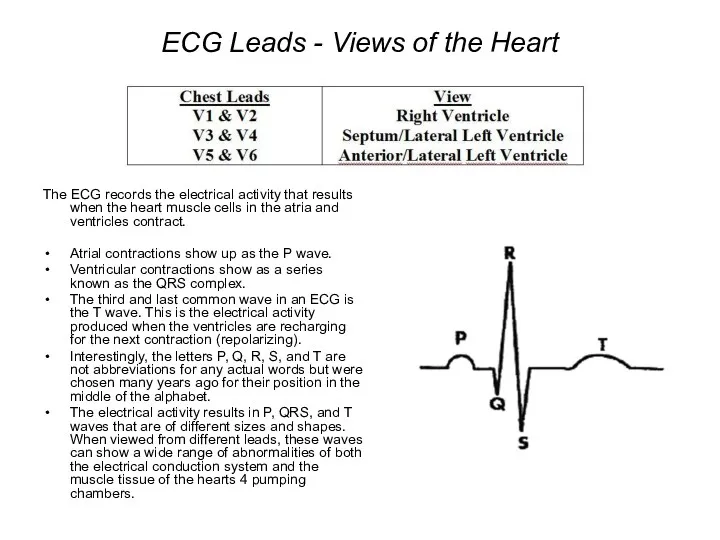
ECG Leads - Views of the Heart
The ECG records the electrical
ECG Leads - Views of the Heart
The ECG records the electrical
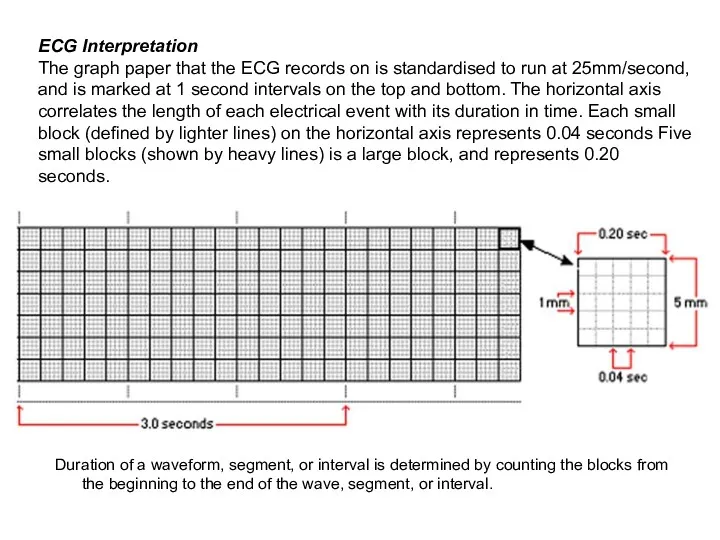
Duration of a waveform, segment, or interval is determined by counting
Duration of a waveform, segment, or interval is determined by counting
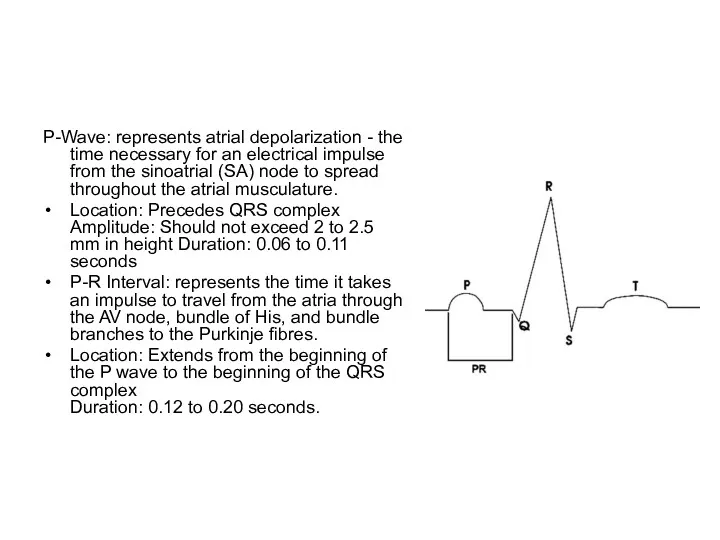
P-Wave: represents atrial depolarization - the time necessary for an electrical
P-Wave: represents atrial depolarization - the time necessary for an electrical
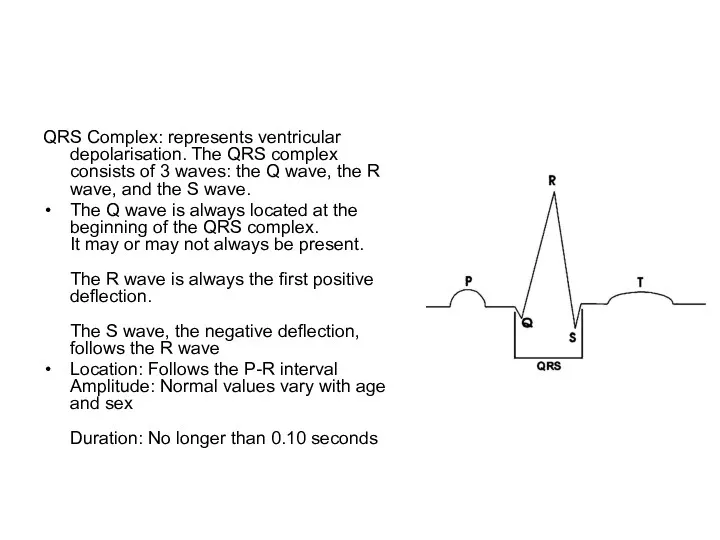
QRS Complex: represents ventricular depolarisation. The QRS complex consists of 3
QRS Complex: represents ventricular depolarisation. The QRS complex consists of 3
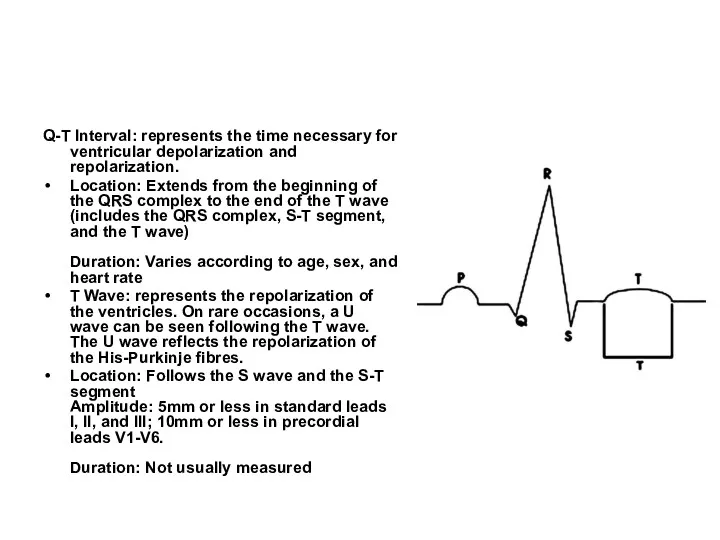
Q-T Interval: represents the time necessary for ventricular depolarization and repolarization.
Location:
Q-T Interval: represents the time necessary for ventricular depolarization and repolarization.
Location:
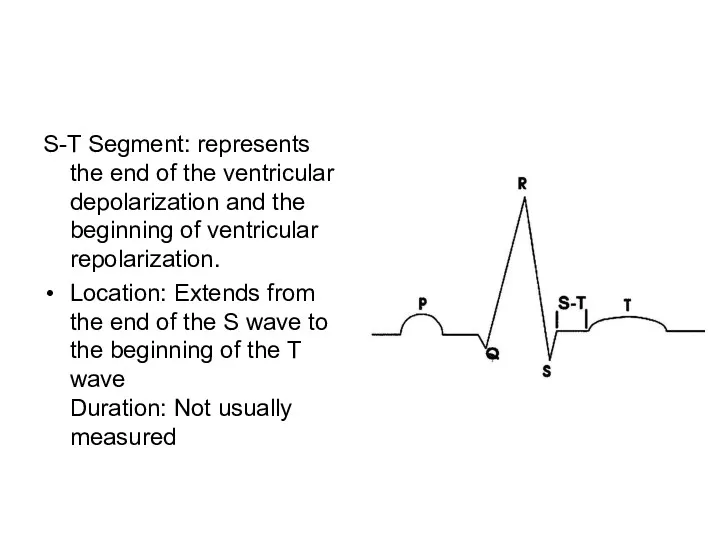
S-T Segment: represents the end of the ventricular depolarization and the
S-T Segment: represents the end of the ventricular depolarization and the
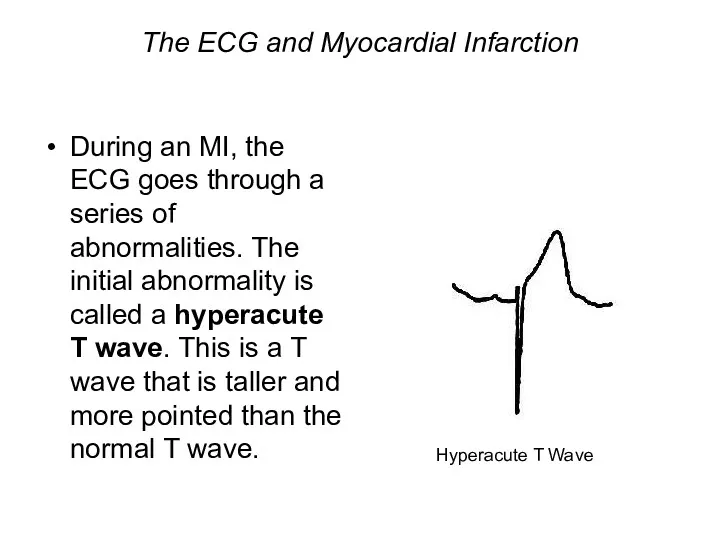
The ECG and Myocardial Infarction
During an MI, the ECG goes through
The ECG and Myocardial Infarction
During an MI, the ECG goes through
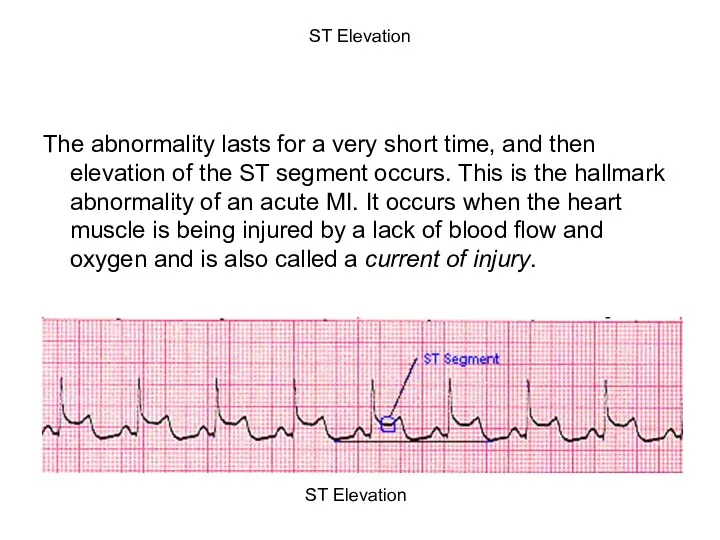
ST Elevation
The abnormality lasts for a very short time, and then
ST Elevation
The abnormality lasts for a very short time, and then
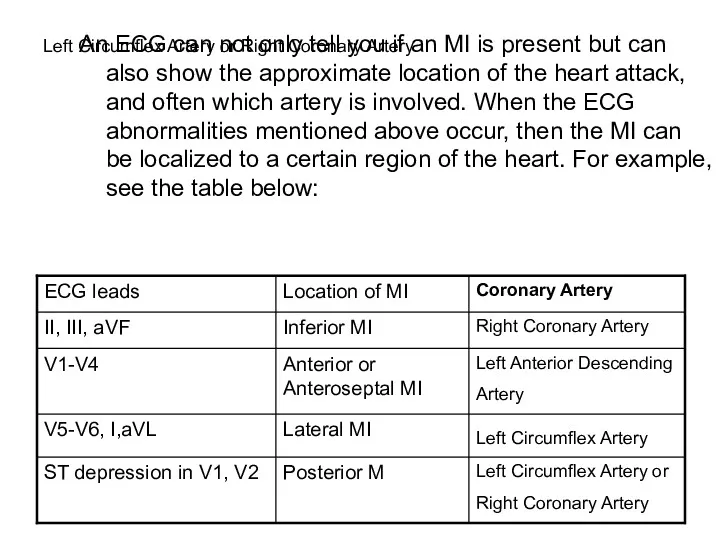
Left Circumflex Artery or Right Coronary Artery
An ECG can not
Left Circumflex Artery or Right Coronary Artery
An ECG can not
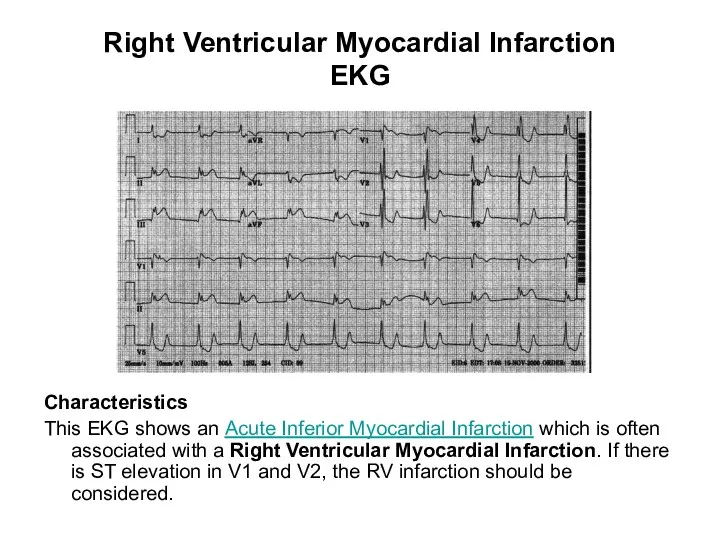
Right Ventricular Myocardial Infarction
EKG
Characteristics
This EKG shows an Acute Inferior Myocardial
Right Ventricular Myocardial Infarction
EKG
Characteristics
This EKG shows an Acute Inferior Myocardial
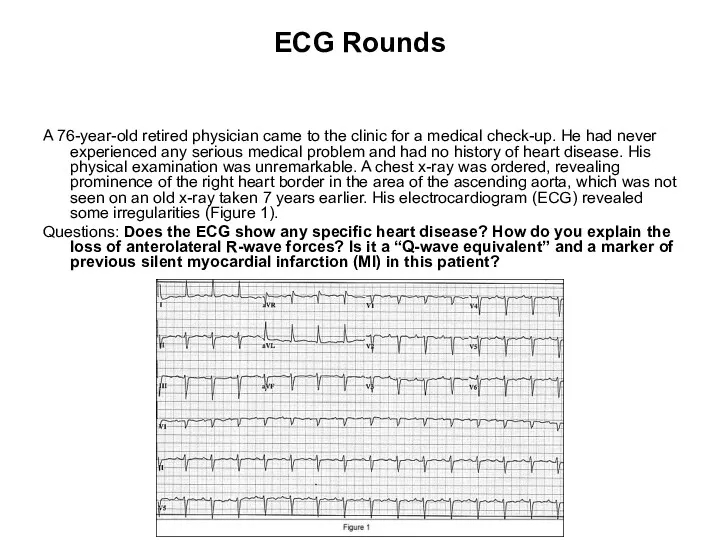
ECG Rounds
A 76-year-old retired physician came to the clinic for a
ECG Rounds
A 76-year-old retired physician came to the clinic for a
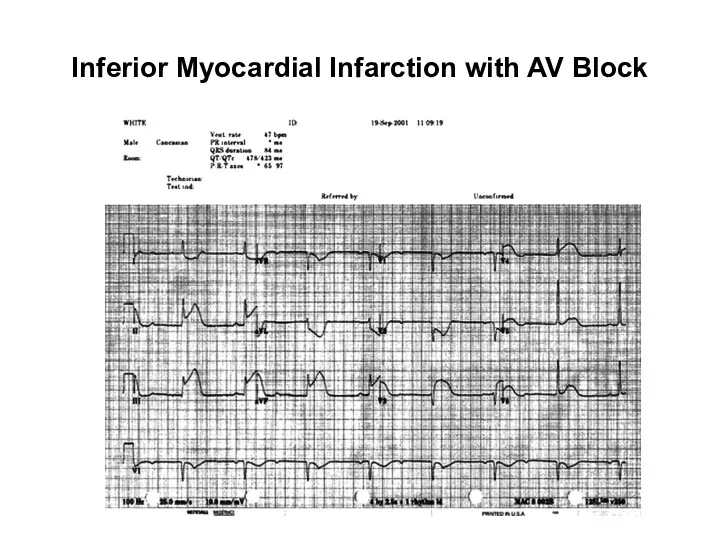
Inferior Myocardial Infarction with AV Block
Inferior Myocardial Infarction with AV Block
Characteristics
Both bradyarrhythmias and conduction disturbances can be seen with myocardial infarctions
Characteristics
Both bradyarrhythmias and conduction disturbances can be seen with myocardial infarctions
The ECG in acute myocardial infarction (MI)
Acute MI may cause
The ECG in acute myocardial infarction (MI)
Acute MI may cause
Abnormal Q waves and QS complexes
In a transmural infarction (endocardium
Abnormal Q waves and QS complexes In a transmural infarction (endocardium
Abnormal Q waves
Q waves may be recognised to be abnormal
Abnormal Q waves Q waves may be recognised to be abnormal
Sequence of changes in acute MI
A) Shows the normal QRS
Sequence of changes in acute MI
A) Shows the normal QRS
Location of changes in MI
Because primary ECG changes occur in leads
Location of changes in MI
Because primary ECG changes occur in leads
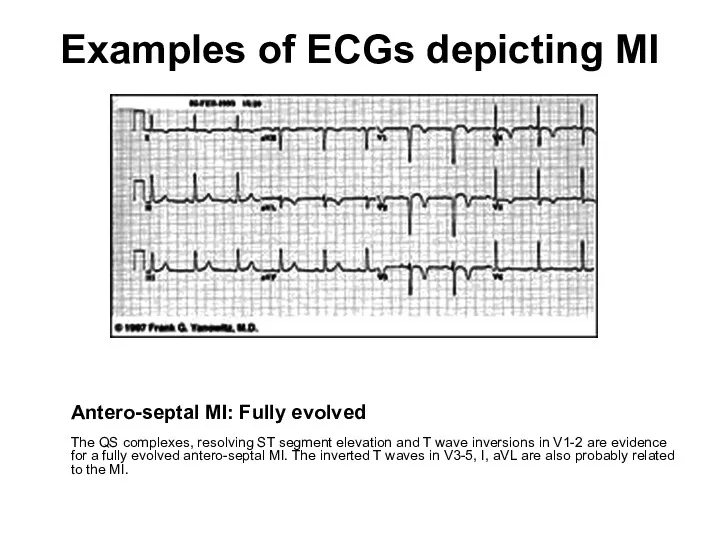
Examples of ECGs depicting MI
Antero-septal MI: Fully evolved
The QS complexes,
Examples of ECGs depicting MI
Antero-septal MI: Fully evolved The QS complexes,
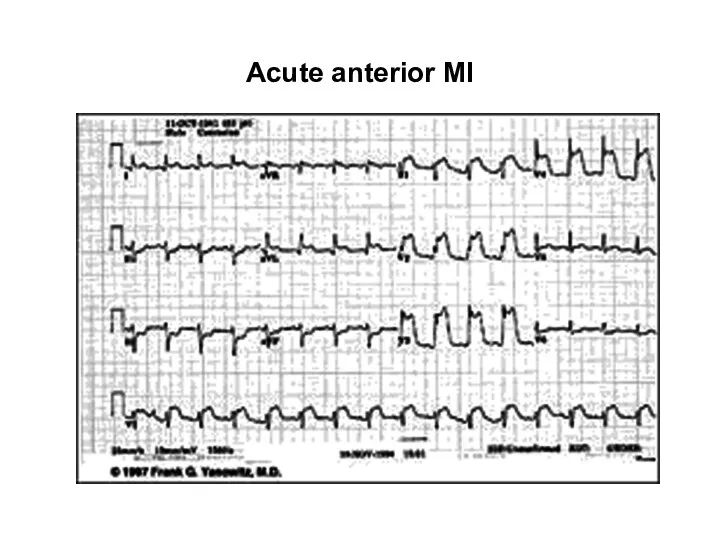
Acute anterior MI
Acute anterior MI
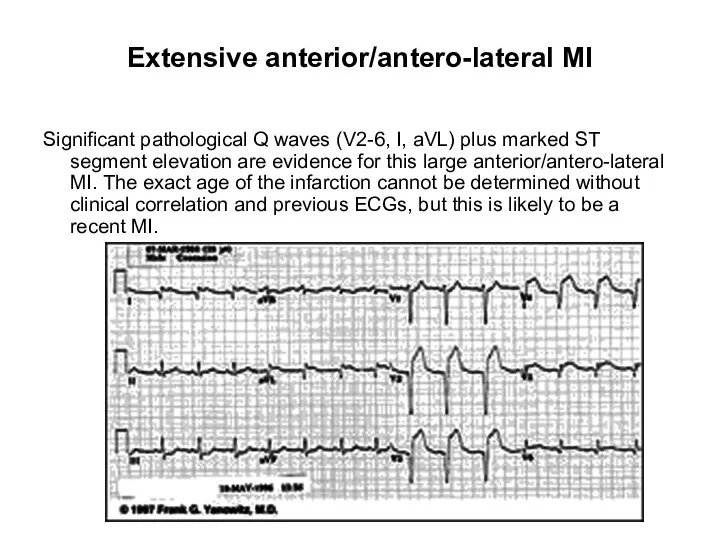
Extensive anterior/antero-lateral MI
Significant pathological Q waves (V2-6, I, aVL) plus
Extensive anterior/antero-lateral MI
Significant pathological Q waves (V2-6, I, aVL) plus
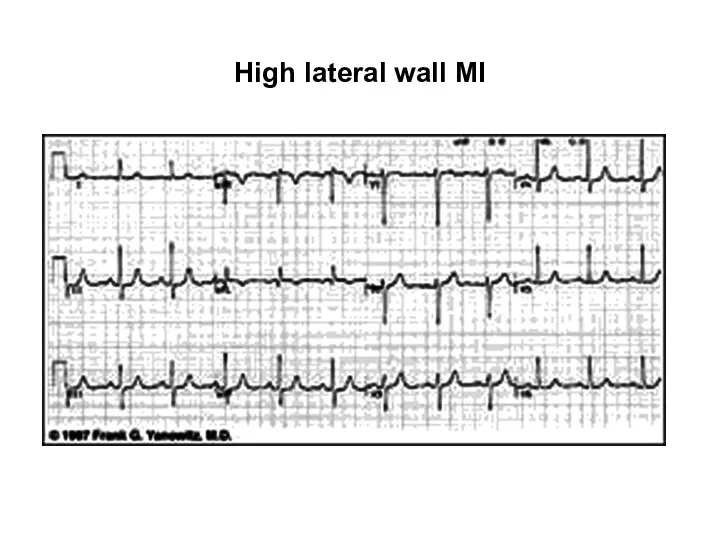
High lateral wall MI
High lateral wall MI
Inferior MI: Fully evolved
Significant pathological Q waves are seen in
Inferior MI: Fully evolved
Significant pathological Q waves are seen in
Inferior & antero-septal MI + RBBB
Pathological Q waves are seen in
Inferior & antero-septal MI + RBBB
Pathological Q waves are seen in
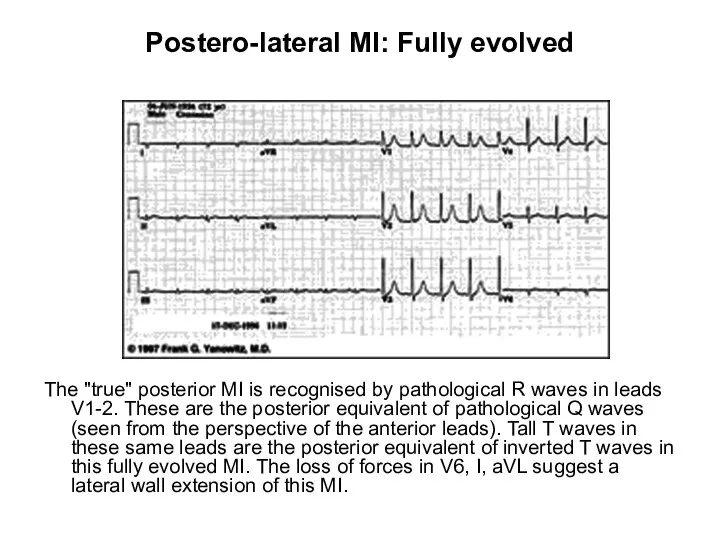
Postero-lateral MI: Fully evolved
The "true" posterior MI is recognised by pathological
Postero-lateral MI: Fully evolved
The "true" posterior MI is recognised by pathological
Infero-posterior MI with RBBB
This is an unusual RBBB because the
Infero-posterior MI with RBBB
This is an unusual RBBB because the
Diagnostic criteria for MI
A definitive diagnosis of MI from the ECG
Diagnostic criteria for MI
A definitive diagnosis of MI from the ECG
Reciprocal changes
In addition to the primary changes that occur in the
Reciprocal changes
In addition to the primary changes that occur in the
True posterior MI
Infarction evident in the inferior leads (II, III and
True posterior MI
Infarction evident in the inferior leads (II, III and
Subendocardial infarction
Infarcts are most commonly intramural infarcts (transmural or subepicardial). Subendocardial
Subendocardial infarction
Infarcts are most commonly intramural infarcts (transmural or subepicardial). Subendocardial
 ЖИТС және жүктілік
 Амбулаторлы жағдайда жаңа туылған нәрестелерге емдік-профилактикалық шараларды ұйымдастыру
 Геморрагический синдром. Острый лейкоз
 Энтеробактерии. Классификация
 Физиология выделения
 Клиническая анатомия лицевого нерва. Топическая диагностика периферических поражений лицевого нерва
 Спинной мозг. Проводящие пути
 Как бросить курить. Тест на выраженность никотиновой зависимости. Фармакологические препараты, облегчающие отказ от курения
 Лихорадка, уход за лихорадящими пациентами.Температура тела и ее измерение
 Иммунология и иммунитет
 Нарушения кровообращения
 Возбудители туберкулеза, микобактериозов, лепры
 Доброкачественные и злокачественные опухоли почек
 Принципы терапии острой почечной недостаточности. Патогенетические сдвиги, клиническая картина
 Возбудители микозов
 Хроническая надпочечниковая недостаточность
 Методы лучевой диагностики. (Лекция 1)
 Первая медицинская помощь на занятиях физической культуры
 Рак полового члена
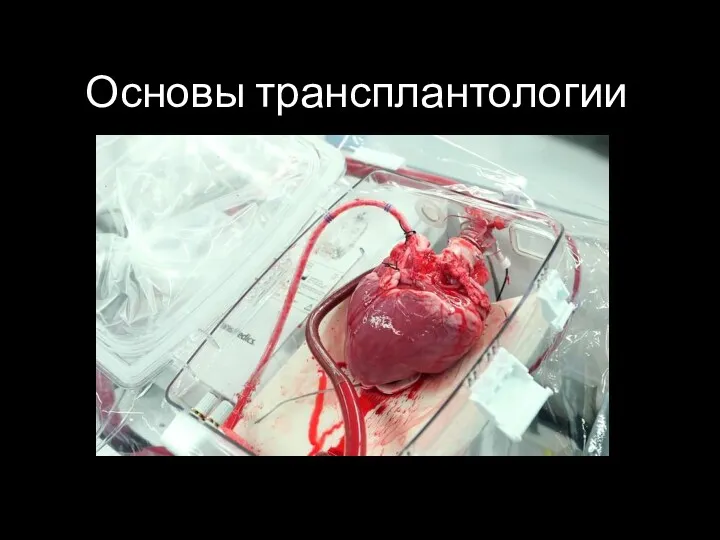 Основы трансплантологии
 Микробиологическая диагностика брюшного тифа, паратифов и сальмонеллёзных гастроэнтеритов
 Дезинфекция. Методы дезинфекции
 Саркома Юинга
 Жамбас – сан буынының туберкулезінің дифференциальды диагностикасы
 Проводящая система сердца
 Влияние быстрой еды на организм человека
 Философия сестринского дела
 Акушерство для линейных бригад скорой помощи