- Pharmacokinetics of drug absorption

Содержание
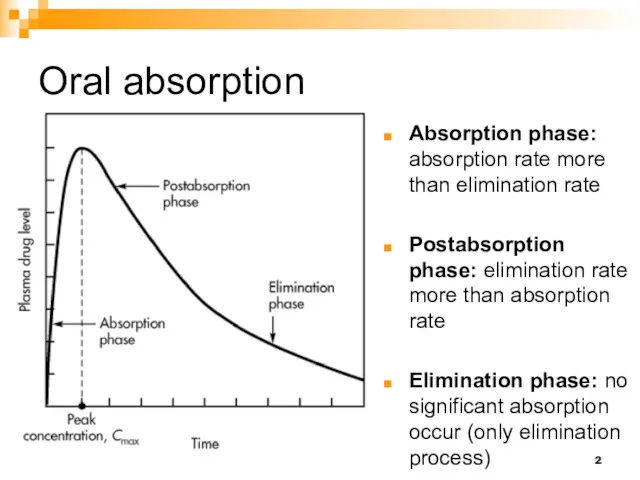
- 2. Oral absorption Absorption phase: absorption rate more than elimination rate Postabsorption phase: elimination rate more than
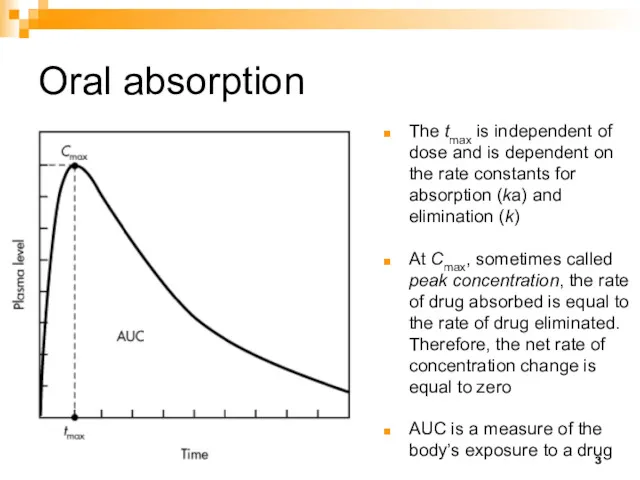
- 3. Oral absorption The tmax is independent of dose and is dependent on the rate constants for
- 4. One-compartment pharmacokinetic model for first-order drug absorption and first-order drug elimination Drug in the body (X)
- 5. Mathematical model Assuming first-order absorption and first-order elimination, the amount of drug (X) in the body
- 6. Determination of the Model Parameters K Elimination half life Ka Absorption half life tmax and Cmax
- 7. Oral absorption This portion measure the elimination process This portion measure the absorption process
- 8. Terminal phase (elimination) Because in the Elimination phase no significant absorption occur (only elimination process), the
- 9. method of residuals The method of residuals is a graphical method used to determine the drug
- 10. method of residuals The plasma drug concentration is plotted against their corresponding time values on the
- 11. Method of residuals The values of the residuals are plotted versus their corresponding time values for
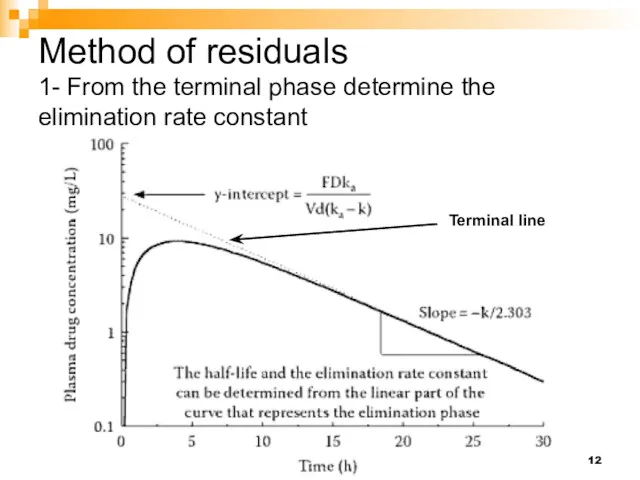
- 12. Method of residuals 1- From the terminal phase determine the elimination rate constant Terminal line
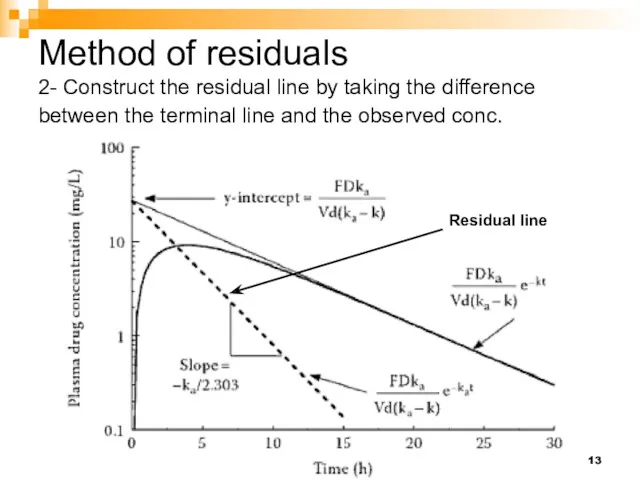
- 13. Method of residuals 2- Construct the residual line by taking the difference between the terminal line
- 14. Method of residuals 3- Estimate the absorption rate constant from the slope of the residual line
- 15. Determination of the Model Parameters Elimination half life = 0.693/K Absorption half life = 0.693/Ka tmax
- 16. Determination of the Model Parameters Clearance Volume of distribution AUC
- 17. Normal kinetics vs. Flip-flop kinetics In a series of two consecutive, irreversible first-order rate processes such
- 18. Normal kinetics vs. Flip-flop kinetics When ka is much smaller than k (e.g., k > ka
- 19. Distinguishing between Normal and Flip-Flop kinetics IV bolus data is needed to differentiate between Normal and
- 20. Normal Kinetics example Theophylline conc-time profile resulting from the administration of two 130 mg tablets: Dissolved
- 21. Flip-Flop kinetics example Penicillin G was adminstgered IM as an: Aqueous solution (I.M) Procaine penicillin in
- 22. Effect of Ka on tmax, Cmax, and AUC Increasing the absorption rate constant (Ka) results in:
- 23. Effect of K on tmax, Cmax, and AUC Increasing the elimination rate constant (K) results in:
- 24. Effect F on tmax, Cmax, and AUC F = 1 F = 0.5 F = 0.25
- 25. Bioavailability Systemic absorption is often incomplete when given extravascularly Knowing the extent of absorption (bioavailability) helps
- 26. Bioavailability To determine clearance, a drug must be given intravascularly, as only then is the amount
- 27. Bioavailability If the IV and oral doses were equal, F can be calculated according to:
- 28. Example 1 A 500-mg dose of the sulfonamide sulfamethoxazole is administered as an oral tablet to
- 29. Example 1 Estimate k and ka: Estimate AUC:
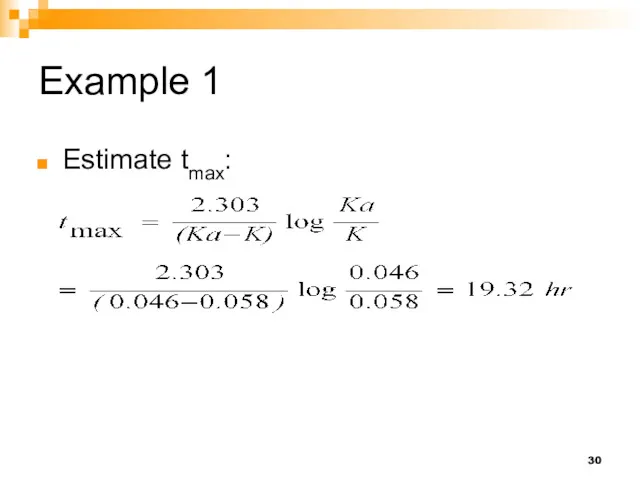
- 30. Example 1 Estimate tmax:
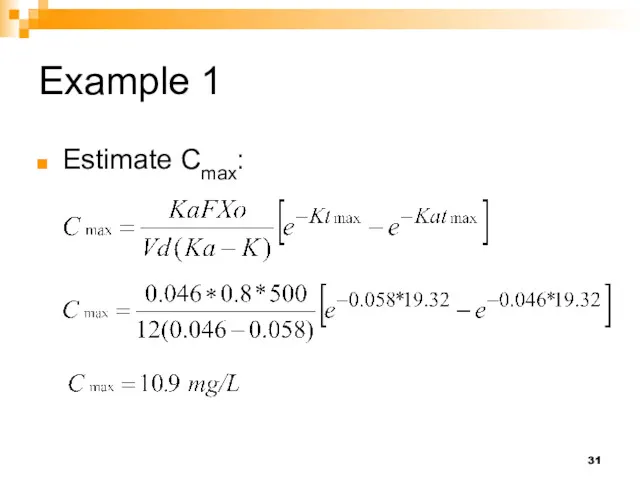
- 31. Example 1 Estimate Cmax:
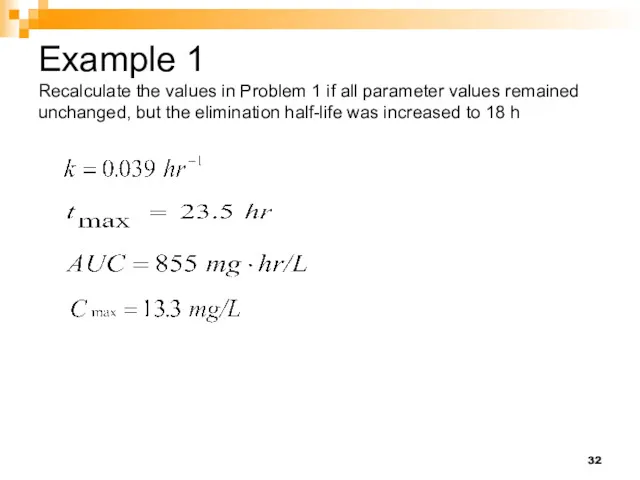
- 32. Example 1 Recalculate the values in Problem 1 if all parameter values remained unchanged, but the
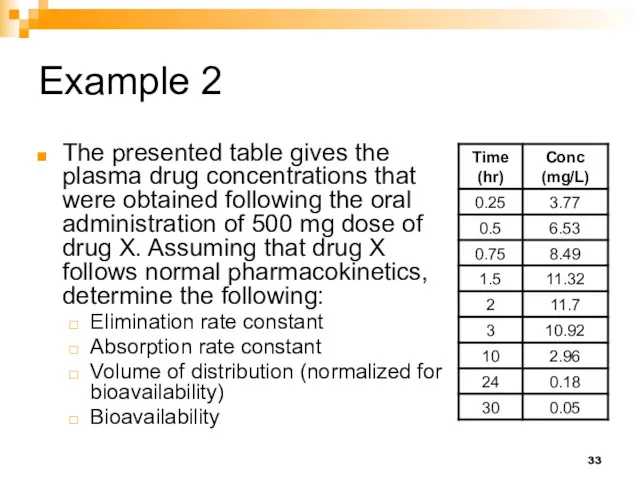
- 33. Example 2 The presented table gives the plasma drug concentrations that were obtained following the oral
- 34. Example 2: Determine elimination phase Elimination phase
- 35. Example 2: Determine K Terminal line equation: K =-slope*2.303 =0.0883*2.303 K= 0.2 hr-1
- 36. Example 2: Extrapolate the terminal line to cross the y-axis
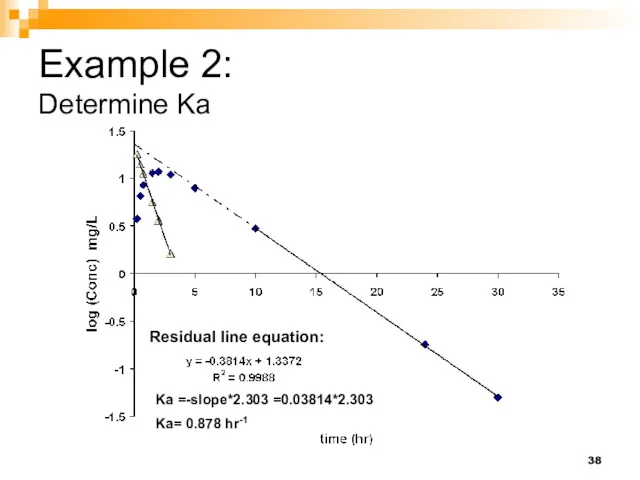
- 37. Example 2: Draw the residual line
- 38. Example 2: Determine Ka Residual line equation: Ka =-slope*2.303 =0.03814*2.303 Ka= 0.878 hr-1
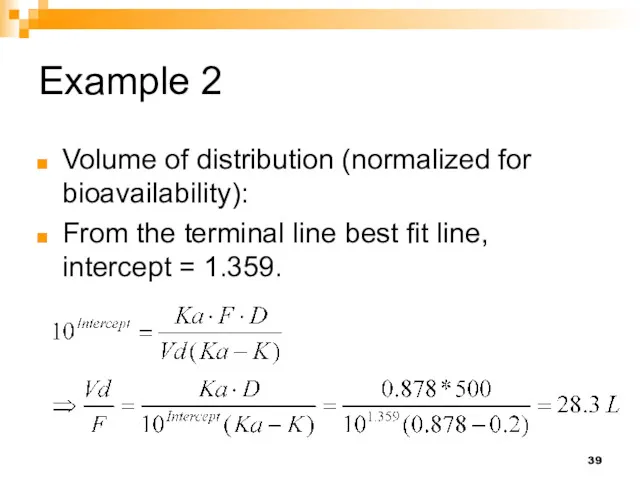
- 39. Example 2 Volume of distribution (normalized for bioavailability): From the terminal line best fit line, intercept
- 40. Example 3 A patient received a single dose of 500 mg erythromycin in the form of
- 42. Скачать презентацию
Oral absorption
Absorption phase: absorption rate more than elimination rate
Postabsorption phase: elimination
Oral absorption
Absorption phase: absorption rate more than elimination rate
Postabsorption phase: elimination
Oral absorption
The tmax is independent of dose and is dependent on
Oral absorption
The tmax is independent of dose and is dependent on
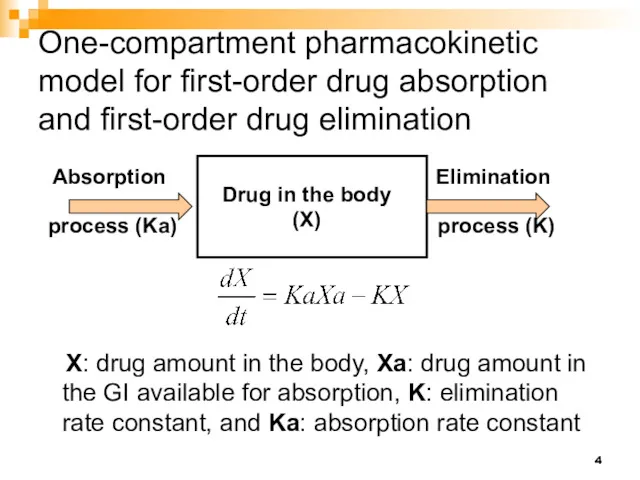
One-compartment pharmacokinetic model for first-order drug absorption and first-order drug elimination
One-compartment pharmacokinetic model for first-order drug absorption and first-order drug elimination
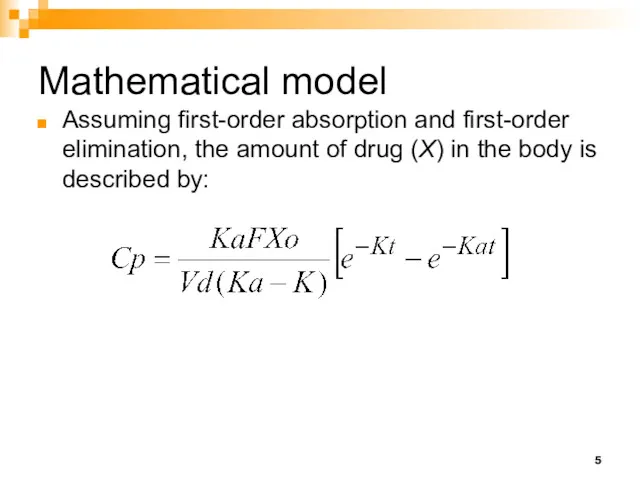
Mathematical model
Assuming first-order absorption and first-order elimination, the amount of drug
Mathematical model
Assuming first-order absorption and first-order elimination, the amount of drug
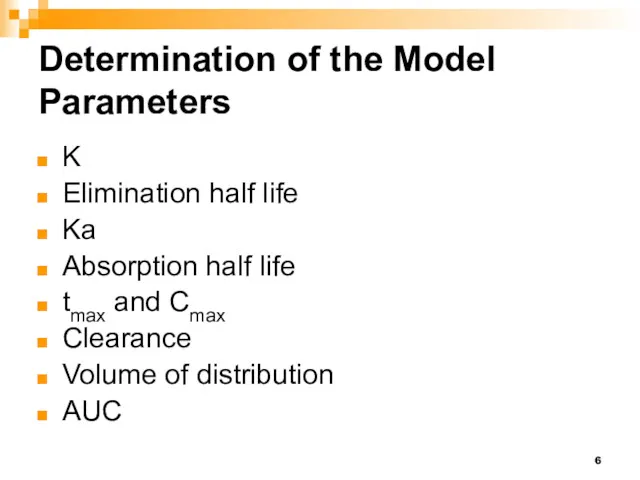
Determination of the Model Parameters
K
Elimination half life
Ka
Absorption half life
tmax and Cmax
Clearance
Volume
Determination of the Model Parameters
K
Elimination half life
Ka
Absorption half life
tmax and Cmax
Clearance
Volume
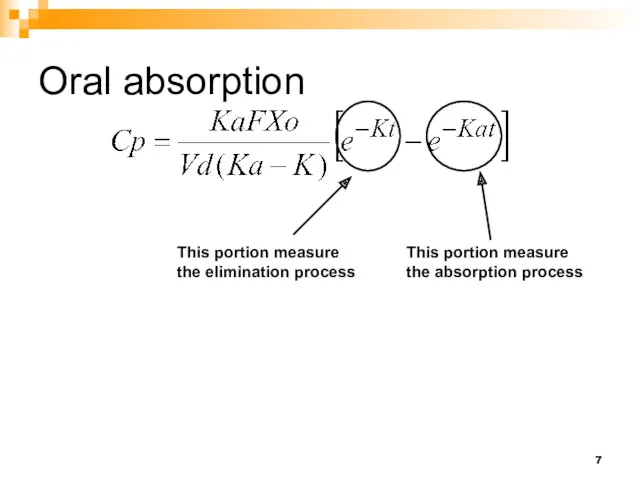
Oral absorption
This portion measure the elimination process
This portion measure the absorption
Oral absorption
This portion measure the elimination process
This portion measure the absorption
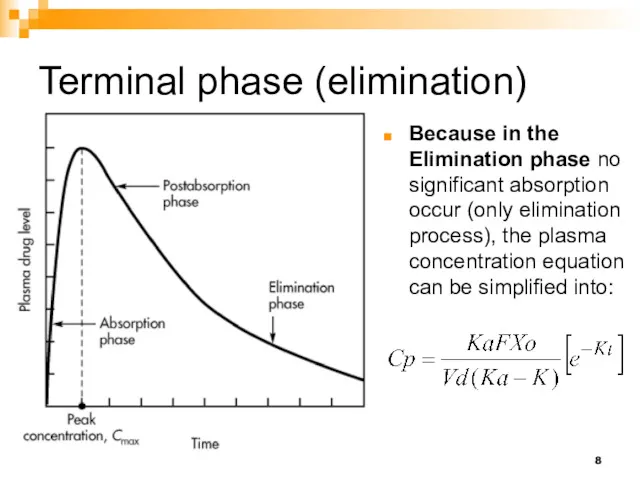
Terminal phase (elimination)
Because in the Elimination phase no significant absorption occur
Terminal phase (elimination)
Because in the Elimination phase no significant absorption occur
method of residuals
The method of residuals is a graphical method used
method of residuals
The method of residuals is a graphical method used
method of residuals
The plasma drug concentration is plotted against their corresponding
method of residuals
The plasma drug concentration is plotted against their corresponding
Method of residuals
The values of the residuals are plotted versus their
Method of residuals
The values of the residuals are plotted versus their
Method of residuals
1- From the terminal phase determine the elimination
Method of residuals 1- From the terminal phase determine the elimination
Method of residuals
2- Construct the residual line by taking the
Method of residuals 2- Construct the residual line by taking the
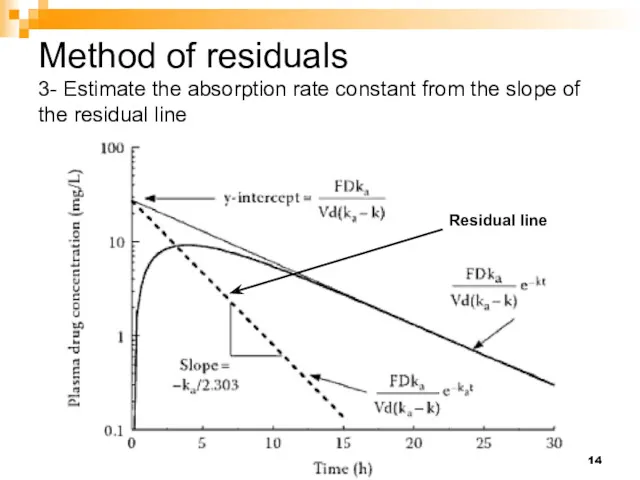
Method of residuals
3- Estimate the absorption rate constant from the
Method of residuals 3- Estimate the absorption rate constant from the
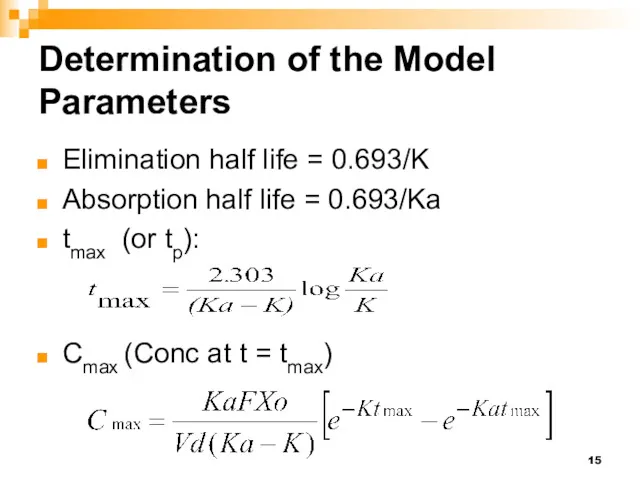
Determination of the Model Parameters
Elimination half life = 0.693/K
Absorption half life
Determination of the Model Parameters
Elimination half life = 0.693/K
Absorption half life
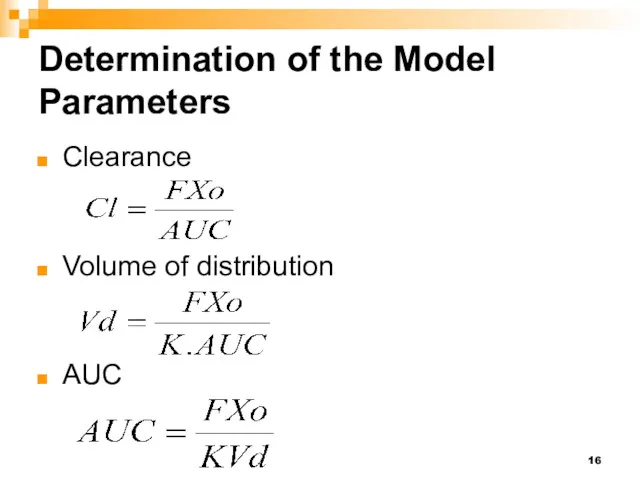
Determination of the Model Parameters
Clearance
Volume of distribution
AUC
Determination of the Model Parameters
Clearance
Volume of distribution
AUC
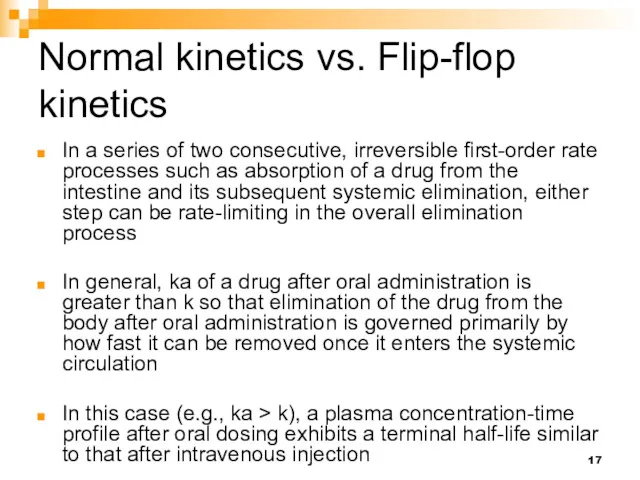
Normal kinetics vs. Flip-flop kinetics
In a series of two consecutive, irreversible
Normal kinetics vs. Flip-flop kinetics
In a series of two consecutive, irreversible
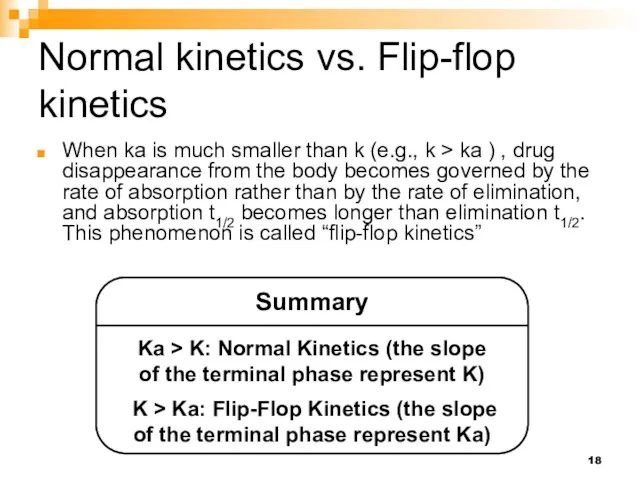
Normal kinetics vs. Flip-flop kinetics
When ka is much smaller than k
Normal kinetics vs. Flip-flop kinetics
When ka is much smaller than k
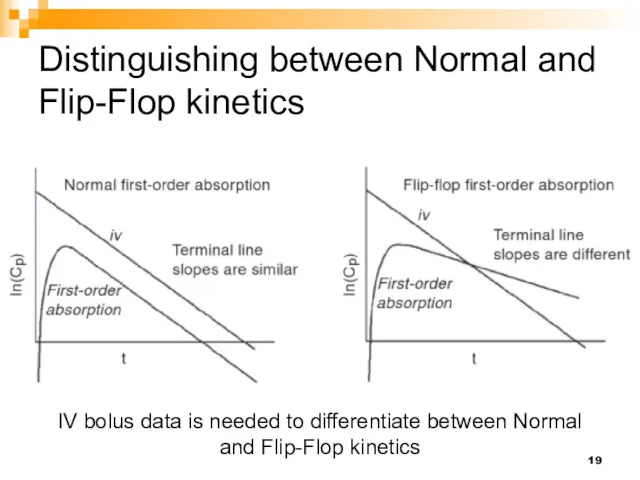
Distinguishing between Normal and Flip-Flop kinetics
IV bolus data is needed to
Distinguishing between Normal and Flip-Flop kinetics
IV bolus data is needed to
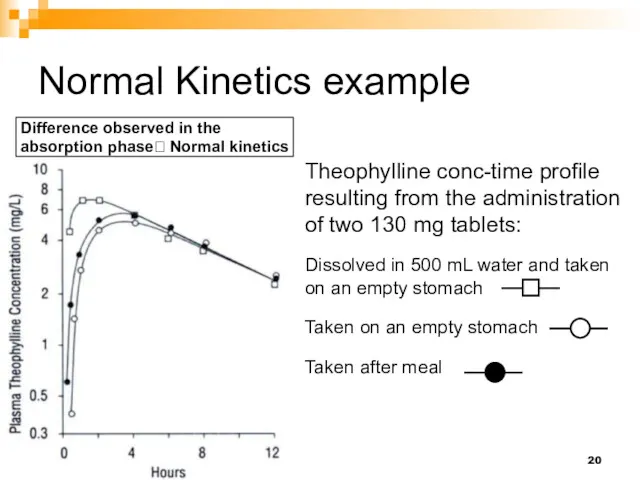
Normal Kinetics example
Theophylline conc-time profile resulting from the administration of two
Normal Kinetics example
Theophylline conc-time profile resulting from the administration of two
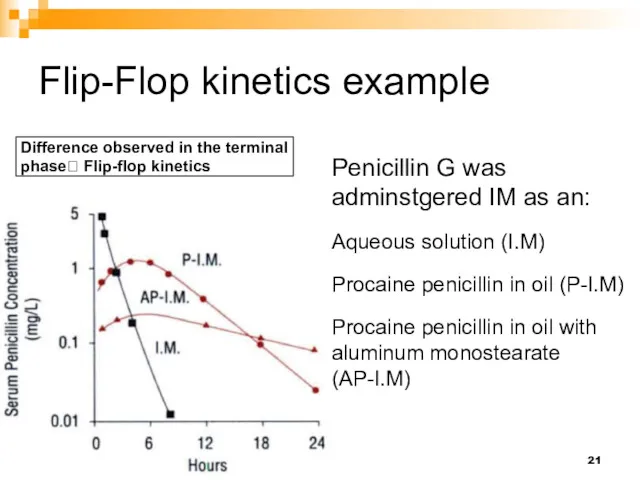
Flip-Flop kinetics example
Penicillin G was adminstgered IM as an:
Aqueous solution (I.M)
Procaine
Flip-Flop kinetics example
Penicillin G was adminstgered IM as an:
Aqueous solution (I.M)
Procaine
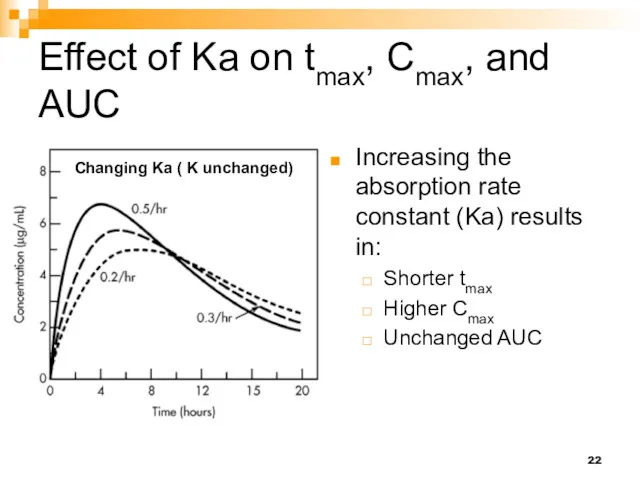
Effect of Ka on tmax, Cmax, and AUC
Increasing the absorption rate
Effect of Ka on tmax, Cmax, and AUC
Increasing the absorption rate
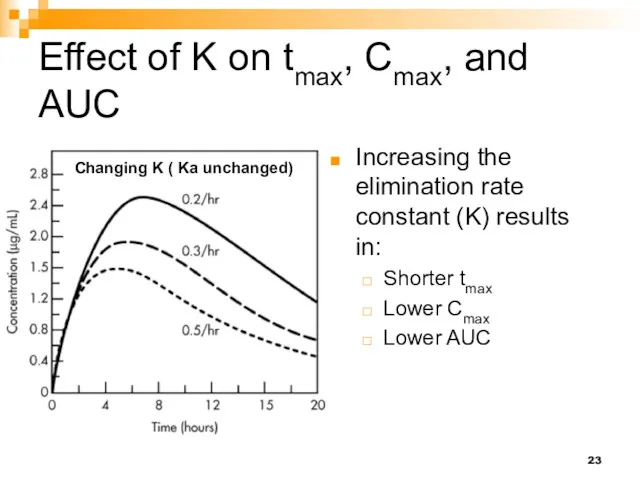
Effect of K on tmax, Cmax, and AUC
Increasing the elimination rate
Effect of K on tmax, Cmax, and AUC
Increasing the elimination rate
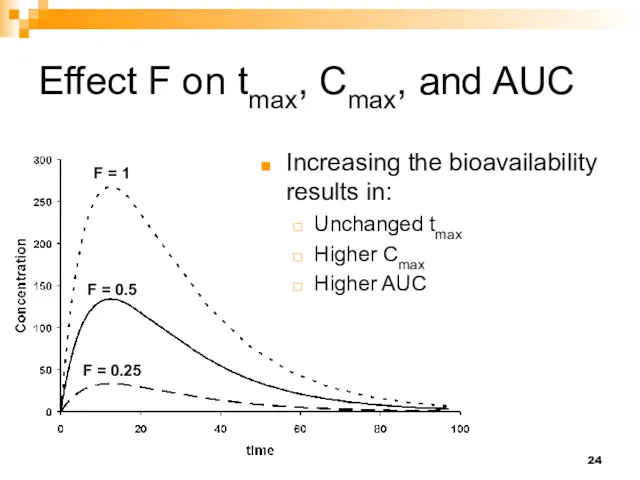
Effect F on tmax, Cmax, and AUC
F = 1
F = 0.5
F
Effect F on tmax, Cmax, and AUC
F = 1
F = 0.5
F
Bioavailability
Systemic absorption is often incomplete when given extravascularly
Knowing the extent of
Bioavailability
Systemic absorption is often incomplete when given extravascularly
Knowing the extent of
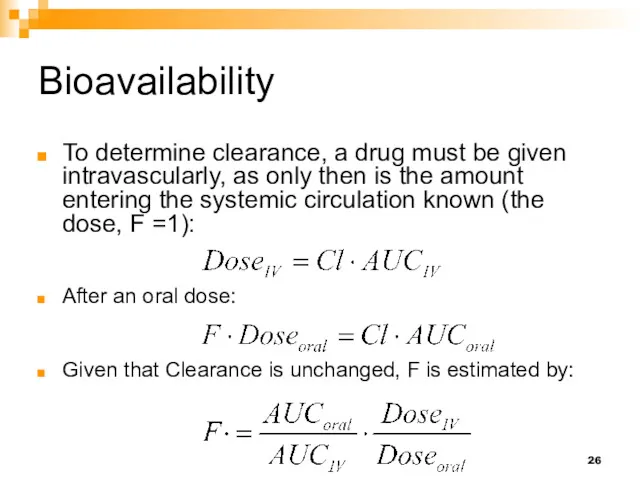
Bioavailability
To determine clearance, a drug must be given intravascularly, as only
Bioavailability
To determine clearance, a drug must be given intravascularly, as only
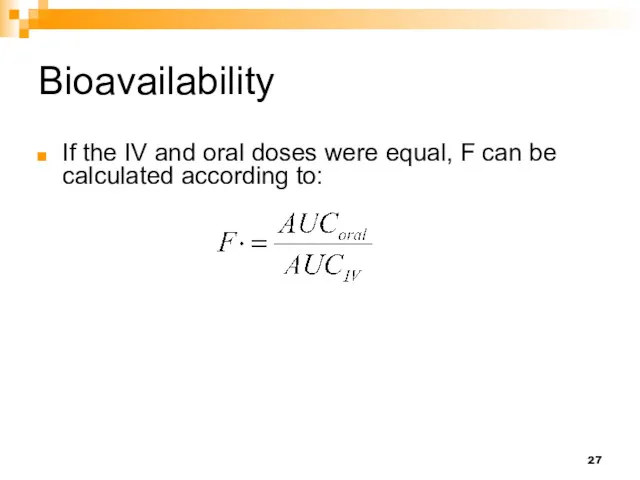
Bioavailability
If the IV and oral doses were equal, F can be
Bioavailability
If the IV and oral doses were equal, F can be
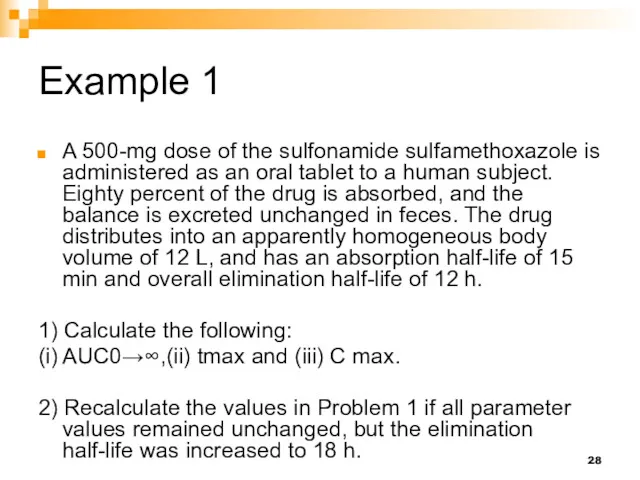
Example 1
A 500-mg dose of the sulfonamide sulfamethoxazole is administered as
Example 1
A 500-mg dose of the sulfonamide sulfamethoxazole is administered as
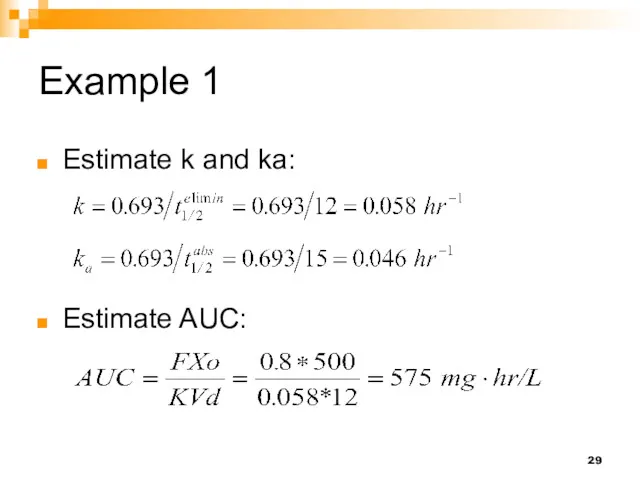
Example 1
Estimate k and ka:
Estimate AUC:
Example 1
Estimate k and ka:
Estimate AUC:
Example 1
Estimate tmax:
Example 1
Estimate tmax:
Example 1
Estimate Cmax:
Example 1
Estimate Cmax:
Example 1
Recalculate the values in Problem 1 if all parameter values
Example 1 Recalculate the values in Problem 1 if all parameter values
Example 2
The presented table gives the plasma drug concentrations that were
Example 2
The presented table gives the plasma drug concentrations that were
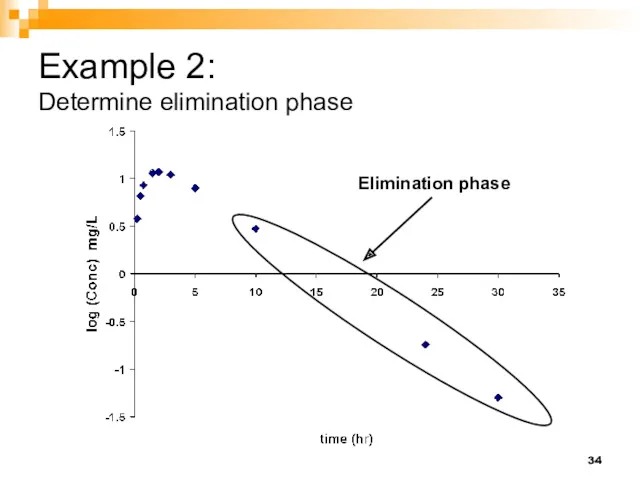
Example 2:
Determine elimination phase
Elimination phase
Example 2:
Determine elimination phase
Elimination phase
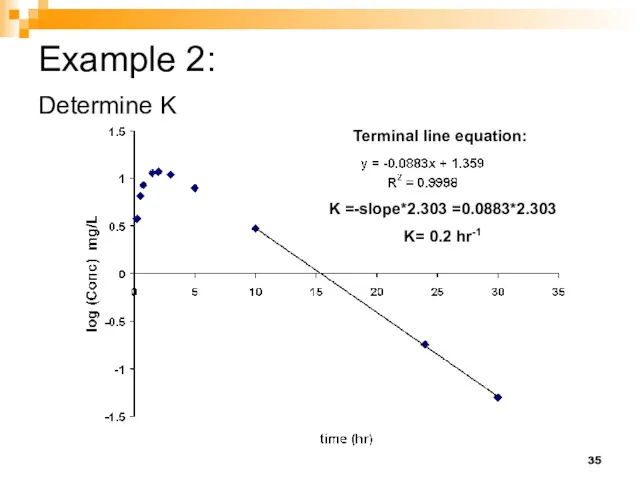
Example 2:
Determine K
Terminal line equation:
K =-slope*2.303 =0.0883*2.303
K= 0.2 hr-1
Example 2:
Determine K
Terminal line equation:
K =-slope*2.303 =0.0883*2.303
K= 0.2 hr-1
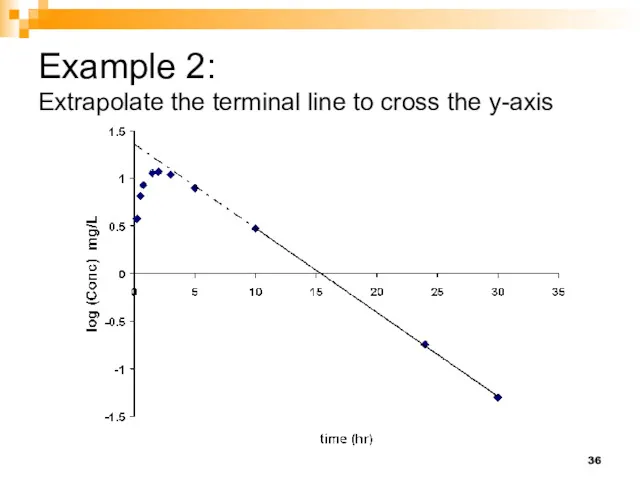
Example 2:
Extrapolate the terminal line to cross the y-axis
Example 2:
Extrapolate the terminal line to cross the y-axis
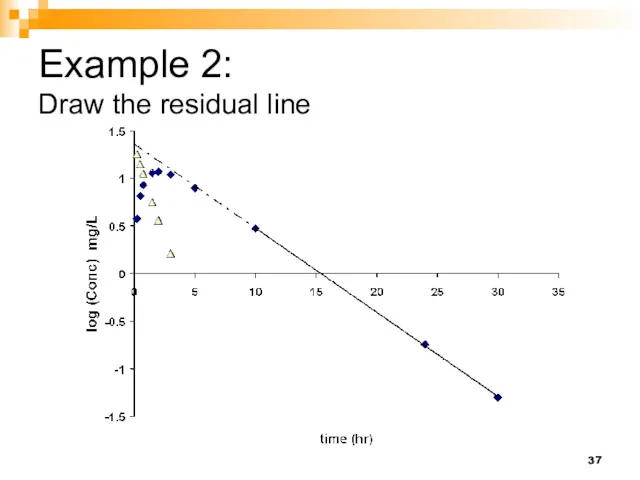
Example 2:
Draw the residual line
Example 2:
Draw the residual line
Example 2:
Determine Ka
Residual line equation:
Ka =-slope*2.303 =0.03814*2.303
Ka= 0.878 hr-1
Example 2:
Determine Ka
Residual line equation:
Ka =-slope*2.303 =0.03814*2.303
Ka= 0.878 hr-1
Example 2
Volume of distribution (normalized for bioavailability):
From the terminal line best
Example 2
Volume of distribution (normalized for bioavailability):
From the terminal line best
Example 3
A patient received a single dose of 500 mg erythromycin
Example 3
A patient received a single dose of 500 mg erythromycin
 Герпесвирусные инфекции у детей: современные аспекты диагностики и лечения
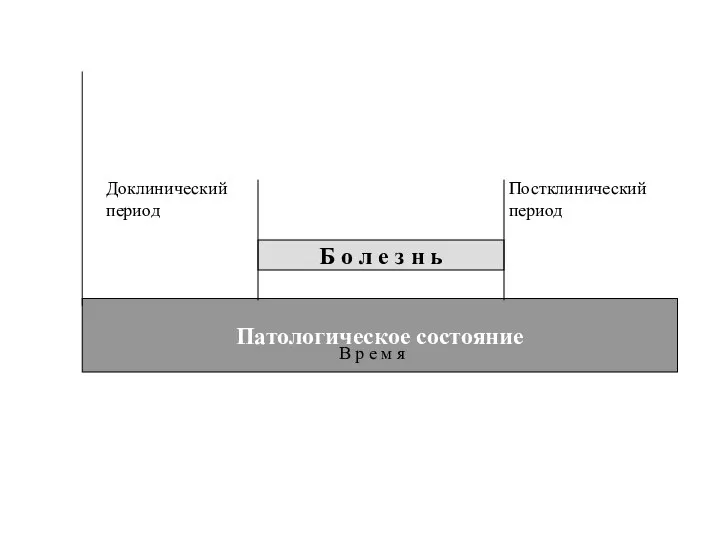 Дистрофия. Морфологическая сущность и морфогенез дистрофий
 Пищевая аддикция
 Патология детей раннего возраста. Рахит
 Хронический гастрит. Язвенная болезнь
 Основы клинической физиологии сердца
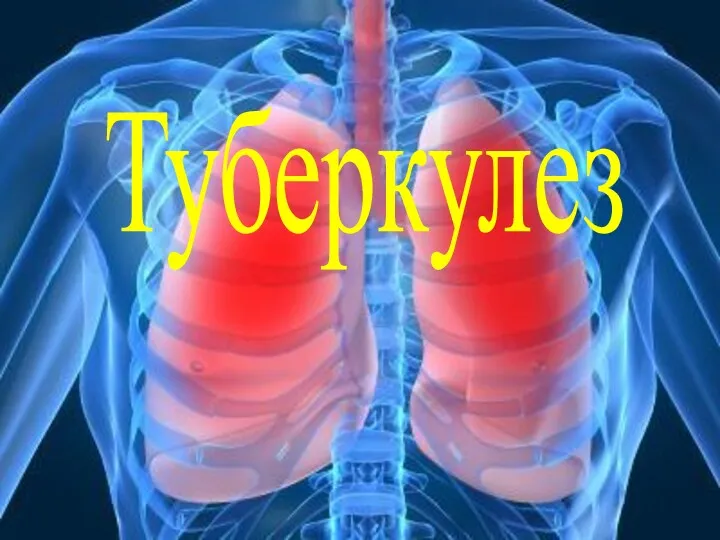 Туберкулез. Туберкулездің алдын алу спецификалық және спецификалық емес түрі
 Рак желудка
 Иммунный статус и его оценка
 Первая медицинская помощь при ДТП
 Наследственные нарушения развития тканей зубов
 Гипноз сегодня. Мифы и реальность
 Подготовка к летней оздоровительной кампании в г. Архангельске в 2018 году
 Особенности кровообращения плода и детей раннего возраста
 Методы патопсихологии
 Амбулатория жағдайында іш қуысының ауырсынуы кезіндегі рационалды дифференциалды диагностика алгоритмі
 Антимикробные химиотерапевтические препараты. Механизмы действия. Осложнения антимикробной терапии
 Политравма. Этиология и эпидемиология политравмы
 Мерез ауруы кезіндегі ауыз қуысының шырышты қабатындағы көріністер
 Нижний этаж брюшной полости
 Біліктік қаңқа. Типті омыртқаның құрылысы
 Острый одонтогенный, гематогенный, хронический остеомиелит
 Клиника, диагностика, дифференциальная диагностика среднего, быстрого и медленно прогрессирующего глубокого кариеса
 Теория по стоматологии. Гигиена. Отбеливание
 Диагностика. Фотографии лица до лечения
 Иммунитет. Термины. Виды иммунитета. ВИЧ и СПИД
 Заболевания надпочечников. Синдром Иценко-Кушинга. Болезнь Аддисона
 Лекарственные средства, влияющие на афферентную нервную систему