- Physiology of the Heart

Содержание
- 2. Plan:
- 3. Functions of the Heart Generating blood pressure Routing blood: separates pulmonary and systemic circulations Ensuring one-way
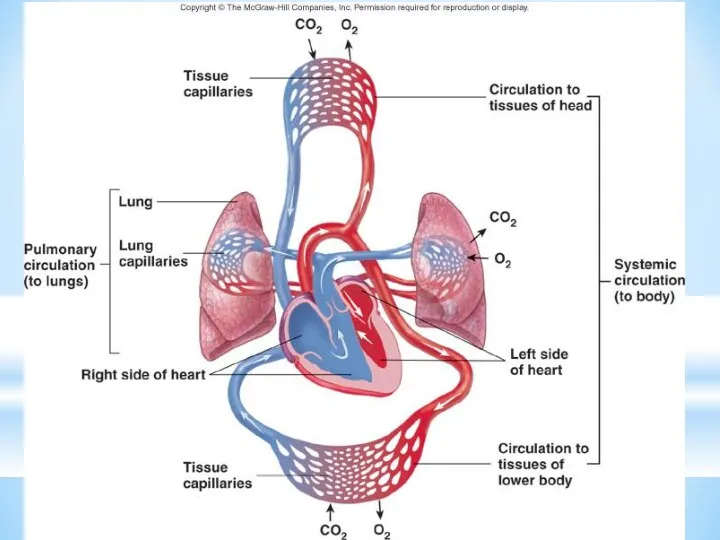
- 4. The cardiovascular system is divided into two circuits Pulmonary circuit blood to and from the lungs
- 6. Cardiac Muscle Elongated, branching cells containing 1-2 centrally located nuclei Contains actin and myosin myofilaments Intercalated
- 7. Heart chambers and valves Structural Differences in heart chambers The left side of the heart is
- 8. Cardiac Muscle Contraction Heart muscle: Is stimulated by nerves and is self-excitable (automaticity) Contracts as a
- 9. Differences Between Skeletal and Cardiac Muscle Physiology Action Potential Cardiac: Action potentials conducted from cell to
- 10. The Action Potential in Skeletal and Cardiac Muscle Figure 20.15
- 11. 1. Rising phase of action potential Due to opening of fast Na+ channels 2. Plateau phase
- 12. Conducting System of Heart
- 13. Conduction System of the Heart SA node: sinoatrial node. The pacemaker. Specialized cardiac muscle cells. Generate
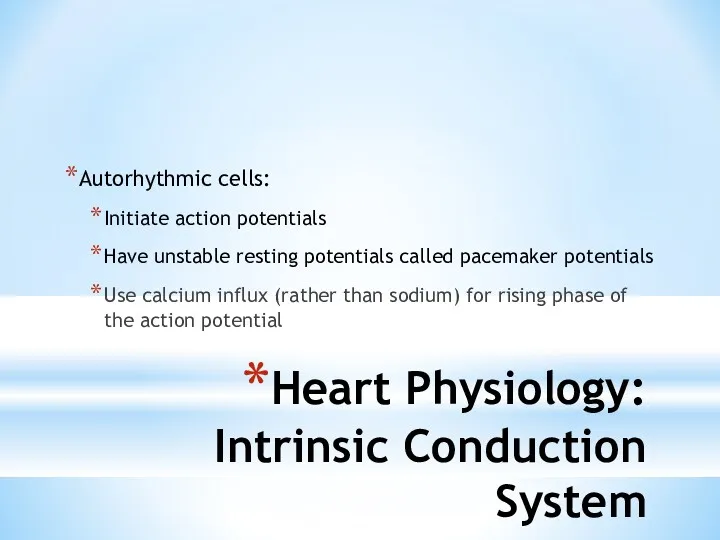
- 14. Heart Physiology: Intrinsic Conduction System Autorhythmic cells: Initiate action potentials Have unstable resting potentials called pacemaker
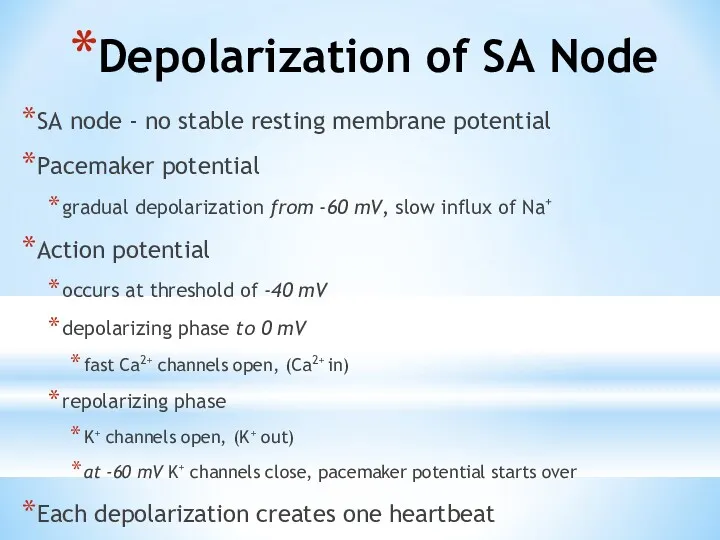
- 15. Depolarization of SA Node SA node - no stable resting membrane potential Pacemaker potential gradual depolarization
- 16. Pacemaker and Action Potentials of the Heart
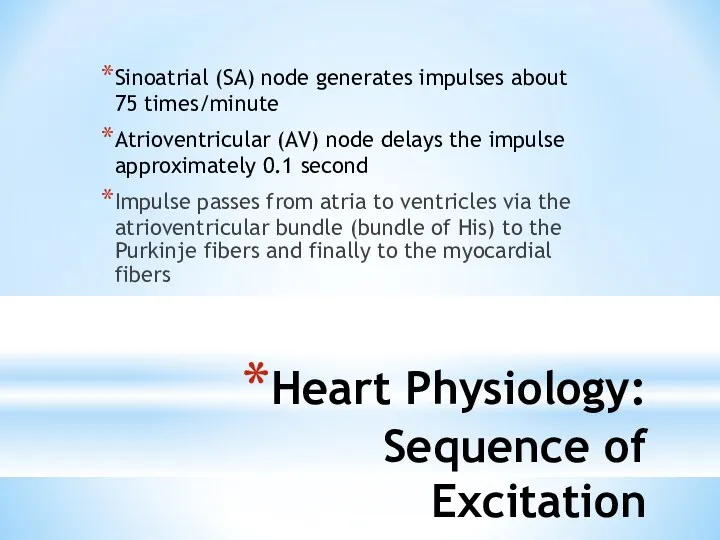
- 17. Heart Physiology: Sequence of Excitation Sinoatrial (SA) node generates impulses about 75 times/minute Atrioventricular (AV) node
- 18. Impulse Conduction through the Heart
- 19. An Electrocardiogram
- 20. Electrocardiogram Record of electrical events in the myocardium that can be correlated with mechanical events P
- 21. ECGs, Normal and Abnormal
- 22. ECGs, Abnormal Extrasystole : note inverted QRS complex, misshapen QRS and T and absence of a
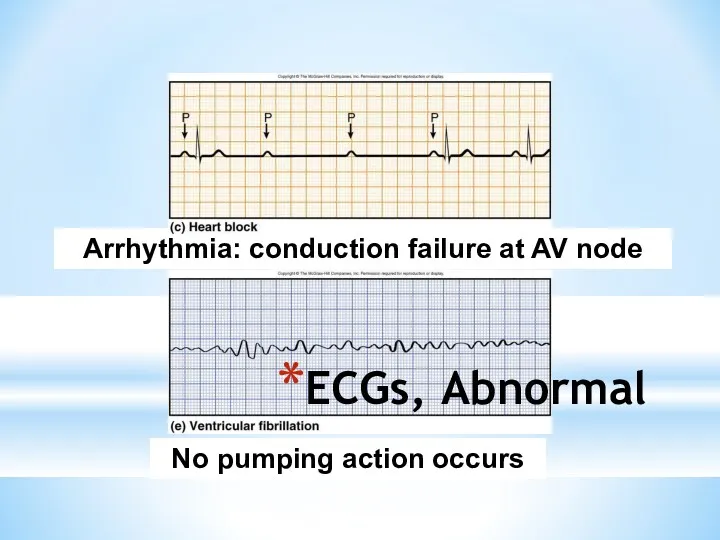
- 23. ECGs, Abnormal Arrhythmia: conduction failure at AV node No pumping action occurs
- 24. The Cardiac Cycle Cardiac cycle refers to all events associated with blood flow through the heart
- 25. Phases of the Cardiac Cycle Atrial diastole and systole - Blood flows into and passively out
- 26. Phases of the Cardiac Cycle Ventricular systole Atria relax Rising ventricular pressure results in closing of
- 27. Phases of the Cardiac Cycle Ventricular diastole Ventricles relax Backflow of blood in aorta and pulmonary
- 28. Pressure and Volume Relationships in the Cardiac Cycle
- 29. Cardiac Output (CO) and Cardiac Reserve CO is the amount of blood pumped by each ventricle
- 30. A Simple Model of Stroke Volume Figure 20.19a-d
- 31. Cardiac Output: An Example CO (ml/min) = HR (75 beats/min) x SV (70 ml/beat) CO =
- 32. Factors Affecting Cardiac Output Figure 20.20
- 33. Extrinsic Innervation of the Heart Vital centers of medulla 1. Cardiac Center Cardioaccelerator center Activates sympathetic
- 34. Regulation of the Heart Neural regulation Parasympathetic stimulation - a negative chronotropic factor Supplied by vagus
- 35. Basic heart rate established by pacemaker cells SA node establishes baseline (sinus rhythmn) Modified by ANS
- 36. Pacemaker Function
- 37. Chemical Regulation of the Heart The hormones epinephrine and thyroxine increase heart rate Intra- and extracellular
- 38. Regulation of Stroke Volume SV: volume of blood pumped by a ventricle per beat SV= end
- 39. Factors Affecting Stroke Volume EDV - affected by Venous return - vol. of blood returning to
- 40. Frank-Starling Law of the Heart Preload, or degree of stretch, of cardiac muscle cells before they
- 41. Factors Affecting Stroke Volume
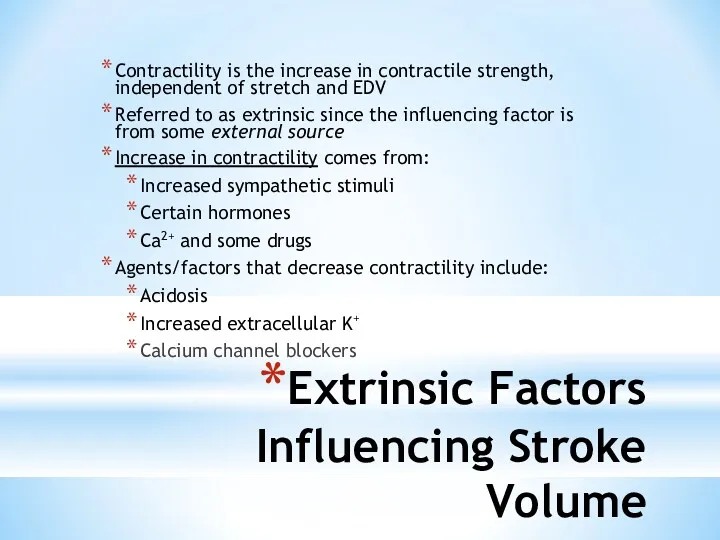
- 42. Extrinsic Factors Influencing Stroke Volume Contractility is the increase in contractile strength, independent of stretch and
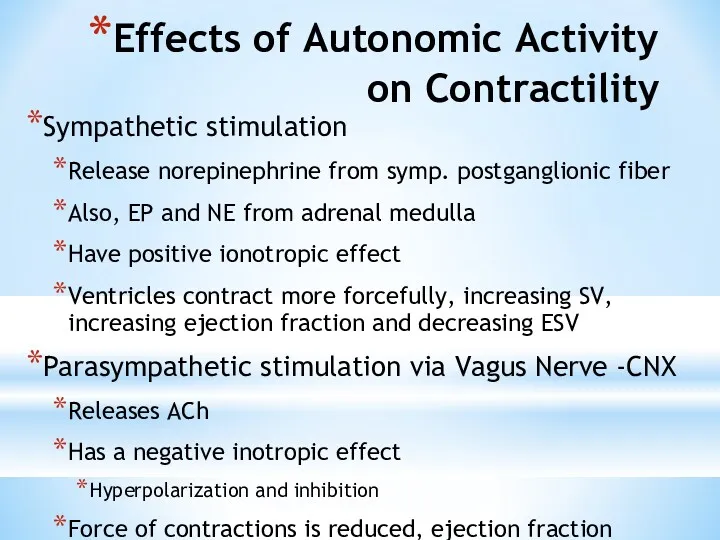
- 43. Effects of Autonomic Activity on Contractility Sympathetic stimulation Release norepinephrine from symp. postganglionic fiber Also, EP
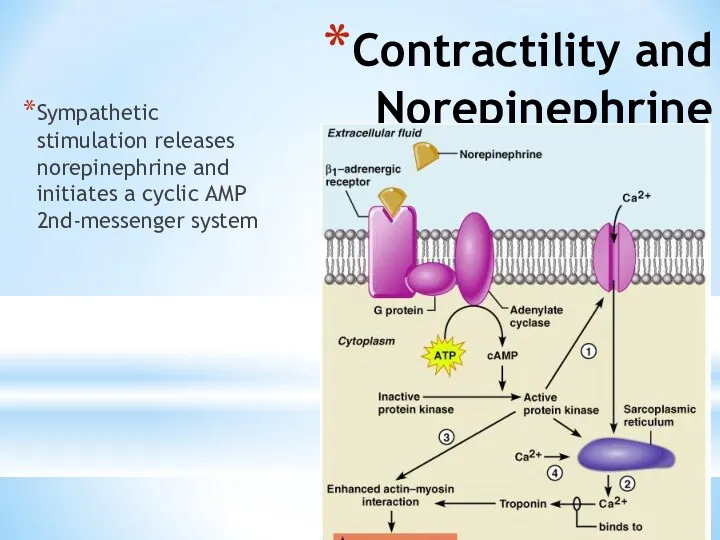
- 44. Contractility and Norepinephrine Sympathetic stimulation releases norepinephrine and initiates a cyclic AMP 2nd-messenger system Figure 18.22
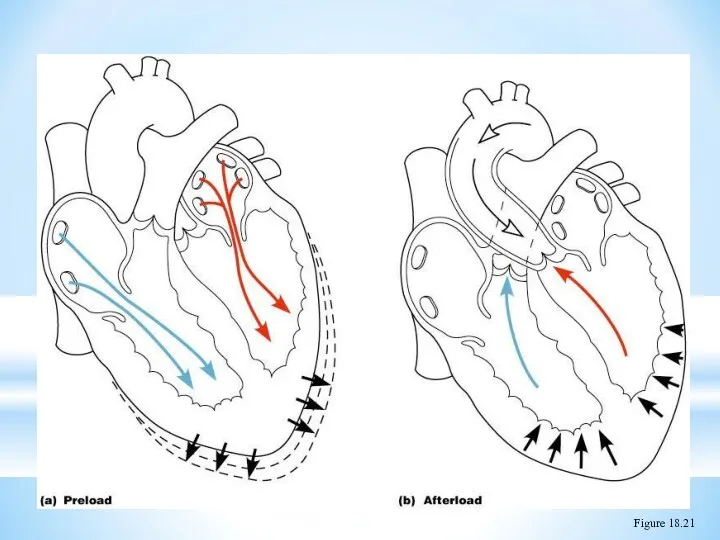
- 45. Preload and Afterload Figure 18.21
- 46. Effects of Hormones on Contractility Epi, NE, and Thyroxine all have positive ionotropic effects and thus
- 48. Скачать презентацию
Plan:
Plan:
Functions of the Heart
Generating blood pressure
Routing blood: separates pulmonary and systemic
Functions of the Heart
Generating blood pressure
Routing blood: separates pulmonary and systemic
The cardiovascular system is divided into two circuits
Pulmonary circuit
blood to
The cardiovascular system is divided into two circuits
Pulmonary circuit
blood to
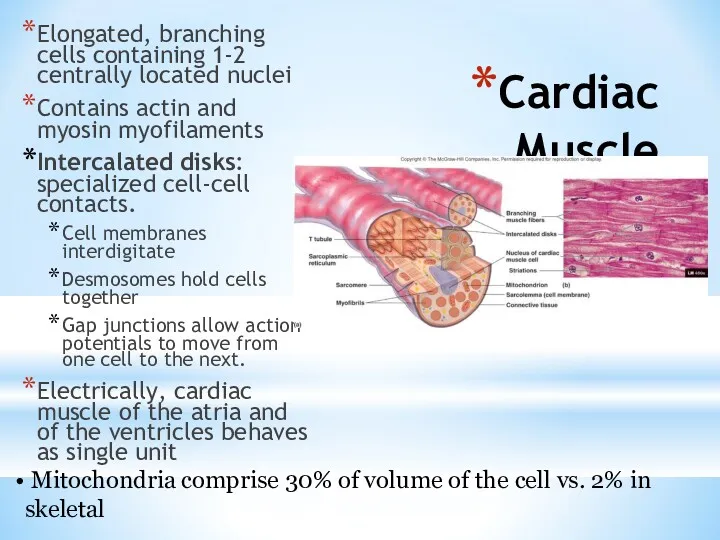
Cardiac Muscle
Elongated, branching cells containing 1-2 centrally located nuclei
Contains actin and
Cardiac Muscle
Elongated, branching cells containing 1-2 centrally located nuclei
Contains actin and
Heart chambers and valves
Structural Differences in heart chambers
The left side of
Heart chambers and valves
Structural Differences in heart chambers
The left side of
Cardiac Muscle Contraction
Heart muscle:
Is stimulated by nerves and is self-excitable (automaticity)
Contracts
Cardiac Muscle Contraction
Heart muscle:
Is stimulated by nerves and is self-excitable (automaticity)
Contracts
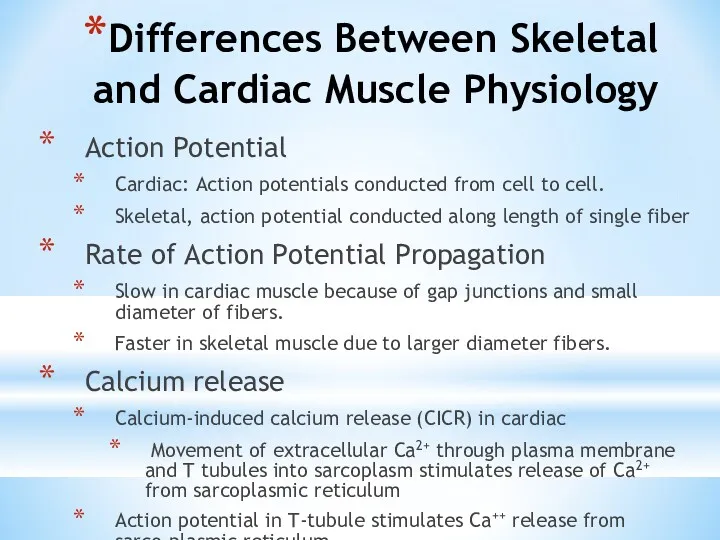
Differences Between Skeletal and Cardiac Muscle Physiology
Action Potential
Cardiac: Action potentials conducted
Differences Between Skeletal and Cardiac Muscle Physiology
Action Potential
Cardiac: Action potentials conducted
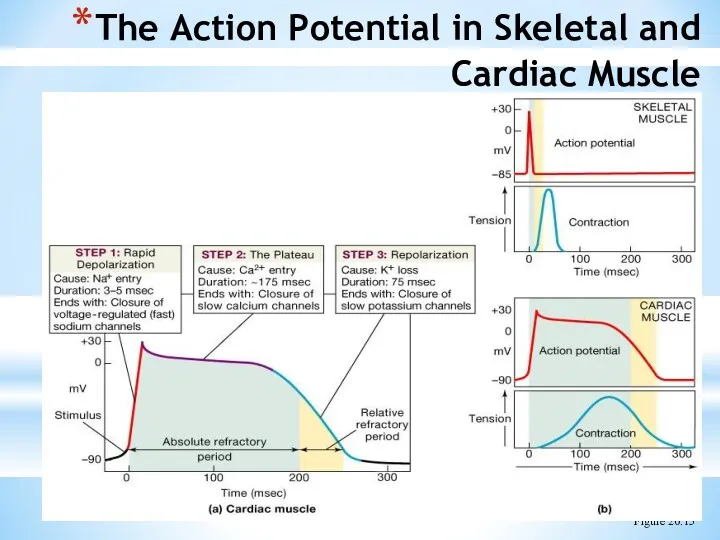
The Action Potential in Skeletal and Cardiac Muscle
Figure 20.15
The Action Potential in Skeletal and Cardiac Muscle
Figure 20.15
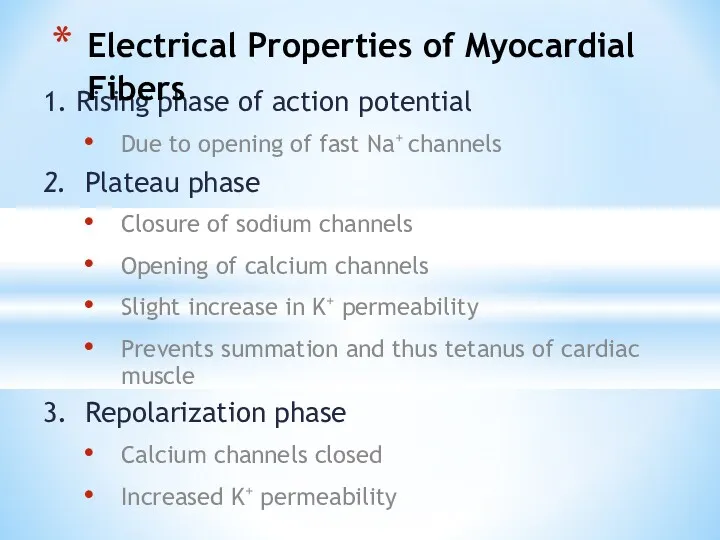
1. Rising phase of action potential
Due to opening of fast
1. Rising phase of action potential
Due to opening of fast
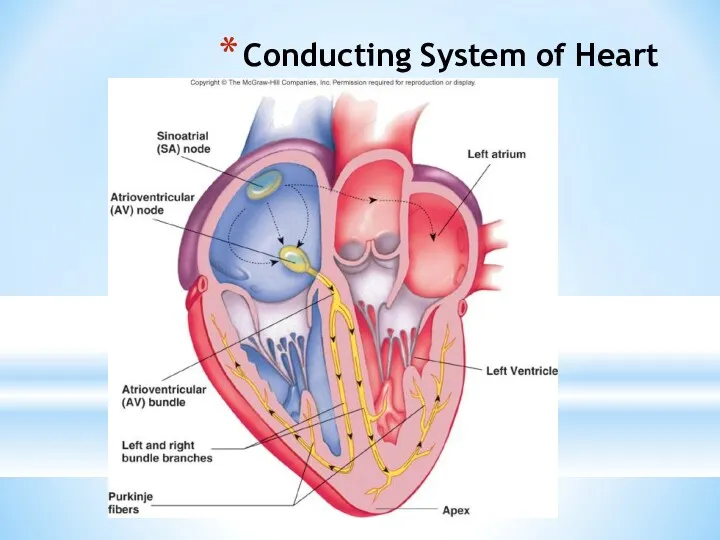
Conducting System of Heart
Conducting System of Heart
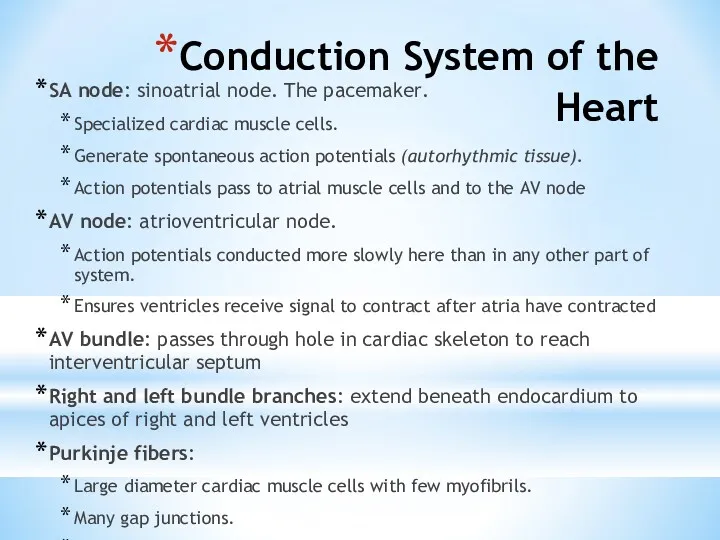
Conduction System of the Heart
SA node: sinoatrial node. The pacemaker.
Specialized
Conduction System of the Heart
SA node: sinoatrial node. The pacemaker.
Specialized
Heart Physiology: Intrinsic Conduction System
Autorhythmic cells:
Initiate action potentials
Have unstable resting
Heart Physiology: Intrinsic Conduction System
Autorhythmic cells:
Initiate action potentials
Have unstable resting
Depolarization of SA Node
SA node - no stable resting membrane potential
Pacemaker
Depolarization of SA Node
SA node - no stable resting membrane potential
Pacemaker
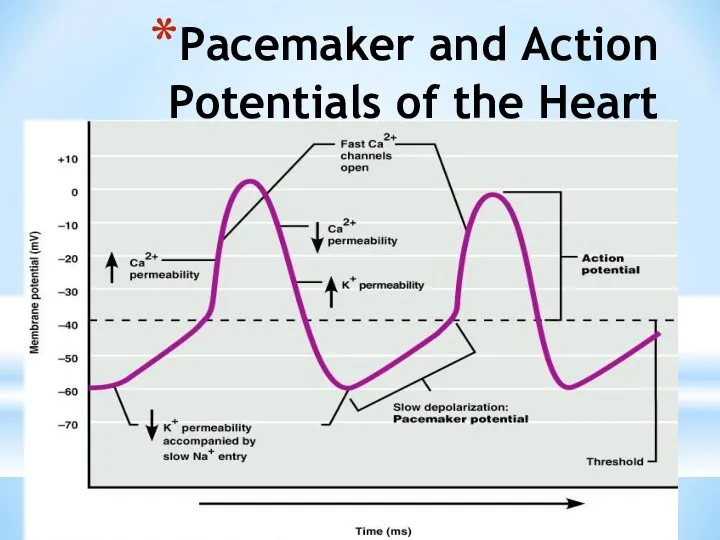
Pacemaker and Action Potentials of the Heart
Pacemaker and Action Potentials of the Heart
Heart Physiology: Sequence of Excitation
Sinoatrial (SA) node generates impulses about 75
Heart Physiology: Sequence of Excitation
Sinoatrial (SA) node generates impulses about 75
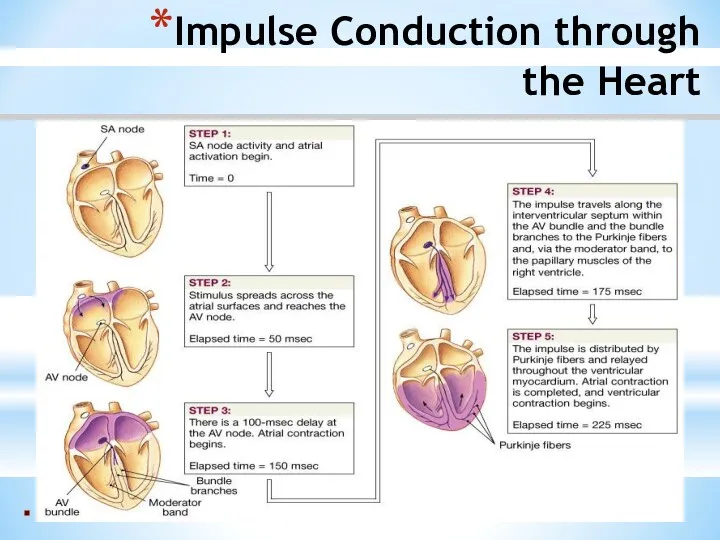
Impulse Conduction through
the Heart
Impulse Conduction through
the Heart
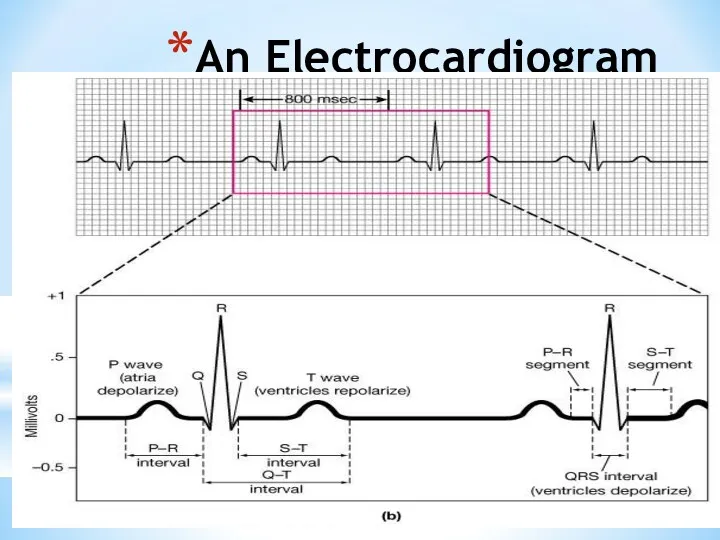
An Electrocardiogram
An Electrocardiogram
Electrocardiogram
Record of electrical events in the myocardium that can be correlated
Electrocardiogram
Record of electrical events in the myocardium that can be correlated
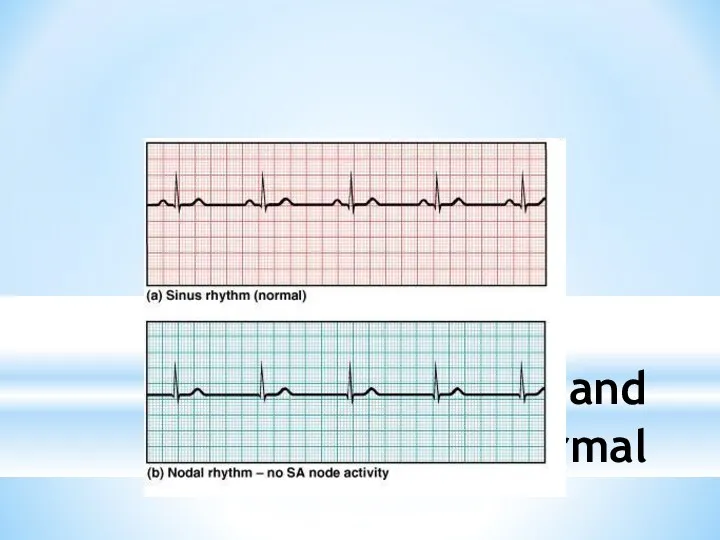
ECGs, Normal and Abnormal
ECGs, Normal and Abnormal
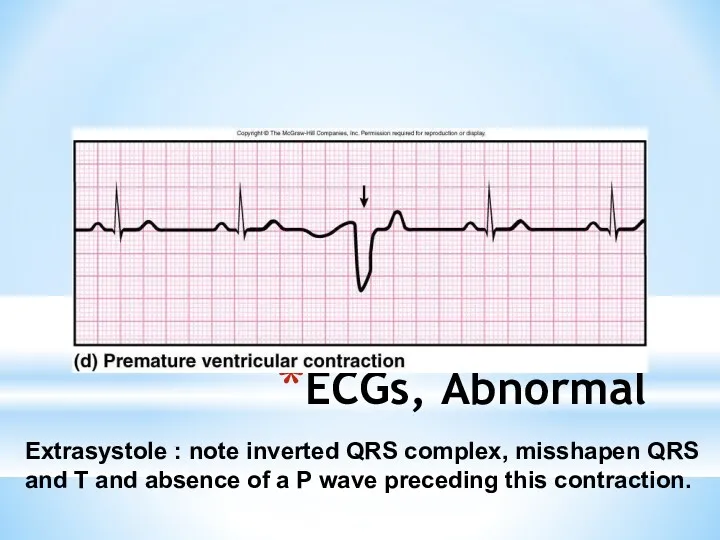
ECGs, Abnormal
Extrasystole : note inverted QRS complex, misshapen QRS and T
ECGs, Abnormal
Extrasystole : note inverted QRS complex, misshapen QRS and T
ECGs, Abnormal
Arrhythmia: conduction failure at AV node
No pumping action occurs
ECGs, Abnormal
Arrhythmia: conduction failure at AV node
No pumping action occurs
The Cardiac Cycle
Cardiac cycle refers to all events associated with blood
The Cardiac Cycle
Cardiac cycle refers to all events associated with blood
Phases of the Cardiac Cycle
Atrial diastole and systole -
Blood flows
Phases of the Cardiac Cycle
Atrial diastole and systole -
Blood flows
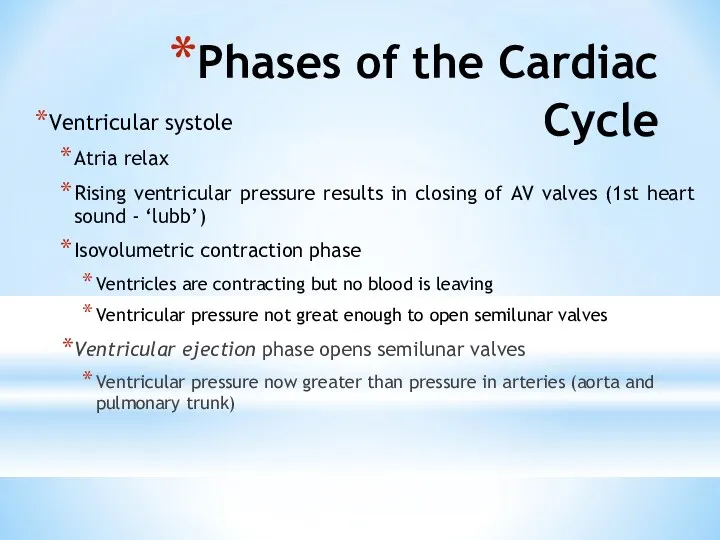
Phases of the Cardiac Cycle
Ventricular systole
Atria relax
Rising ventricular pressure results
Phases of the Cardiac Cycle
Ventricular systole
Atria relax
Rising ventricular pressure results
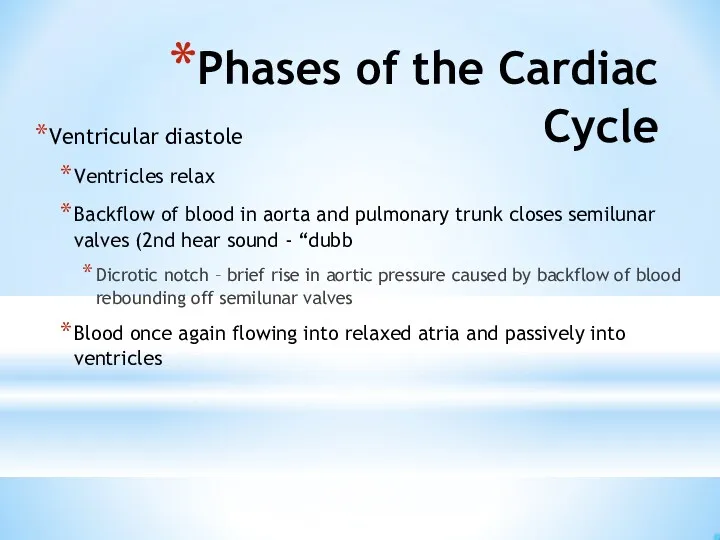
Phases of the Cardiac Cycle
Ventricular diastole
Ventricles relax
Backflow of blood in aorta
Phases of the Cardiac Cycle
Ventricular diastole
Ventricles relax
Backflow of blood in aorta
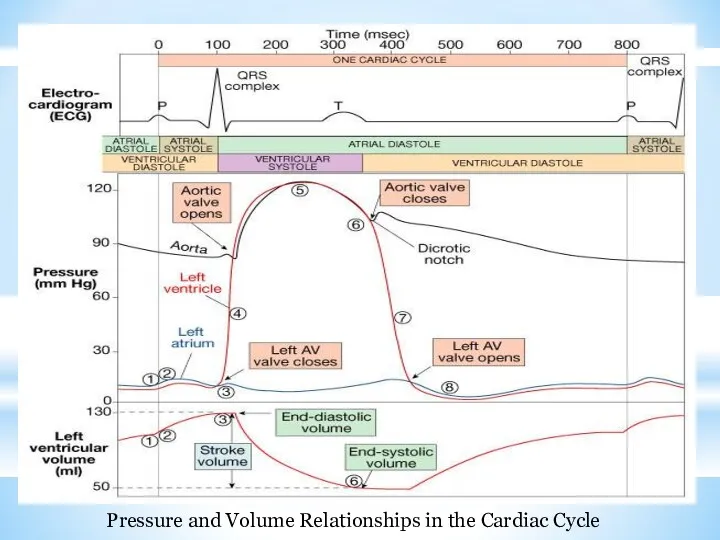
Pressure and Volume Relationships in the Cardiac Cycle
Pressure and Volume Relationships in the Cardiac Cycle
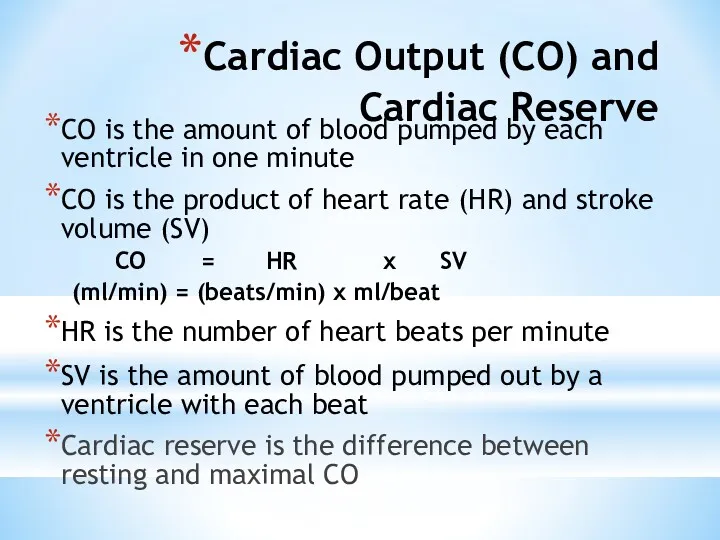
Cardiac Output (CO) and
Cardiac Reserve
CO is the amount of blood
Cardiac Output (CO) and
Cardiac Reserve
CO is the amount of blood
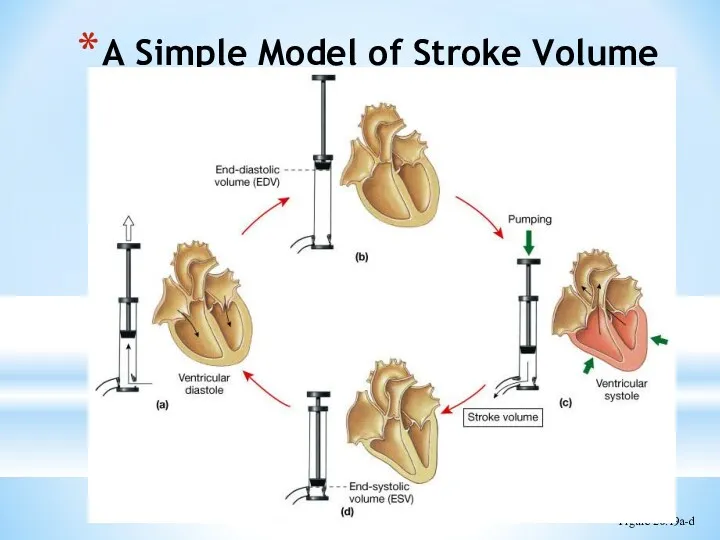
A Simple Model of Stroke Volume
Figure 20.19a-d
A Simple Model of Stroke Volume
Figure 20.19a-d
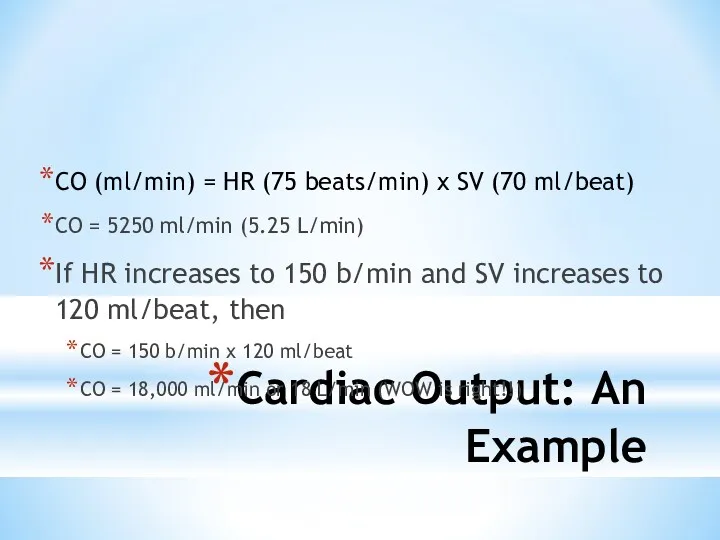
Cardiac Output: An Example
CO (ml/min) = HR (75 beats/min) x SV
Cardiac Output: An Example
CO (ml/min) = HR (75 beats/min) x SV
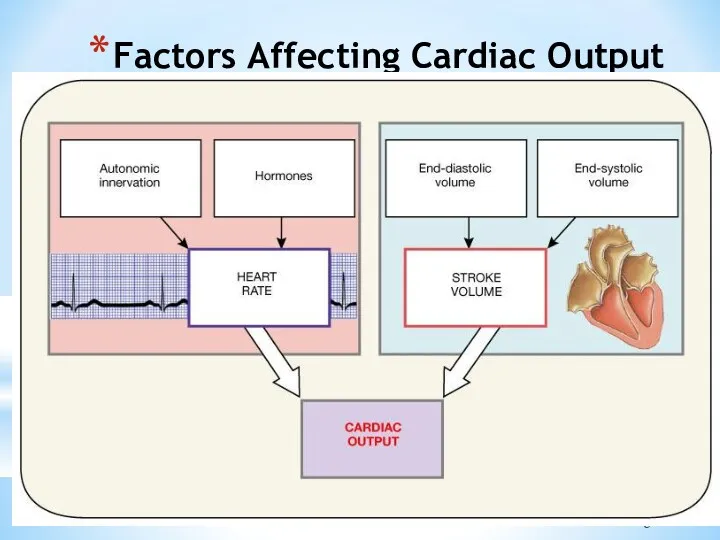
Factors Affecting Cardiac Output
Figure 20.20
Factors Affecting Cardiac Output
Figure 20.20
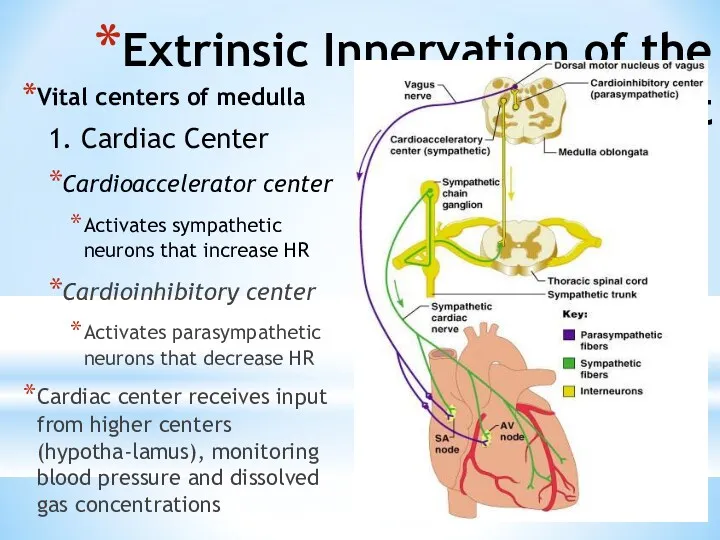
Extrinsic Innervation of the Heart
Vital centers of medulla
1. Cardiac Center
Cardioaccelerator
Extrinsic Innervation of the Heart
Vital centers of medulla
1. Cardiac Center
Cardioaccelerator
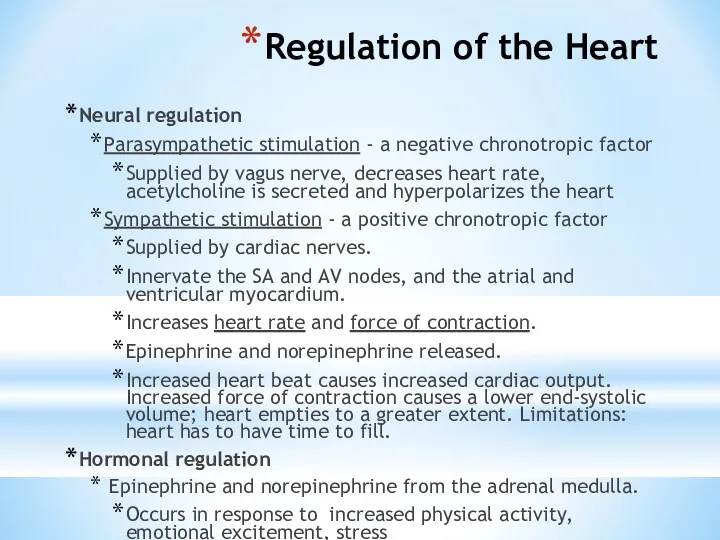
Regulation of the Heart
Neural regulation
Parasympathetic stimulation - a negative chronotropic factor
Supplied
Regulation of the Heart
Neural regulation
Parasympathetic stimulation - a negative chronotropic factor
Supplied
Basic heart rate established by pacemaker cells
SA node establishes baseline (sinus
Basic heart rate established by pacemaker cells
SA node establishes baseline (sinus
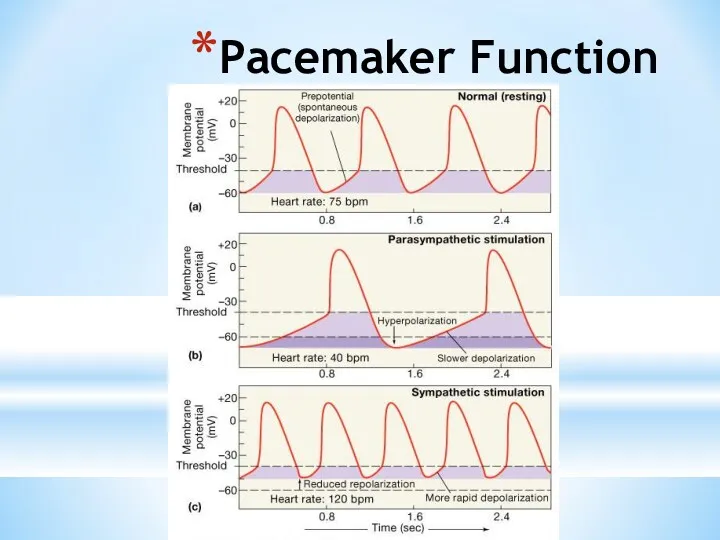
Pacemaker Function
Pacemaker Function
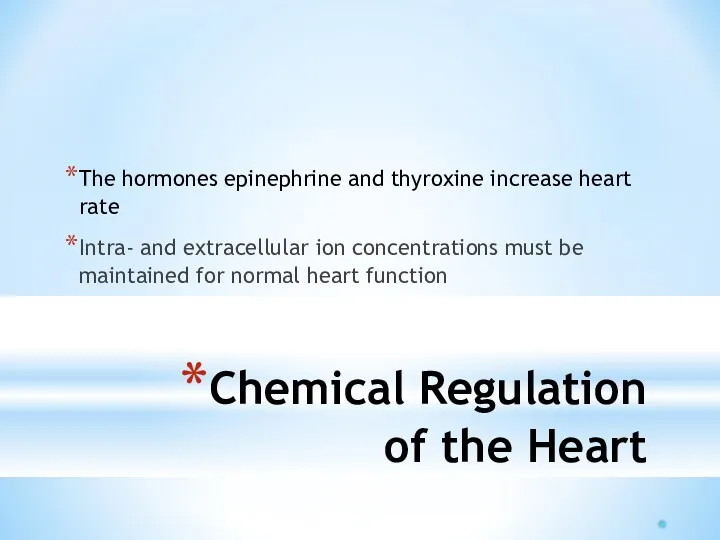
Chemical Regulation of the Heart
The hormones epinephrine and thyroxine increase heart
Chemical Regulation of the Heart
The hormones epinephrine and thyroxine increase heart
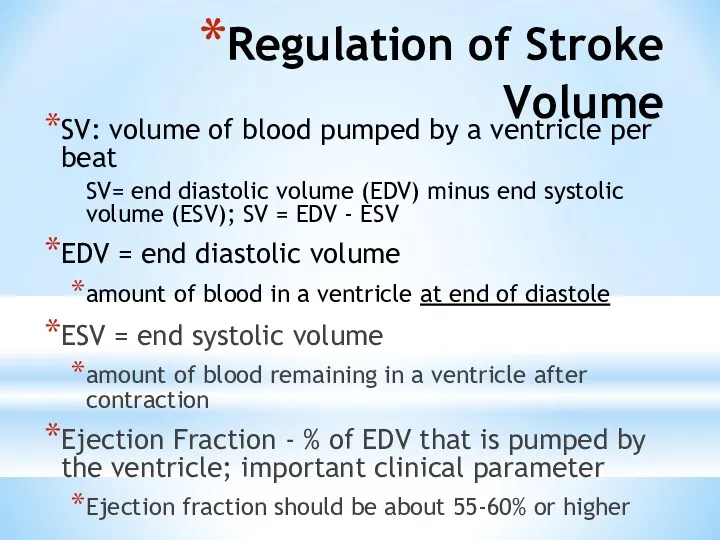
Regulation of Stroke Volume
SV: volume of blood pumped by a ventricle
Regulation of Stroke Volume
SV: volume of blood pumped by a ventricle
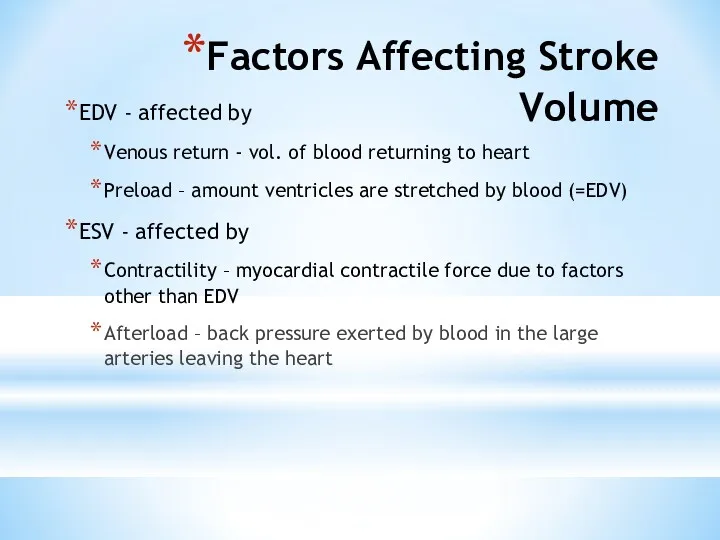
Factors Affecting Stroke Volume
EDV - affected by
Venous return - vol. of
Factors Affecting Stroke Volume
EDV - affected by
Venous return - vol. of
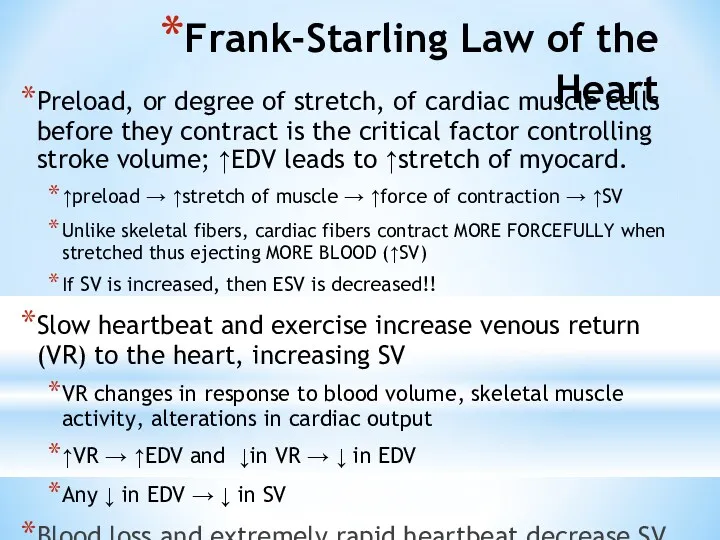
Frank-Starling Law of the Heart
Preload, or degree of stretch, of cardiac
Frank-Starling Law of the Heart
Preload, or degree of stretch, of cardiac
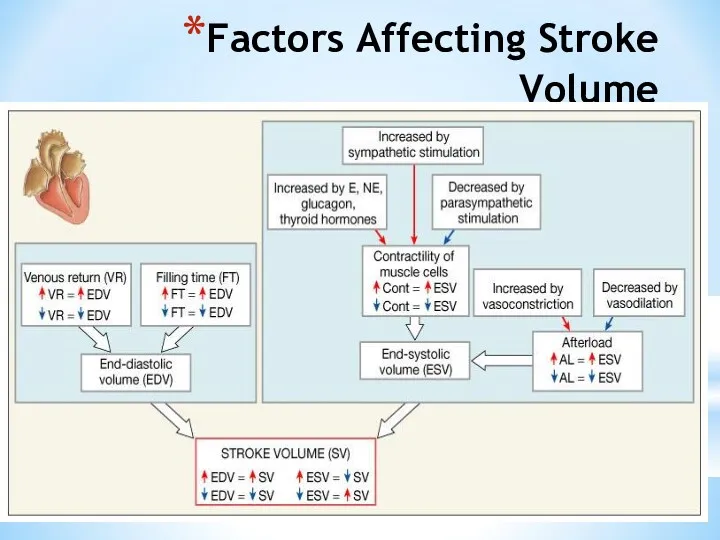
Factors Affecting Stroke Volume
Factors Affecting Stroke Volume
Extrinsic Factors Influencing Stroke Volume
Contractility is the increase in contractile strength,
Extrinsic Factors Influencing Stroke Volume
Contractility is the increase in contractile strength,
Effects of Autonomic Activity on Contractility
Sympathetic stimulation
Release norepinephrine from symp. postganglionic
Effects of Autonomic Activity on Contractility
Sympathetic stimulation
Release norepinephrine from symp. postganglionic
Contractility and Norepinephrine
Sympathetic stimulation releases norepinephrine and initiates a cyclic AMP
Contractility and Norepinephrine
Sympathetic stimulation releases norepinephrine and initiates a cyclic AMP
Preload and Afterload
Figure 18.21
Preload and Afterload
Figure 18.21
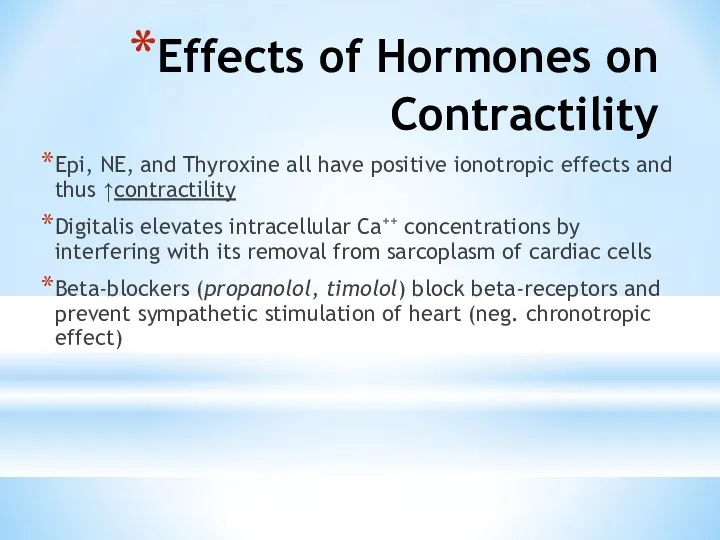
Effects of Hormones on Contractility
Epi, NE, and Thyroxine all have positive
Effects of Hormones on Contractility
Epi, NE, and Thyroxine all have positive
 Разбор клинического случая
 Хронический гастрит
 Травматические повреждения костей и суставов
 Принципы нормирования опасных и вредных факторов
 Хирургиялык жане тану кабинеті
 Основные проблемы гигиены детей и подростков
 Экспертиза временной нетрудоспособности терапевтических больных в поликлинике
 Иммобилизденген ферменттер
 Cестринский уход за новорождёнными при многоплодной беременности
 Dentists in Canada
 Частная патологическая анатомия. Болезни ССС
 Adult Nursing Care I
 Ветряная оспа
 Острые лейкозы. Основные методы исследования при ОЛ
 Совершенствование системы оплаты труда в здравоохранении - как по-новому запланировать расходы
 Есту және тепе-теңдік мүшесі
 Инфекциялық емес патологиядағы менингеальды синдром. Туберкулезді менингитпен екшеу диагностикасы
 Балалардың асқазан - ішек аурулары туралы түсінік беру. Балаларда ішек жұқпасының көріністері
 Серонегативные спондилоартриты
 Актуальные вопросы профилактики, диагностики коронавирусной инфекции
 Перитонеальный диализ
 Сульфаниламидные препараты
 OMS - Organizaţia Mondială a Sănătăţii
 Гепатит С
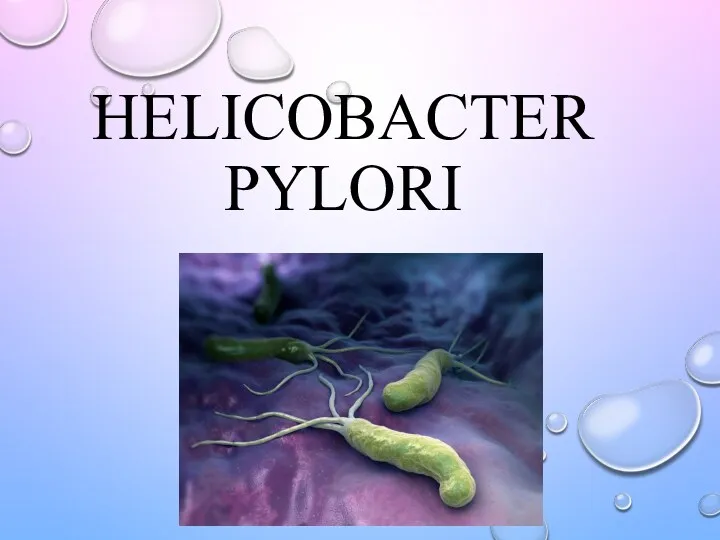 Бактерия Helicobacter pylori
 Острая печеночная недостаточность
 Термические повреждения
 Жай және күрделі ұнтақтардың дайындалуы. Улы және күшті әсер ететін дәрілік заттары бар ұнтақтардың технологиясы. Тритурация