- CS189A/172 - Winter 2008

Содержание
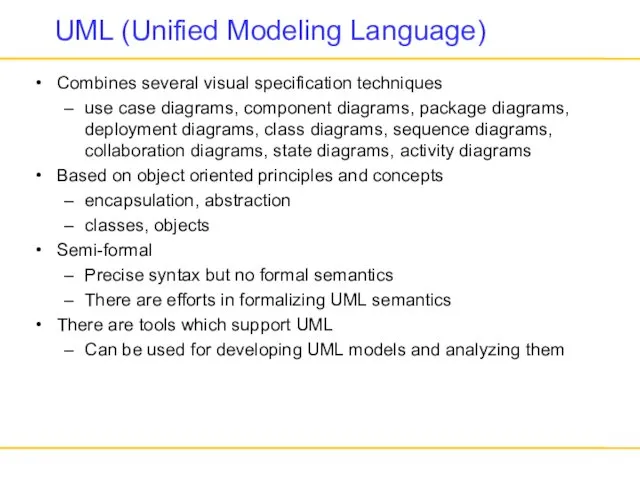
- 2. UML (Unified Modeling Language) Combines several visual specification techniques use case diagrams, component diagrams, package diagrams,
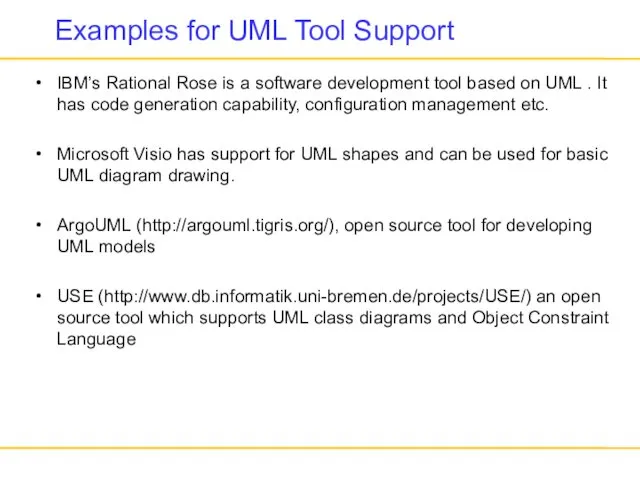
- 3. Examples for UML Tool Support IBM’s Rational Rose is a software development tool based on UML
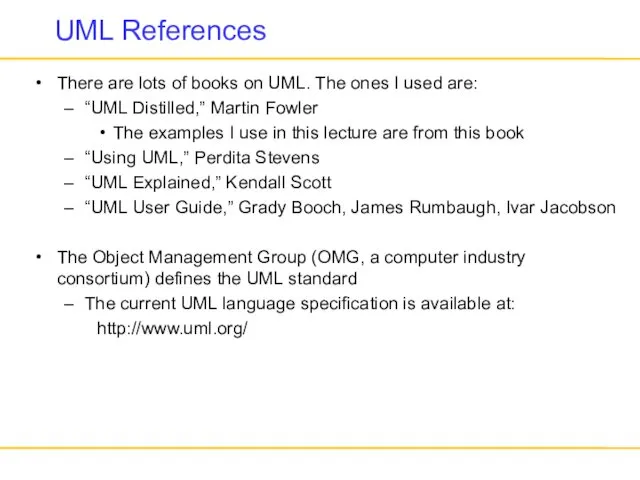
- 4. UML References There are lots of books on UML. The ones I used are: “UML Distilled,”
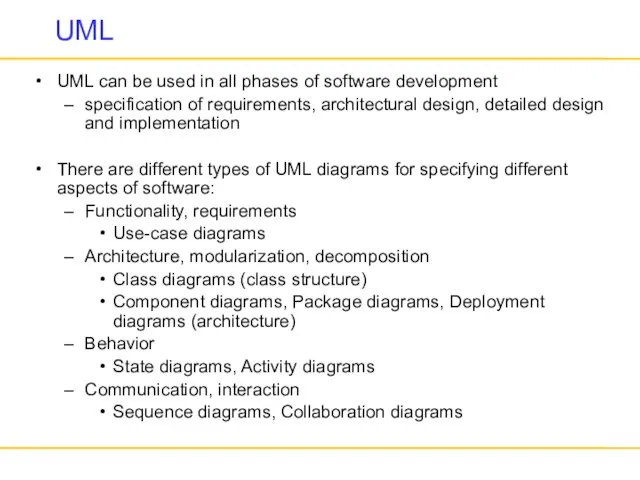
- 5. UML UML can be used in all phases of software development specification of requirements, architectural design,
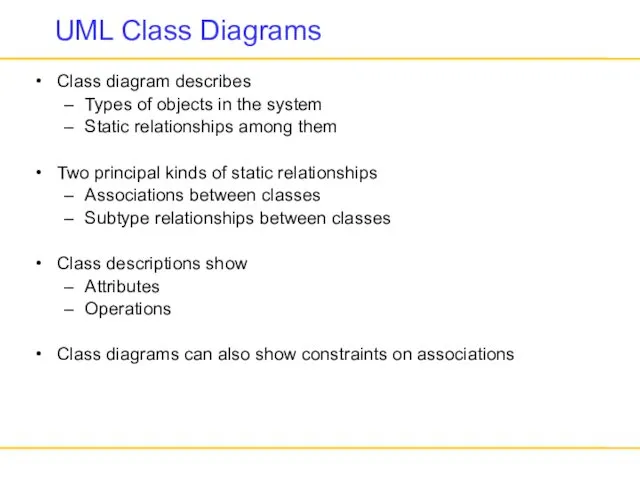
- 6. UML Class Diagrams Class diagram describes Types of objects in the system Static relationships among them
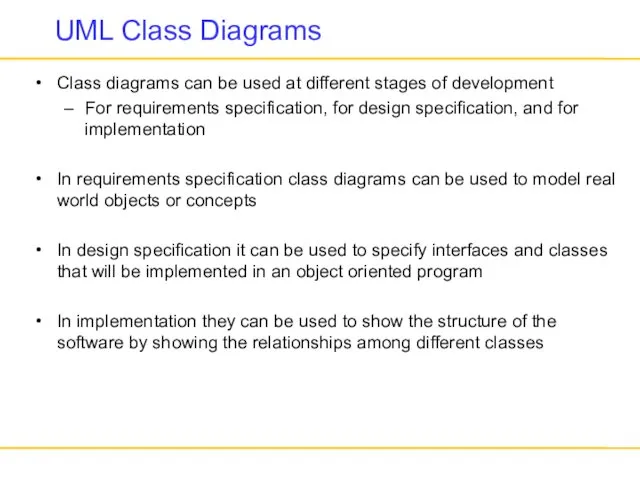
- 7. UML Class Diagrams Class diagrams can be used at different stages of development For requirements specification,
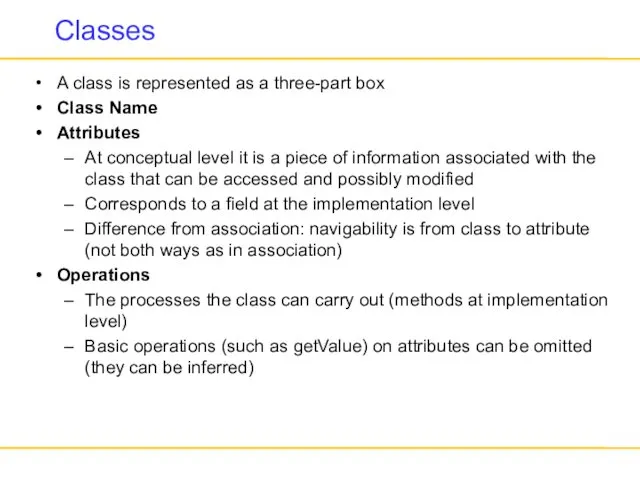
- 8. Classes A class is represented as a three-part box Class Name Attributes At conceptual level it
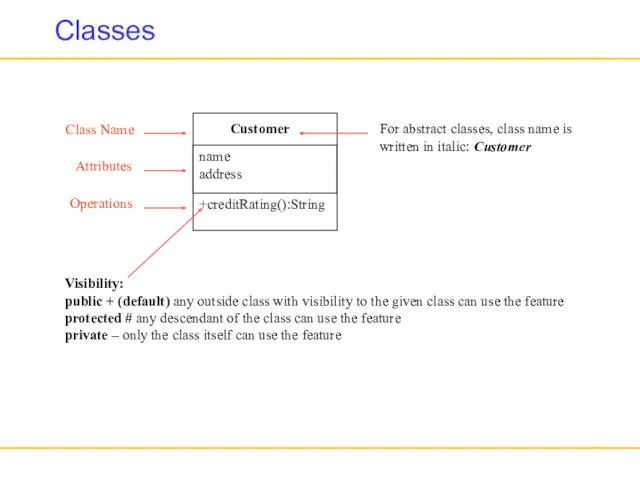
- 9. Classes Customer name address Class Name Attributes Operations +creditRating():String Visibility: public + (default) any outside class
- 10. Classes Attribute syntax: visibility name[ multiplicity ] : type = initial-value { property-string } can be:
- 11. Associations Associations are shown as lines between classes An association shows a relationship between instances of
- 12. Generalization Generalization is used to show subtyping between classes Subtype is a specialization of the supertype
- 13. Constraints Constraints can be used to represent further restrictions on associations or classes Constraints are stated
- 14. Example Class Diagram Order dateReceived isPrepaid number: String price: Money dispatch() close() Product Order quantity: Int
- 15. Aggregation and Composition Aggregation is a part-of relationship Composition is also a part-of relationship, but part
- 16. Association Classes Adds attributes and operations to an association Allows exactly one instance of the association
- 17. Sequence Diagrams A sequence diagram shows a particular sequence of messages exchanged between a number of
- 18. Sequence Diagrams Sequence diagrams can be used in conjunction with use-cases At the requirements phase they
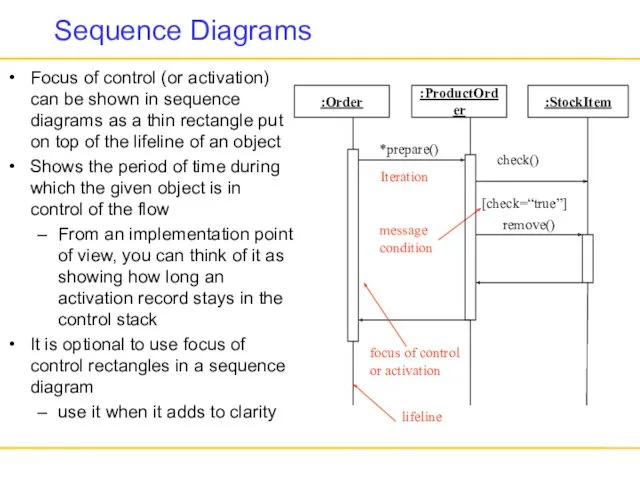
- 19. Components of Sequence Diagrams Object (an instance of a class) shown as a box at the
- 20. Components of Sequence Diagrams Messages communication between objects correspond to method calls at the implementation level
- 21. Components of Sequence Diagrams Two kinds of control information: message conditions message is sent only if
- 22. Example Sequence Diagram :ProductOrder :StockItem check() :Order *prepare() [check=“true”] remove() :OrderEntryWindow prepare() :ReorderItem :DeliveryItem needsToReorder() >
- 23. Sequence diagrams Show conditional behavior on separate diagrams to keep them understandable for example for a
- 24. Sequence Diagrams Focus of control (or activation) can be shown in sequence diagrams as a thin
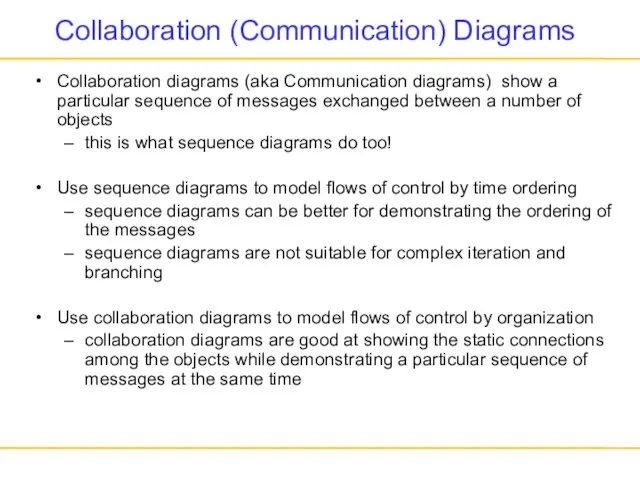
- 25. Collaboration (Communication) Diagrams Collaboration diagrams (aka Communication diagrams) show a particular sequence of messages exchanged between
- 26. Example Sequence Diagram :ProductOrder :StockItem check() :Order *prepare() [check=“true”] remove() :OrderEntryWindow prepare() :ReorderItem :DeliveryItem needsToReorder() >
- 27. Corresponding Collaboration Diagram :ProductOrder :StockItem :Order :OrderEntryWindow :ReorderItem :DeliveryItem 1:prepare() 1.1:*prepare() 1.1.1:check() 1.1.2:[check==true]remove() 1.1.2.1:needsToReorder() 1.1.2.2:new 1.1.3:[check==true]new
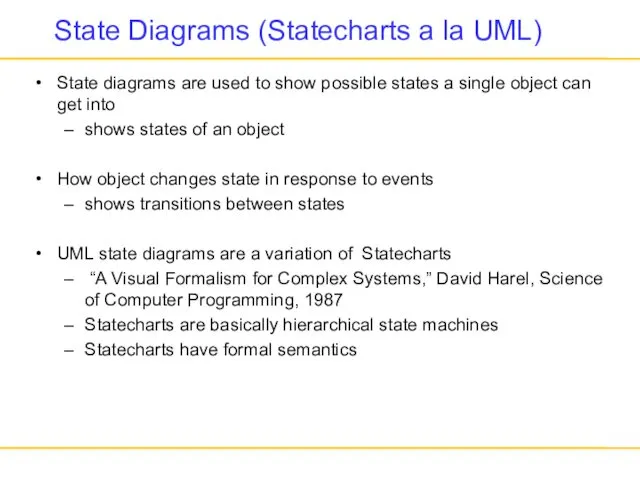
- 28. State Diagrams (Statecharts a la UML) State diagrams are used to show possible states a single
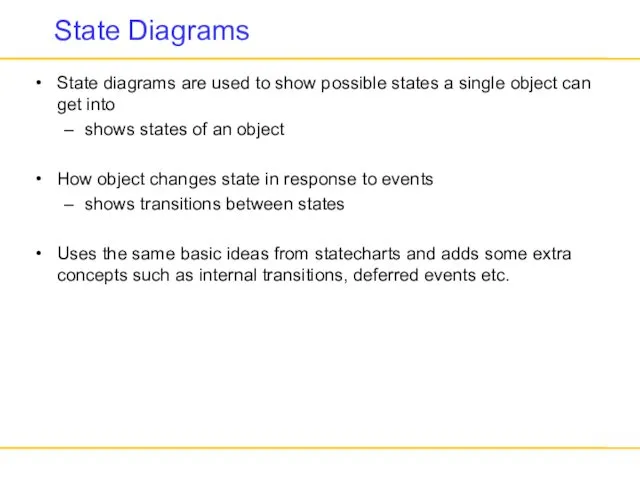
- 29. State Diagrams State diagrams are used to show possible states a single object can get into
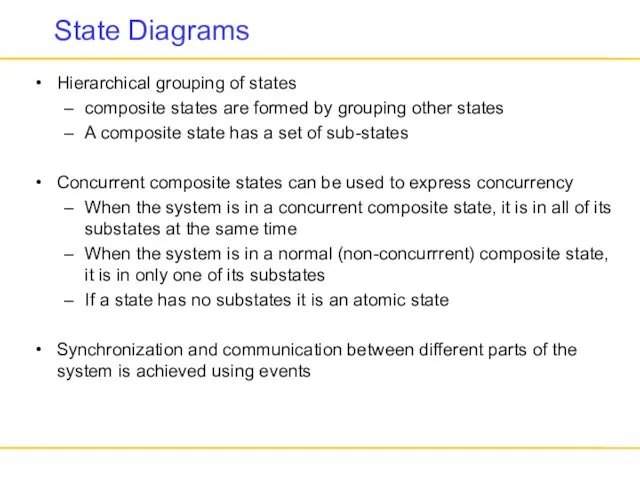
- 30. State Diagrams Hierarchical grouping of states composite states are formed by grouping other states A composite
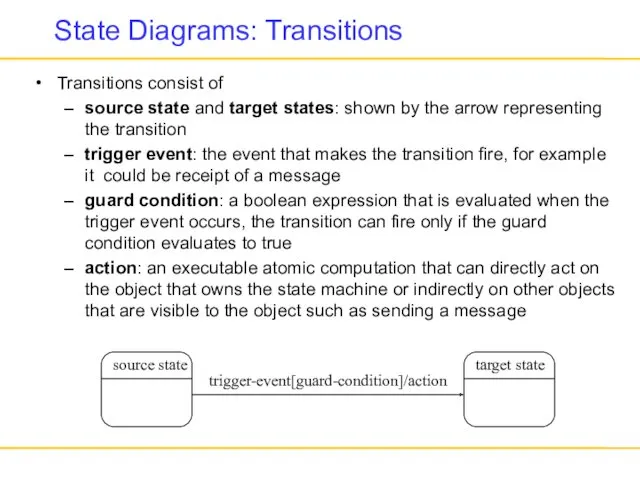
- 31. State Diagrams: Transitions Transitions consist of source state and target states: shown by the arrow representing
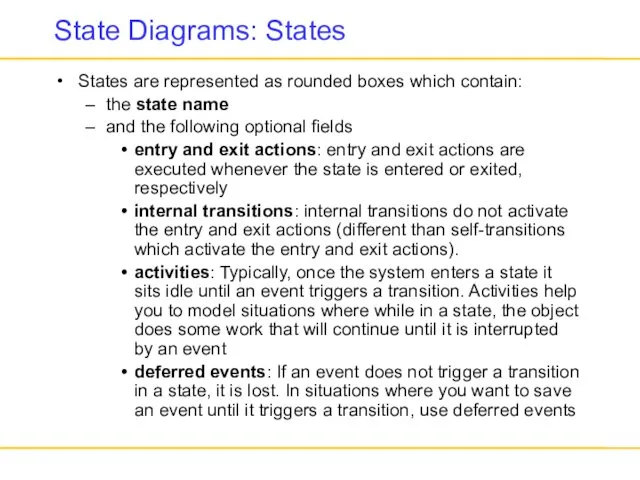
- 32. State Diagrams: States States are represented as rounded boxes which contain: the state name and the
- 33. State Diagrams: States Tracking entry / setMode(on Track) exit / setMode(off Track) newTarget / tracker.Acquire() do
- 34. State Diagrams Checking do / checkItem / getFirstItem shows the initial (default) state cancelled getNextItem [not
- 35. State Diagram Example: States of an Order object Checking do/checkItem / getFirstItem getNextItem [not all items
- 36. State Diagrams: Superstates Checking do/checkItem / getFirstItem getNextItem [not all items checked] Dispatching do/initiate Delivery Waiting
- 37. State Diagrams: Concurrent states Payment authorization is done concurrently with the order processing Authorizing do/check Payment
- 38. State Diagrams: Concurrent States Checking Dispatching Waiting Authorizing Authorized Delivered Cancelled Rejected [payment not OK] cancelled
- 39. State Diagrams Good at describing behavior of an object across several use-cases Use them to show
- 40. Activity Diagrams Activity diagrams show the flow among activities and actions associated with a given object
- 41. Activity Diagrams Activity represents a task that has to be performed, a non-atomic execution within a
- 42. Activity Diagrams When an activity or action is completed the control passes immediately to the next
- 43. Activity Diagrams: Branches Conditional branches correspond to if-then-else or switch statements at the implementation level a
- 44. Activity Diagrams: Forks and Joins Forks and joins are used to model concurrent execution paths They
- 45. Receive Order Check Order Item Dispatch Order Authorize Payment Cancel Order Add Remainder to Stock [succeeded]
- 46. UML Diagrams Functionality, requirements use case diagrams Architecture, modularization, decomposition class diagrams (class structure) component diagrams,
- 48. Скачать презентацию
UML (Unified Modeling Language)
Combines several visual specification techniques
use case diagrams, component
UML (Unified Modeling Language)
Combines several visual specification techniques
use case diagrams, component
Examples for UML Tool Support
IBM’s Rational Rose is a software development
Examples for UML Tool Support
IBM’s Rational Rose is a software development
UML References
There are lots of books on UML. The ones
UML References
There are lots of books on UML. The ones
UML
UML can be used in all phases of software development
specification
UML
UML can be used in all phases of software development
specification
UML Class Diagrams
Class diagram describes
Types of objects in the system
Static relationships
UML Class Diagrams
Class diagram describes
Types of objects in the system
Static relationships
UML Class Diagrams
Class diagrams can be used at different stages of
UML Class Diagrams
Class diagrams can be used at different stages of
Classes
A class is represented as a three-part box
Class Name
Attributes
At conceptual
Classes
A class is represented as a three-part box
Class Name
Attributes
At conceptual
Classes
Customer
name
address
Class Name
Attributes
Operations
+creditRating():String
Visibility:
public + (default) any outside class with visibility to the
Classes
Customer
name
address
Class Name
Attributes
Operations
+creditRating():String
Visibility:
public + (default) any outside class with visibility to the
![Classes Attribute syntax: visibility name[ multiplicity ] : type =](/_ipx/f_webp&q_80&fit_contain&s_1440x1080/imagesDir/jpg/94508/slide-9.jpg)
Classes
Attribute syntax: visibility name[ multiplicity ] : type = initial-value {
Classes
Attribute syntax: visibility name[ multiplicity ] : type = initial-value {
Associations
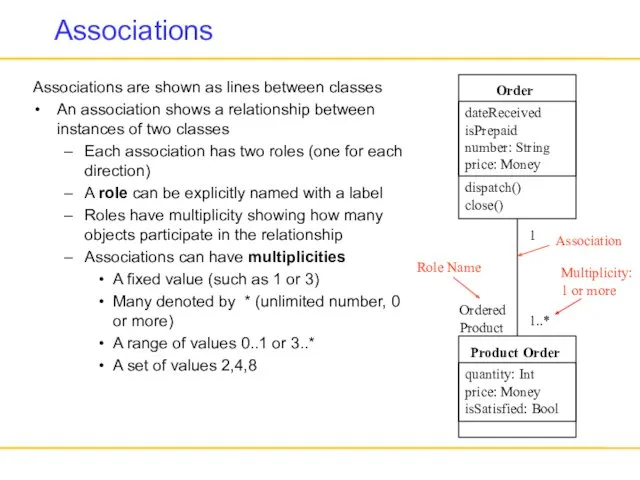
Associations are shown as lines between classes
An association shows a relationship
Associations
Associations are shown as lines between classes
An association shows a relationship
Generalization
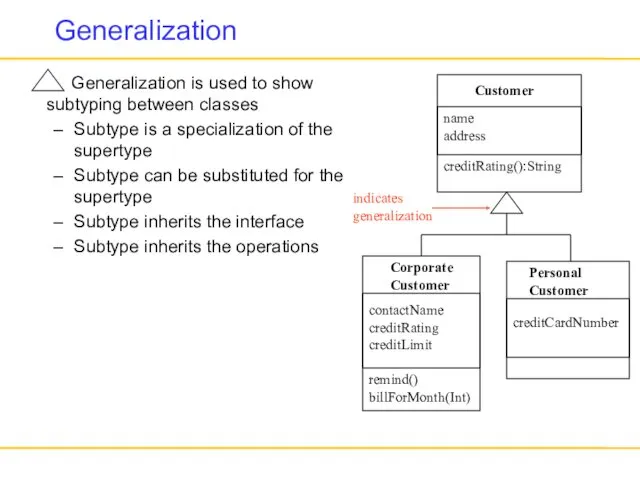
Generalization is used to show subtyping between classes
Subtype is a
Generalization
Generalization is used to show subtyping between classes
Subtype is a
Constraints
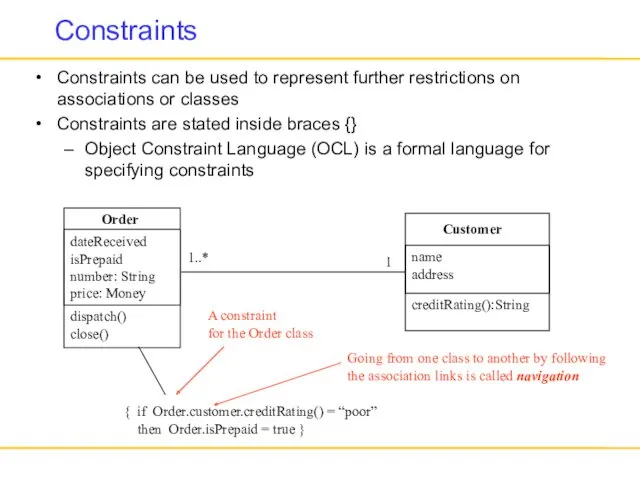
Constraints can be used to represent further restrictions on associations or
Constraints
Constraints can be used to represent further restrictions on associations or
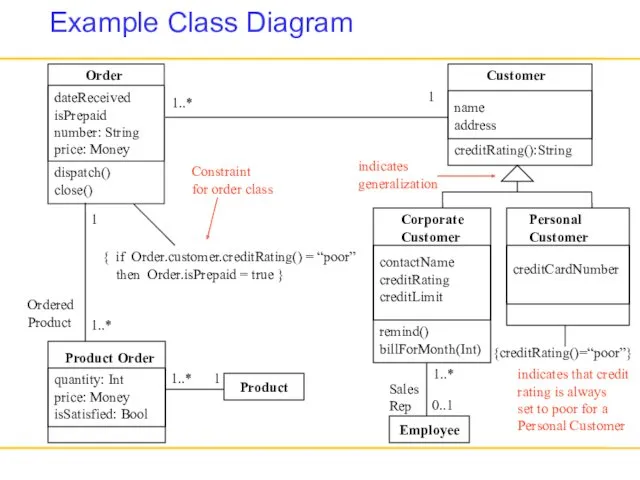
Example Class Diagram
Order
dateReceived
isPrepaid
number: String
price: Money
dispatch()
close()
Product Order
quantity: Int
price: Money
isSatisfied: Bool
1
1..*
Ordered
Product
Constraint
for order class
Product
1..*
1
Corporate
Customer
contactName
creditRating
creditLimit
remind()
billForMonth(Int)
Customer
name
address
creditRating():String
Personal
Customer
creditCardNumber
indicates
generalization
1
1..*
Employee
0..1
1..*
Sales
Rep
{creditRating()=“poor”}
indicates
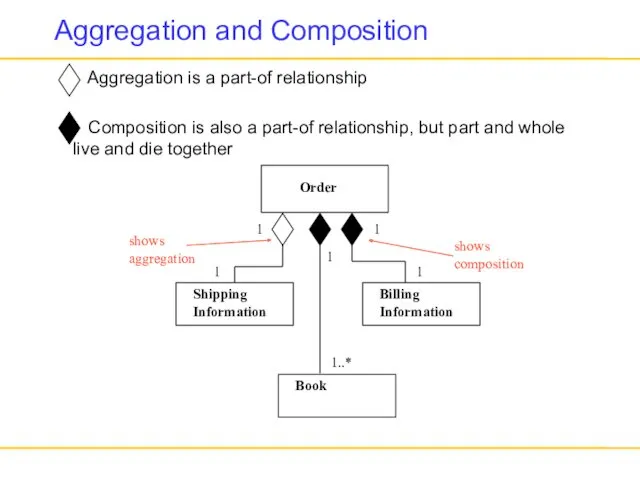
Aggregation and Composition
Aggregation is a part-of relationship
Composition is also
Aggregation and Composition
Aggregation is a part-of relationship
Composition is also
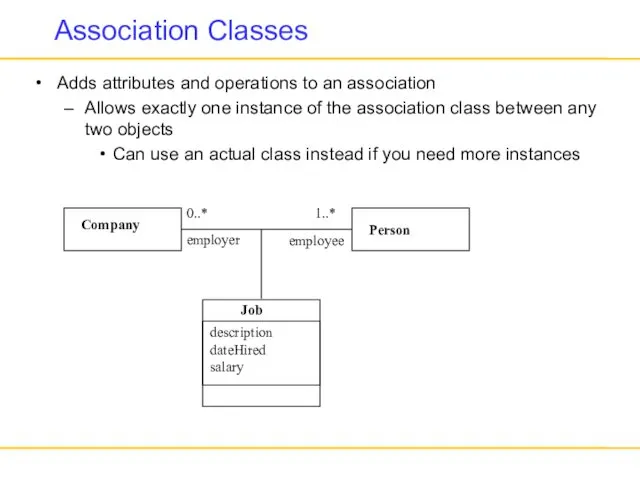
Association Classes
Adds attributes and operations to an association
Allows exactly one instance
Association Classes
Adds attributes and operations to an association
Allows exactly one instance
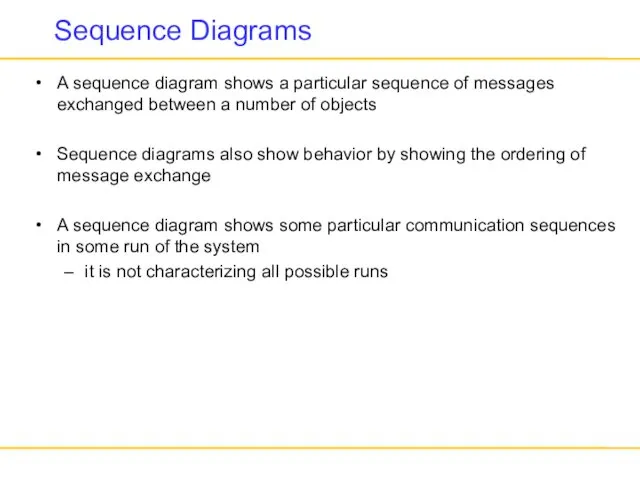
Sequence Diagrams
A sequence diagram shows a particular sequence of messages exchanged
Sequence Diagrams
A sequence diagram shows a particular sequence of messages exchanged
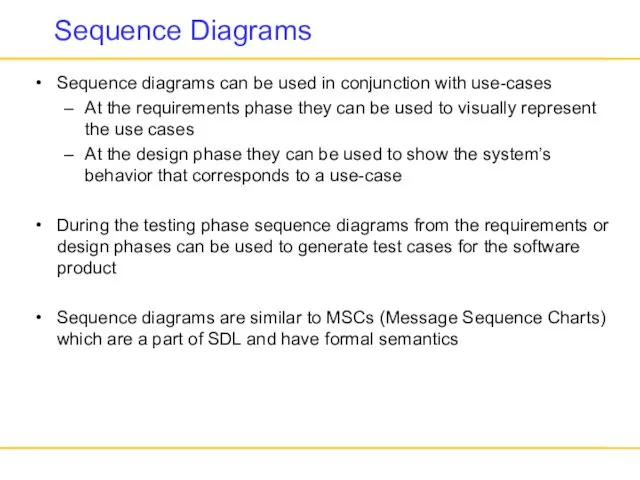
Sequence Diagrams
Sequence diagrams can be used in conjunction with use-cases
At
Sequence Diagrams
Sequence diagrams can be used in conjunction with use-cases
At
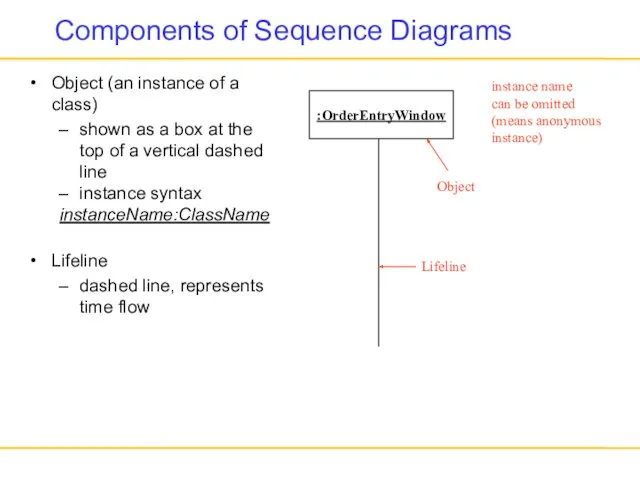
Components of Sequence Diagrams
Object (an instance of a class)
shown as a
Components of Sequence Diagrams
Object (an instance of a class)
shown as a
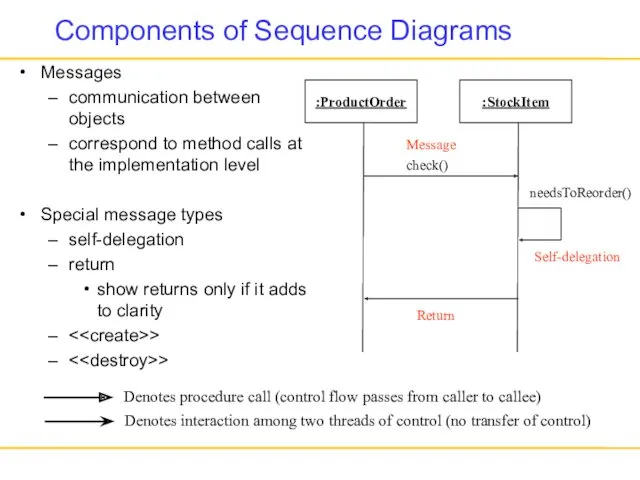
Components of Sequence Diagrams
Messages
communication between objects
correspond to method calls at the
Components of Sequence Diagrams
Messages
communication between objects
correspond to method calls at the
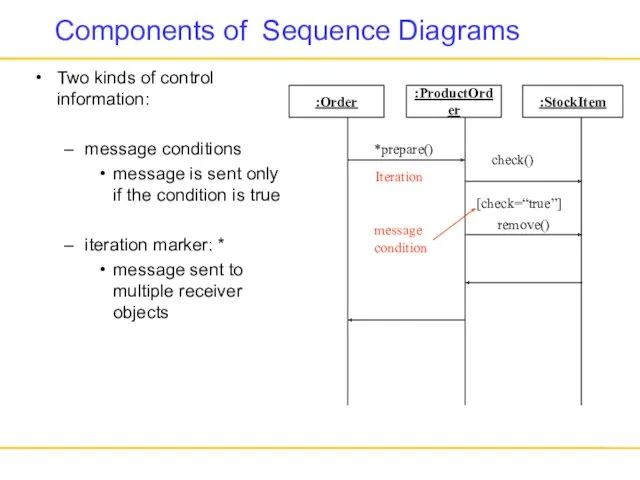
Components of Sequence Diagrams
Two kinds of control information:
message conditions
message is sent
Components of Sequence Diagrams
Two kinds of control information:
message conditions
message is sent
![Example Sequence Diagram :ProductOrder :StockItem check() :Order *prepare() [check=“true”] remove()](/_ipx/f_webp&q_80&fit_contain&s_1440x1080/imagesDir/jpg/94508/slide-21.jpg)
Example Sequence Diagram
:ProductOrder
:StockItem
check()
:Order
*prepare()
[check=“true”]
remove()
:OrderEntryWindow
prepare()
:ReorderItem
:DeliveryItem
needsToReorder()
<>
[check=“true”]
<>
[needsToReorder=“true”]
Example Sequence Diagram
:ProductOrder
:StockItem
check()
:Order
*prepare()
[check=“true”]
remove()
:OrderEntryWindow
prepare()
:ReorderItem
:DeliveryItem
needsToReorder()
< [check=“true”] [needsToReorder=“true”]
<
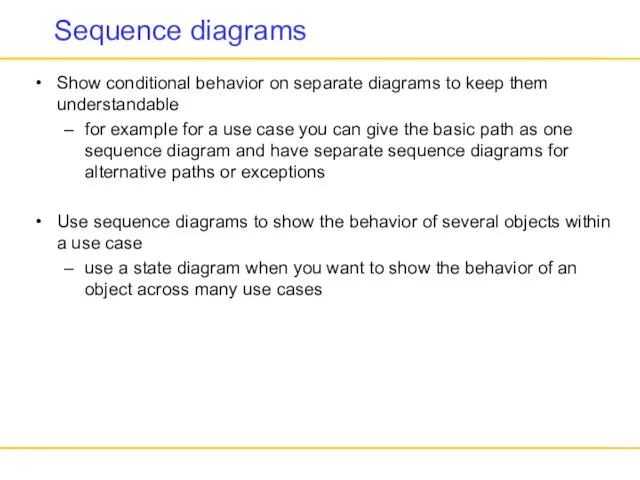
Sequence diagrams
Show conditional behavior on separate diagrams to keep them understandable
for
Sequence diagrams
Show conditional behavior on separate diagrams to keep them understandable
for
Sequence Diagrams
Focus of control (or activation) can be shown in sequence
Sequence Diagrams
Focus of control (or activation) can be shown in sequence
Collaboration (Communication) Diagrams
Collaboration diagrams (aka Communication diagrams) show a particular
Collaboration (Communication) Diagrams
Collaboration diagrams (aka Communication diagrams) show a particular
![Example Sequence Diagram :ProductOrder :StockItem check() :Order *prepare() [check=“true”] remove()](/_ipx/f_webp&q_80&fit_contain&s_1440x1080/imagesDir/jpg/94508/slide-25.jpg)
Example Sequence Diagram
:ProductOrder
:StockItem
check()
:Order
*prepare()
[check=“true”]
remove()
:OrderEntryWindow
prepare()
:ReorderItem
:DeliveryItem
needsToReorder()
<>
[check=“true”]
<>
[needsToReorder=“true”]
Example Sequence Diagram
:ProductOrder
:StockItem
check()
:Order
*prepare()
[check=“true”]
remove()
:OrderEntryWindow
prepare()
:ReorderItem
:DeliveryItem
needsToReorder()
< [check=“true”] [needsToReorder=“true”]
<
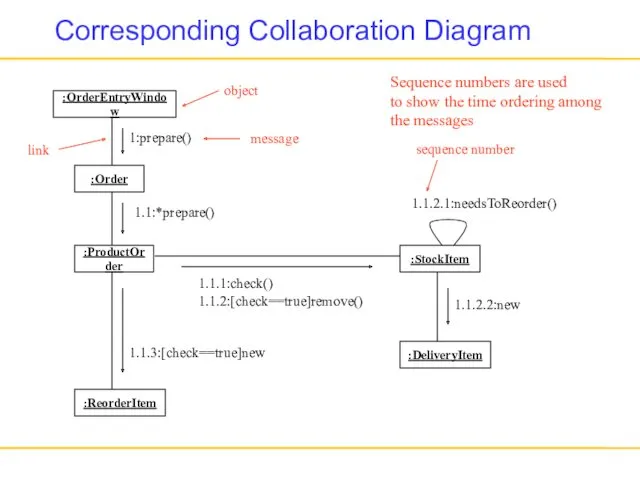
Corresponding Collaboration Diagram
:ProductOrder
:StockItem
:Order
:OrderEntryWindow
:ReorderItem
:DeliveryItem
1:prepare()
1.1:*prepare()
1.1.1:check()
1.1.2:[check==true]remove()
1.1.2.1:needsToReorder()
1.1.2.2:new
1.1.3:[check==true]new
message
object
link
sequence number
Sequence numbers are used
to show the time
State Diagrams (Statecharts a la UML)
State diagrams are used to show
State Diagrams (Statecharts a la UML)
State diagrams are used to show
State Diagrams
State diagrams are used to show possible states a single
State Diagrams
State diagrams are used to show possible states a single
State Diagrams
Hierarchical grouping of states
composite states are formed by grouping
State Diagrams
Hierarchical grouping of states
composite states are formed by grouping
State Diagrams: Transitions
Transitions consist of
source state and target states: shown by
State Diagrams: Transitions
Transitions consist of
source state and target states: shown by
State Diagrams: States
States are represented as rounded boxes which contain:
the state
State Diagrams: States
States are represented as rounded boxes which contain:
the state
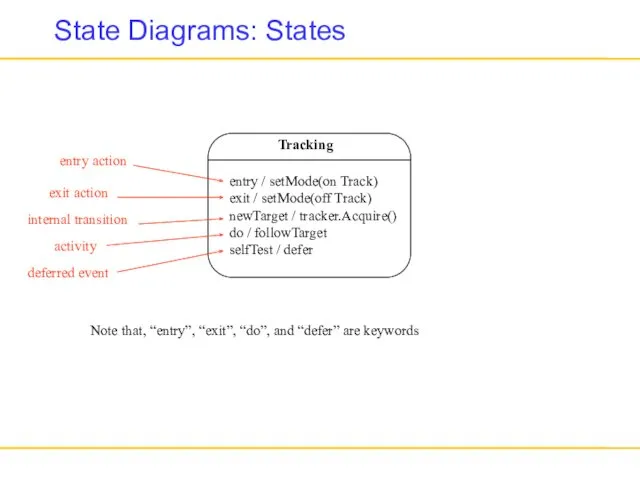
State Diagrams: States
Tracking
entry / setMode(on Track)
exit / setMode(off Track)
newTarget / tracker.Acquire()
do
State Diagrams: States
Tracking
entry / setMode(on Track)
exit / setMode(off Track)
newTarget / tracker.Acquire()
do
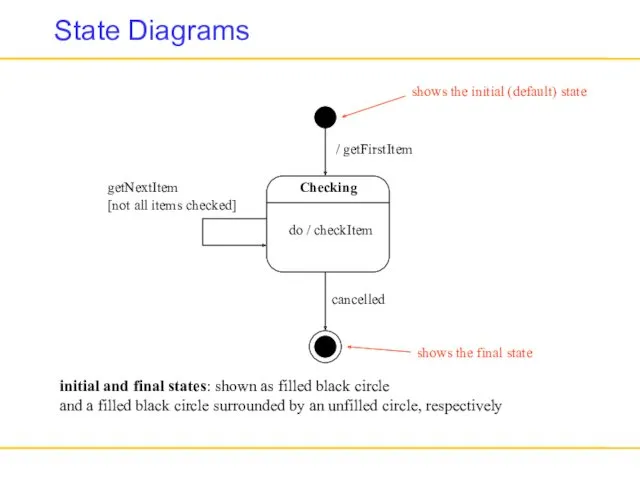
State Diagrams
Checking
do / checkItem
/ getFirstItem
shows the initial (default) state
cancelled
getNextItem
[not all items
State Diagrams
Checking
do / checkItem
/ getFirstItem
shows the initial (default) state
cancelled
getNextItem
[not all items
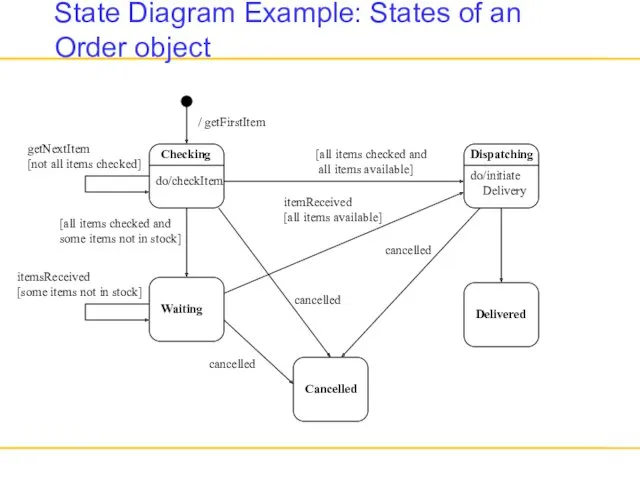
State Diagram Example: States of an Order object
Checking
do/checkItem
/ getFirstItem
getNextItem
[not all items
State Diagram Example: States of an Order object
Checking
do/checkItem
/ getFirstItem
getNextItem
[not all items
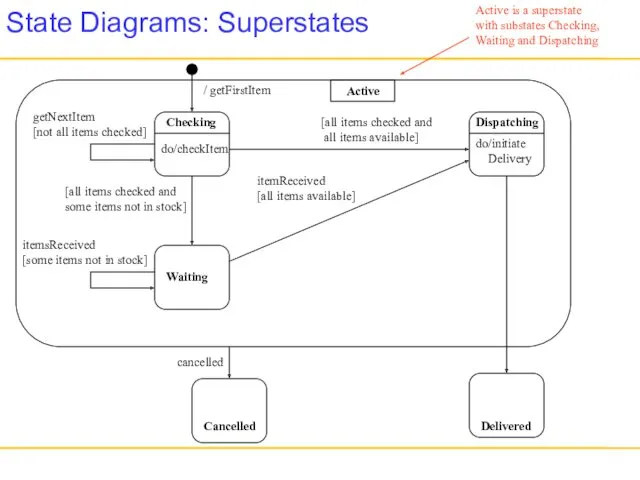
State Diagrams: Superstates
Checking
do/checkItem
/ getFirstItem
getNextItem
[not all items checked]
Dispatching
do/initiate
Delivery
Waiting
Cancelled
Delivered
itemsReceived
[some items not in
State Diagrams: Superstates
Checking
do/checkItem
/ getFirstItem
getNextItem
[not all items checked]
Dispatching
do/initiate
Delivery
Waiting
Cancelled
Delivered
itemsReceived
[some items not in
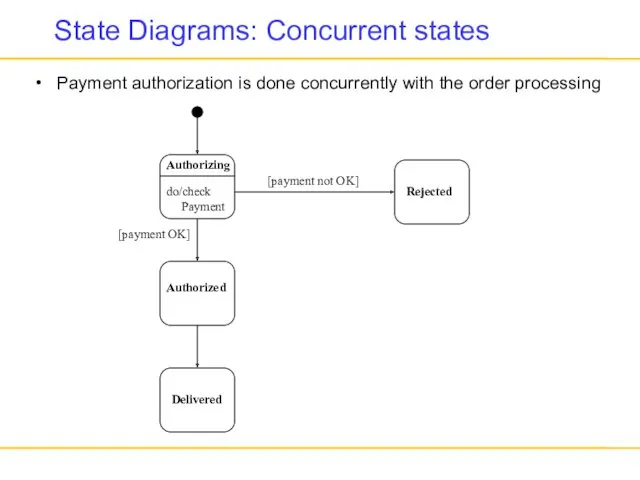
State Diagrams: Concurrent states
Payment authorization is done concurrently with the order
State Diagrams: Concurrent states
Payment authorization is done concurrently with the order
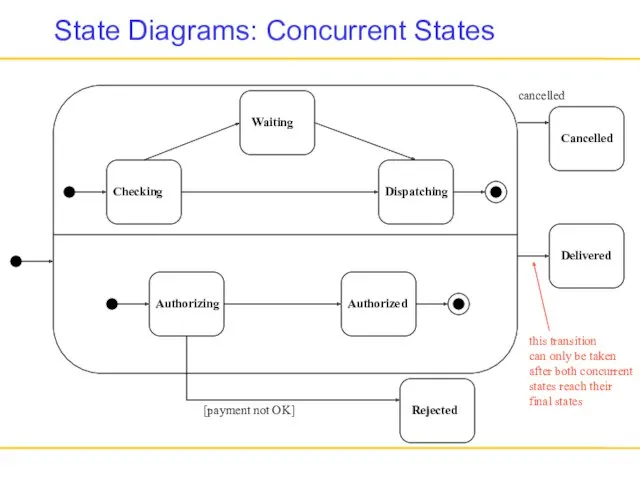
State Diagrams: Concurrent States
Checking
Dispatching
Waiting
Authorizing
Authorized
Delivered
Cancelled
Rejected
[payment not OK]
cancelled
this transition
can only be taken
after
State Diagrams: Concurrent States
Checking
Dispatching
Waiting
Authorizing
Authorized
Delivered
Cancelled
Rejected
[payment not OK]
cancelled
this transition
can only be taken
after
State Diagrams
Good at describing behavior of an object across several use-cases
Use
State Diagrams
Good at describing behavior of an object across several use-cases
Use
Activity Diagrams
Activity diagrams show the flow among activities and actions associated
Activity Diagrams
Activity diagrams show the flow among activities and actions associated
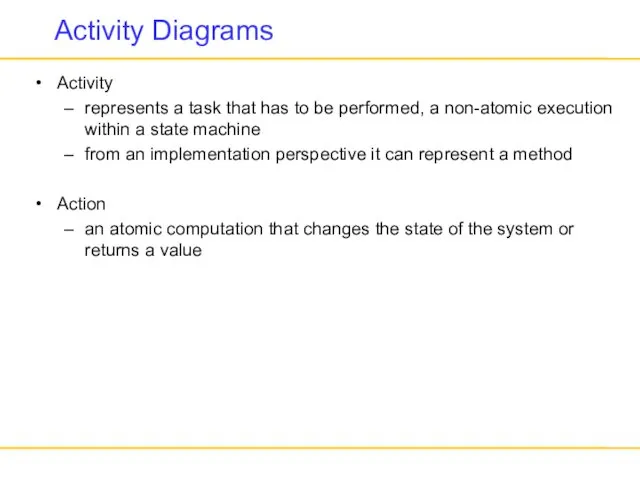
Activity Diagrams
Activity
represents a task that has to be performed, a non-atomic
Activity Diagrams
Activity
represents a task that has to be performed, a non-atomic
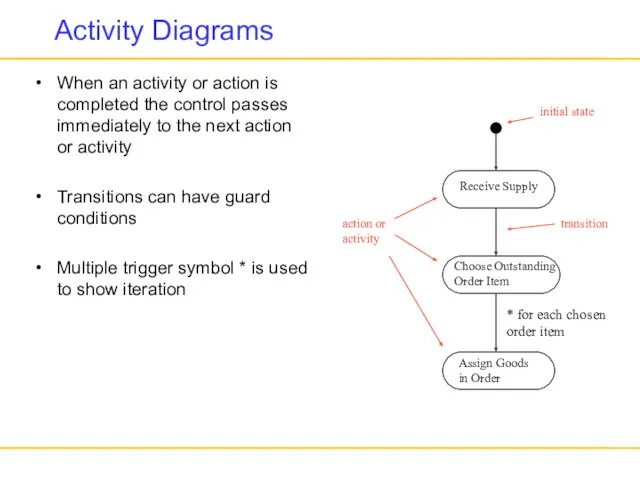
Activity Diagrams
When an activity or action is completed the control passes
Activity Diagrams
When an activity or action is completed the control passes
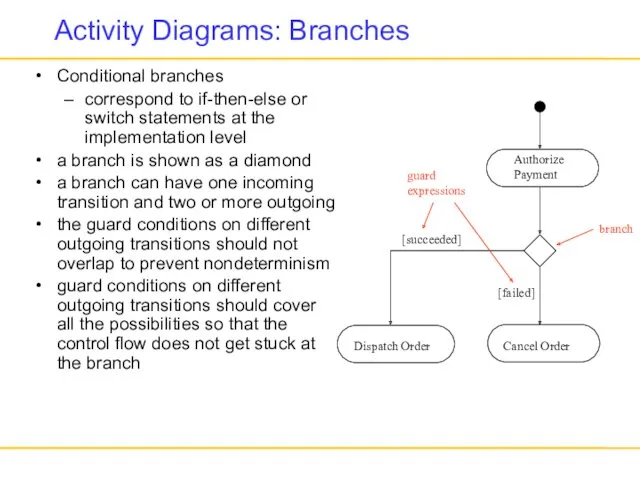
Activity Diagrams: Branches
Conditional branches
correspond to if-then-else or switch statements at the
Activity Diagrams: Branches
Conditional branches
correspond to if-then-else or switch statements at the
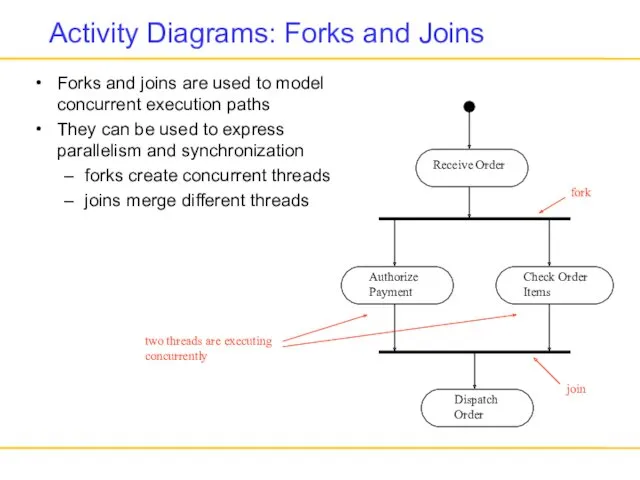
Activity Diagrams: Forks and Joins
Forks and joins are used to model
Activity Diagrams: Forks and Joins
Forks and joins are used to model
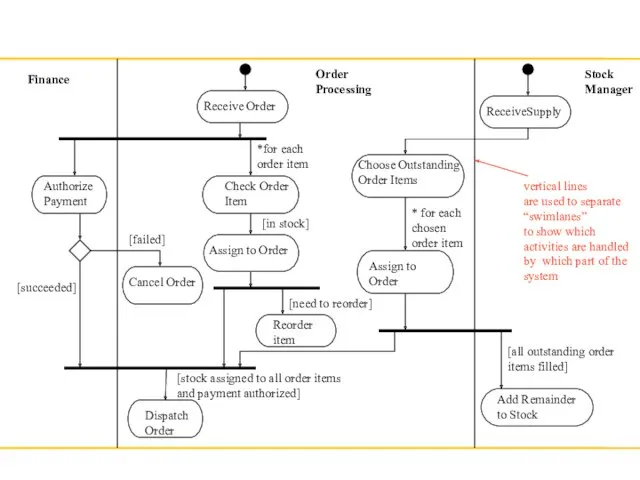
Receive Order
Check Order
Item
Dispatch
Order
Authorize Payment
Cancel Order
Add Remainder
to Stock
[succeeded]
[failed]
Assign to Order
ReceiveSupply
Choose Outstanding Order
Receive Order
Check Order
Item
Dispatch
Order
Authorize Payment
Cancel Order
Add Remainder
to Stock
[succeeded]
[failed]
Assign to Order
ReceiveSupply
Choose Outstanding Order
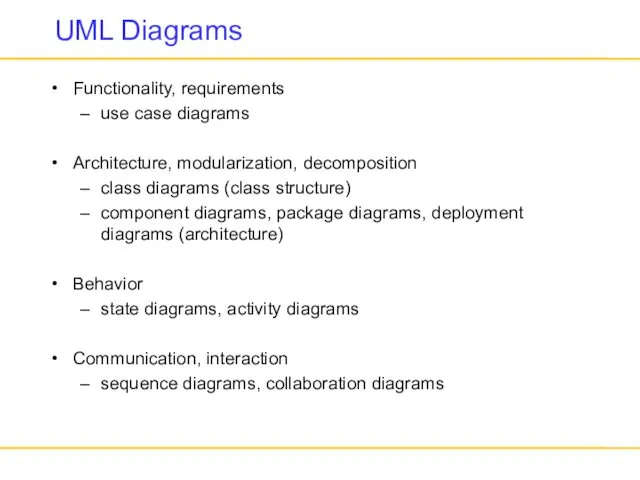
UML Diagrams
Functionality, requirements
use case diagrams
Architecture, modularization, decomposition
class diagrams (class structure)
component diagrams,
UML Diagrams
Functionality, requirements
use case diagrams
Architecture, modularization, decomposition
class diagrams (class structure)
component diagrams,
 Понятие и роль документационного обеспечения управления персоналом
 Программа рекомендаций. Referral program confidentia
 Стандарт управления проектами. Процессы управления проектом
 ВКР: Разработка прототипа информационной системы производственной логистики промышленного предприятия
 Современное делопроизводство. Документационное обеспечение управления
 Разработка мероприятий по развитию событийного туризма в Тульской области
 В поиске работы
 Управление человеческими ресурсами. Компетенция
 Организационная структура управления
 Диаграмма Парето
 Модели деловой карьеры
 Транспортно-экспедиционное обслуживание при международных автомобильных перевозках
 Использование процессного подхода как средства совершенствования системы управления организацией
 Модуль Управление персоналом (Нuman Resources). Управление организационными структурами
 Кейс-технологии
 Концепция Точно в срок
 Методологические основы менеджмента. Раздел 1
 Организация работы закусочной Блинная на 75 мест
 Zarządzanie agile
 Отчетная презентация СМС Санкт-Петербург-Балтийской дистанции пути за 3 квартал 2017 года
 Личность в системе управления
 Организационная структура управления проектом. Глава 4
 Управління якістю води у виробництві харчових продуктів. Лекції № 7-8
 Сущность и основные школы менеджмента
 Тема 2. Альтернативные логистические стратегии: проблема выбора
 Управление многоквартирным домом, управляющими организациями
 Баскет-метод
 Тайм-менджмент