- Strategic decision-making is an iterative process

Содержание
- 2. Strategic decision-making is an iterative process Financial ambition Dividend share of 40% Equity to asset ratio
- 3. Slowing down of housing price increases most common 08/06/2017
- 4. Large difference in size of Bonava’s regions 08/06/2017 Source: Data collections 0.4 Ostsee 1.2 Greater Gothenburg
- 5. All regions have positive population growth rate 08/06/2017 Note: For Sachsen and Köln/Bonn assumed provided figure
- 6. Differences in market risk parameters between our markets 08/06/2017 Denmark Norway Copenhagen Sweden Lithaunia Germany Finland
- 7. Backup: What is included in ease of doing business 08/06/2017 Ease of doing business Ranking by
- 8. Market attractiveness model weight together scores 08/06/2017 Market attractiveness ranking
- 9. Back up: Details of model 1. Market characteristic 4. Economic sentiment Factor Description Payment terms from
- 10. Sweden and Germany in top 08/06/2017 Ostsee Oulu St Petersburg Tampere Turku Linköping Köln/Bonn Stockholm county
- 11. Agreed current situation at EMG meeting 08/06/2017 Construction cost (cost/m2) Accumulated production volume in same platform
- 12. Market attractiveness – Data driven strategy process Strategic ideas Beyond 2020 What if the crisis comes
- 13. Beyond 2020 we should accelerate growth 08/06/2017 2016-2020 2021-2025 Mature all markets for future strength Establish
- 15. Скачать презентацию
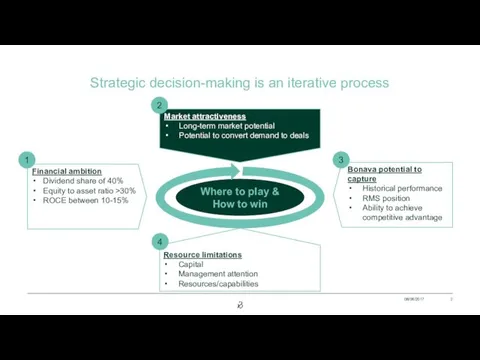
Strategic decision-making is an iterative process
Financial ambition
Dividend share of 40%
Equity to
Strategic decision-making is an iterative process
Financial ambition
Dividend share of 40%
Equity to
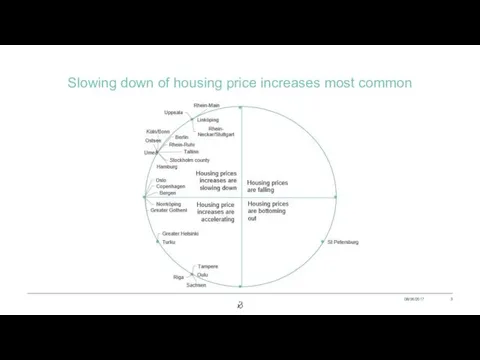
Slowing down of housing price increases most common
08/06/2017
Slowing down of housing price increases most common
08/06/2017
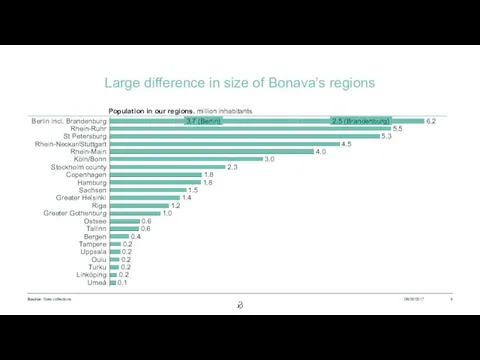
Large difference in size of Bonava’s regions
08/06/2017
Source: Data collections
0.4
Ostsee
1.2
Greater Gothenburg
0.6
Tallinn
0.6
2.3
1.8
Rhein-Main
3.0
Köln/Bonn
Copenhagen
Stockholm county
5.3
Rhein-Ruhr
4.0
Rhein-Neckar/Stuttgart
4.5
St
Large difference in size of Bonava’s regions
08/06/2017
Source: Data collections
0.4
Ostsee
1.2
Greater Gothenburg
0.6
Tallinn
0.6
2.3
1.8
Rhein-Main
3.0
Köln/Bonn
Copenhagen
Stockholm county
5.3
Rhein-Ruhr
4.0
Rhein-Neckar/Stuttgart
4.5
St
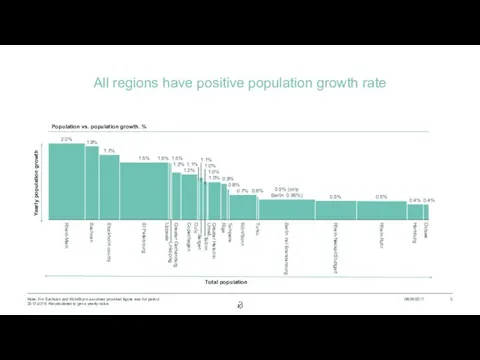
All regions have positive population growth rate
08/06/2017
Note: For Sachsen and Köln/Bonn
All regions have positive population growth rate
08/06/2017
Note: For Sachsen and Köln/Bonn
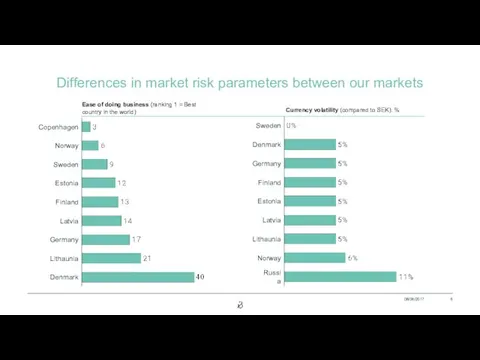
Differences in market risk parameters between our markets
08/06/2017
Denmark
Norway
Copenhagen
Sweden
Lithaunia
Germany
Finland
Estonia
Latvia
Lithaunia
Norway
Denmark
Estonia
Russia
Latvia
Sweden
Finland
Germany
Ease of doing business
Differences in market risk parameters between our markets
08/06/2017
Denmark
Norway
Copenhagen
Sweden
Lithaunia
Germany
Finland
Estonia
Latvia
Lithaunia
Norway
Denmark
Estonia
Russia
Latvia
Sweden
Finland
Germany
Ease of doing business
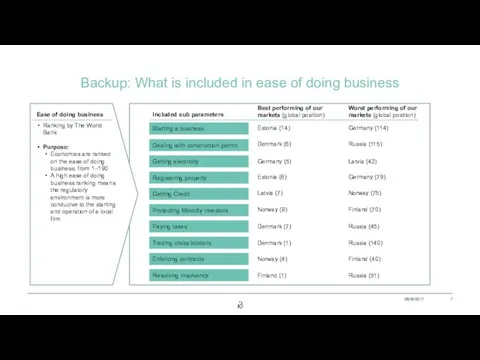
Backup: What is included in ease of doing business
08/06/2017
Ease of doing
Backup: What is included in ease of doing business
08/06/2017
Ease of doing
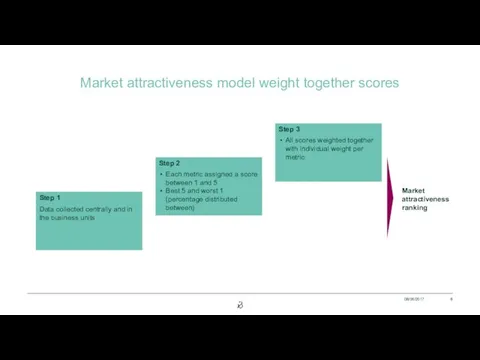
Market attractiveness model weight together scores
08/06/2017
Market attractiveness ranking
Market attractiveness model weight together scores
08/06/2017
Market attractiveness ranking
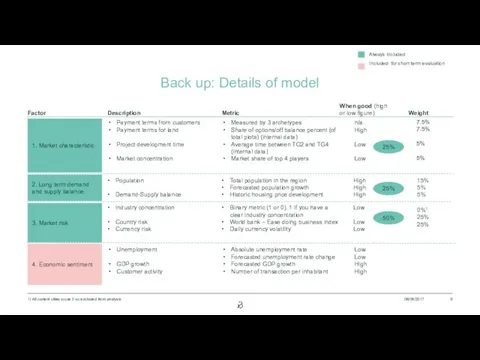
Back up: Details of model
1. Market characteristic
4. Economic sentiment
Factor
Description
Payment terms from
Back up: Details of model
1. Market characteristic
4. Economic sentiment
Factor
Description
Payment terms from
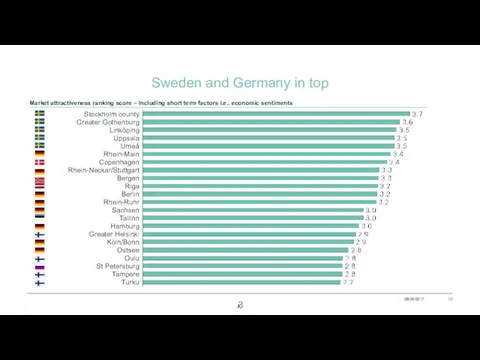
Sweden and Germany in top
08/06/2017
Ostsee
Oulu
St Petersburg
Tampere
Turku
Linköping
Köln/Bonn
Stockholm county
Greater Gothenburg
Greater Helsinki
Hamburg
Tallinn
Rhein-Neckar/Stuttgart
Bergen
Berlin
Rhein-Ruhr
Sachsen
Uppsala
Rhein-Main
Riga
Copenhagen
Umeå
Market attractiveness ranking
Sweden and Germany in top
08/06/2017
Ostsee
Oulu
St Petersburg
Tampere
Turku
Linköping
Köln/Bonn
Stockholm county
Greater Gothenburg
Greater Helsinki
Hamburg
Tallinn
Rhein-Neckar/Stuttgart
Bergen
Berlin
Rhein-Ruhr
Sachsen
Uppsala
Rhein-Main
Riga
Copenhagen
Umeå
Market attractiveness ranking
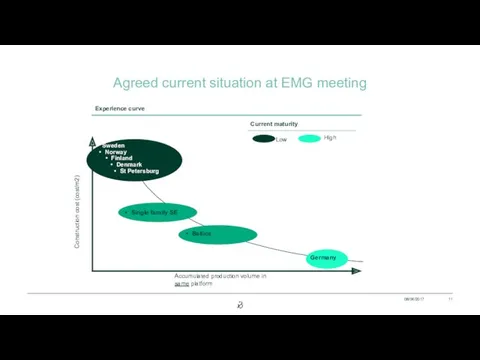
Agreed current situation at EMG meeting
08/06/2017
Construction cost (cost/m2)
Accumulated production volume in
Agreed current situation at EMG meeting
08/06/2017
Construction cost (cost/m2)
Accumulated production volume in
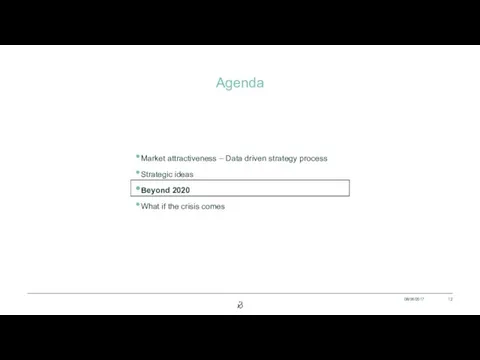
Market attractiveness – Data driven strategy process
Strategic ideas
Beyond 2020
What if the
Market attractiveness – Data driven strategy process
Strategic ideas
Beyond 2020
What if the
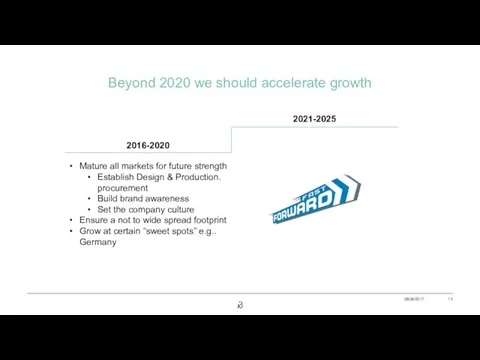
Beyond 2020 we should accelerate growth
08/06/2017
2016-2020
2021-2025
Mature all markets for future strength
Establish
Beyond 2020 we should accelerate growth
08/06/2017
2016-2020
2021-2025
Mature all markets for future strength
Establish
 Управление проектами: основные понятия
 Использование ПО при реализации процессного управления предприятием
 Стратегический менеджмент
 Содержание и специфика психологии управления
 Базові функції управління
 Організаційний механізм управління корпораціями в туристичному бізнесі
 Взаимодействие при повышении производственной эффективности
 Процесс принятия решения
 Памятка для операторов
 Управление персоналом
 Совершенствование механизма государственно-частного партнерства в области физической культуры и спорта
 Идеальный день начальника ОПС Салми
 Бизнес-план организации
 Варианты стратегии создания фитнес - клуба
 Кәсіпорынның құрылымы және оны жетілдіру жолдары
 Системный анализ в управлении
 Процеси управління стратегічними ресурсами будівельної компанії ТОВ БК Пролетар
 Что такое организация. Ее цели и миссия
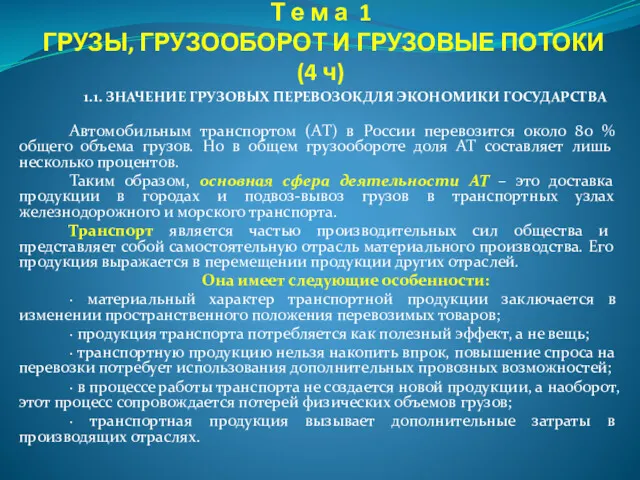 Грузы, грузооборот и грузовые перевозки
 Elements of a joint venture
 Содержание и оценка результатов исследования
 Маленькие хитрости большого бизнеса (2). Дружелюбное отношение руководства с сотрудниками в Макдональдс
 Механизм управления предприятием
 Теория усиления мотивации Скиннера
 Управление закупками и запасами
 Индивид в организации
 Мозговой штурм
 Региональный менеджер