- Wildfire hazard

Содержание
- 2. Assessing the wildfire hazard in Canada
- 3. Drought Code (fuel flamma-bility)
- 4. Buildup Index = Fuel availability August normals
- 5. Fire Weather Index
- 6. Fire Weather Index August normals
- 7. Rate of spread (fuel, wind, topo-graphy) August normals
- 8. Head Fire Intensity = energy output (how hard is it to suppress?)
- 9. Critical factors in wildfire hazard in coniferous forests: 1. antecedent precipitation dry fuel canopy interception wet
- 10. Critical factors in wildfire hazard in coniferous forests: 2. humidity of atmosphere fuel dries out RH
- 11. BC fire history (1996-2006) Data: http://www.bcwildfire.ca/History/average.htm
- 12. Lightning fires 2003 British Columbia: 2003 fire season Fire Danger: 25 Aug. 2003
- 13. Fires in BC and adjacent areas, Aug. 22, 2003 WA ID MO Kelowna AB
- 14. OK Mountain Park Fire Discovered: August 16 August 25: 19,400 hectares Notes: The fire was started
- 15. Direct damage: homes ablaze in Kelowna suburbs Indirect damage: particulates and human health Smoke in Okanagan
- 16. Recent major fires in BC Lonesome Lake fire (S. Tweedsmuir Park) (2004): 20,900 ha burned Salmon
- 17. Fire management in BC Risk assessment: >200 weather stations reporting on fire hazard; Entire province covered
- 18. Fire bombers: water vs. retardant Okanagan Mtn. Fire (Aug. 22, 2003) Retardants (a mix of salt,
- 19. Southern California wildfires (October, 2003) Causes: Persistent drought Santa Ana winds Volative native and exotic vegetation
- 20. Wildfire hazards: Sydney, December 2001
- 21. Wildfire hazards (all photos taken from Sydney Morning Herald, Dec. 2001) 1. Damage to forest economies
- 22. Homes in fire-prone areas building a fire-resistant home, and developing “defensible space” around the house There
- 23. A defensible site Slope: Flames traveling up a 30% slope are commonly twice as high, and
- 24. A defensible house Roofs may be ignited by firebrands; use fire-resistant materials and remove debris from
- 25. Fire and slope stability El Niño La Niña La Niña normal (1997-8) (1998-9) (summer 1999*) (winter
- 26. Other weather-related hazards Frost hollows Fog Hail Cold spells Blizzards Freezing rain
- 27. Frost and fog hollows outgoing LW on calm, clear nights in late fall to early spring
- 28. Frost hollows as crop hazards: Okanogan County, WA. fan in orchard
- 29. Braking distances increase by a factor of ~10 on black (glare) ice data from California Highway
- 30. Advection fog ocean
- 31. Advection fog bank, southern Oregon
- 32. Fog formation by advection, Pacific Northwest coast
- 33. Fog incidence
- 34. Fog and road accidents Feb. 12, 1996: 12 killed, 100 injured in a 300-vehicle pile-up in
- 35. Fog and aircraft safety Fog can cause flight delays, cancellations, and accidents. Some airports (e.g. SFO)
- 36. Hail incidence (days/year) Note differences between this map and that of thunderstorm distribution (severe storms lecture)
- 37. Hail formation Feeder clouds Supercell anvil -10°C embryo ice pellets form -50°C all droplets are solid
- 38. Hail formation: feeder clouds and double-vortex thunderstorm -50°C -10°C 0°C supercooled water droplets embryo hail rain
- 39. Hailstorms, west Texas Flooding as a result of hailstorms e.g. “Isaac’s Storm”
- 40. Hailstones and hail damage
- 41. Hail damage Severe incidents Denver, COL -- US$625M insurance costs for damage from large hail (July
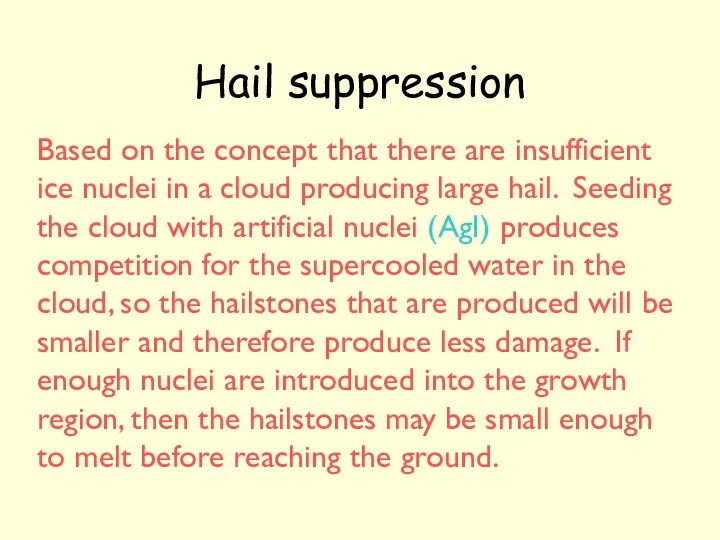
- 42. Hail suppression Based on the concept that there are insufficient ice nuclei in a cloud producing
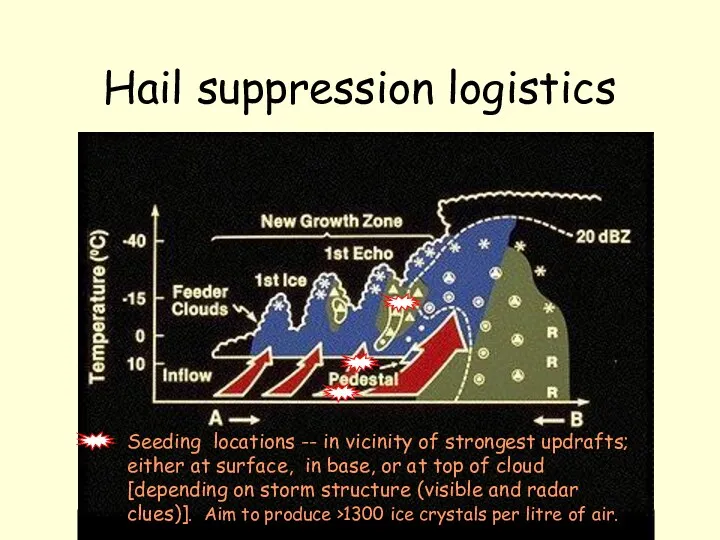
- 43. Hail suppression logistics Seeding locations -- in vicinity of strongest updrafts; either at surface, in base,
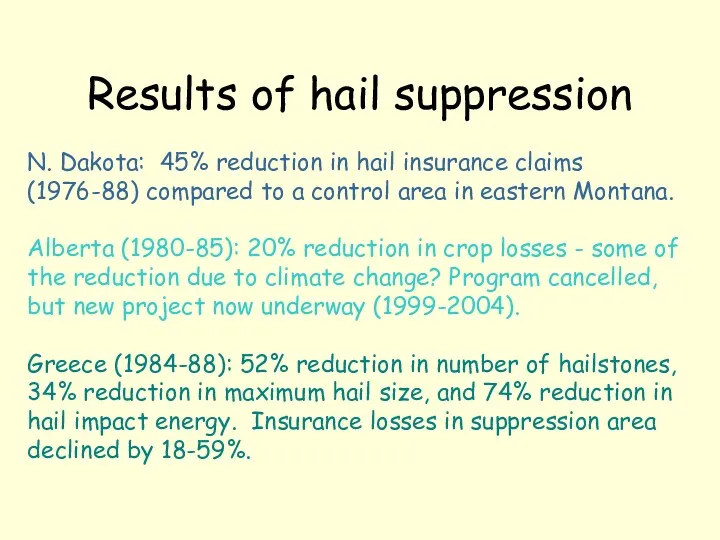
- 44. Results of hail suppression N. Dakota: 45% reduction in hail insurance claims (1976-88) compared to a
- 45. Winter hazards Thermal: human discomfort and disease heating costs (10% of Swedish GNP!) damage to crops,
- 46. Frost hazards 180 d >6 months w/ frost
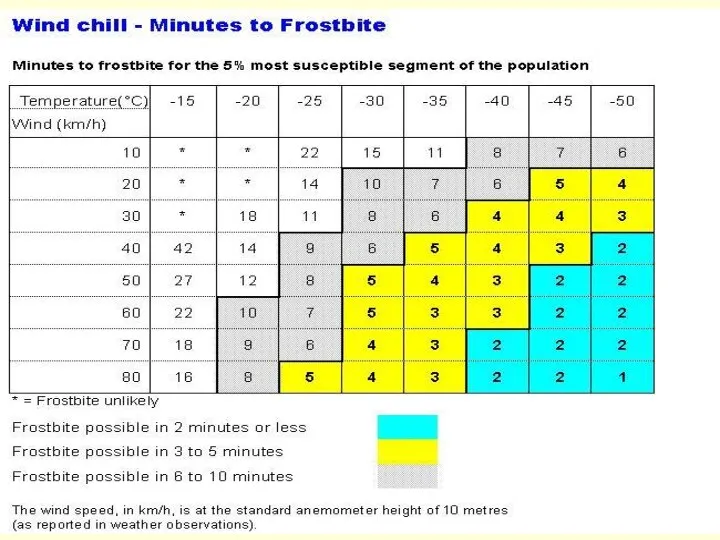
- 47. Hypothermia Cold exposure results in vascorestriction of blood vessels, restricting flow of blood to skin. When
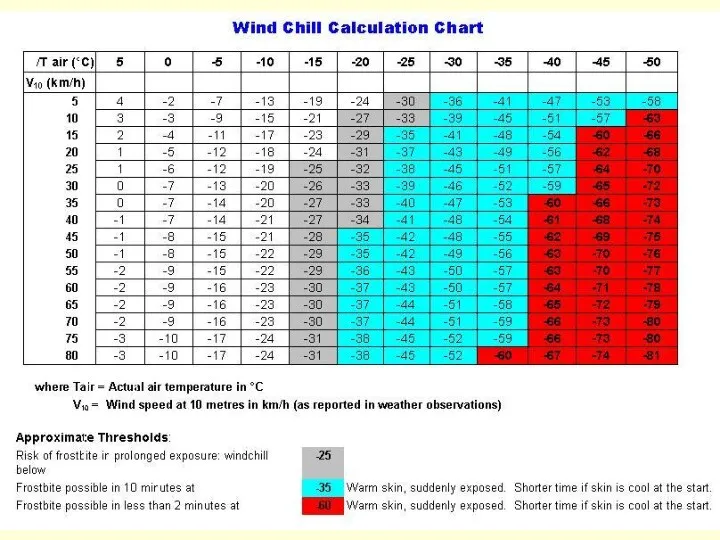
- 48. Wind chill factor Until 2001, the Siple-Passel formula was used in North America to calculate wind
- 49. New wind chill equation In 2001 Environment Canada and the US National Weather Service adopted a
- 52. Winter hazards: property damage e.g. State Farm Insurance paid out $4M in house freeze-up claims for
- 53. Orographic Orographic Frontal
- 54. “Snow belts”
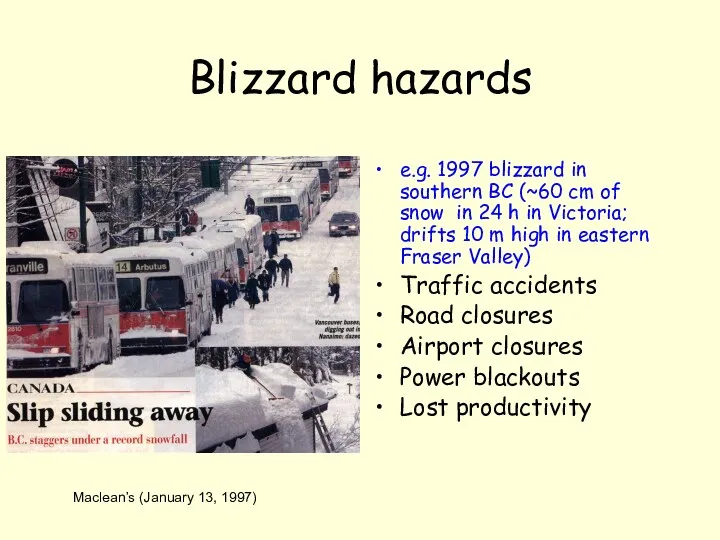
- 55. Blizzard hazards e.g. 1997 blizzard in southern BC (~60 cm of snow in 24 h in
- 56. Costs of snow - Surrey, BC
- 57. Snow-clearing costs I City Snowfall Roads Sidewalks Cost ($M) (cm) (km) (km) 1993 *costs $300K/cm of
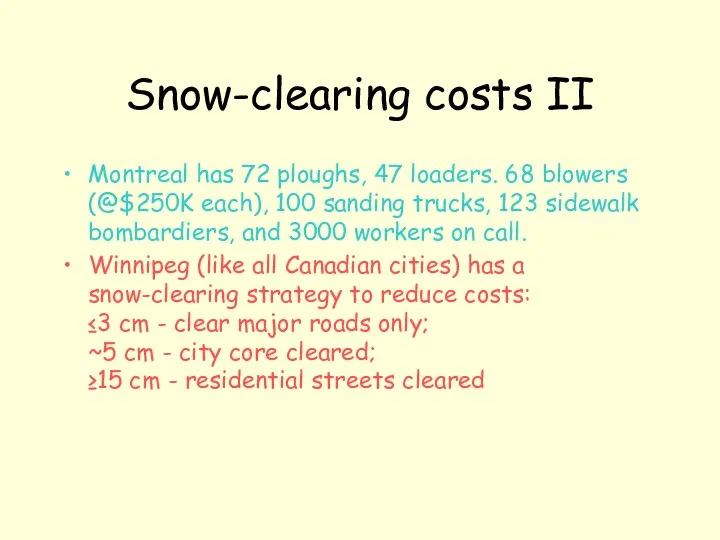
- 58. Snow-clearing costs II Montreal has 72 ploughs, 47 loaders. 68 blowers (@$250K each), 100 sanding trucks,
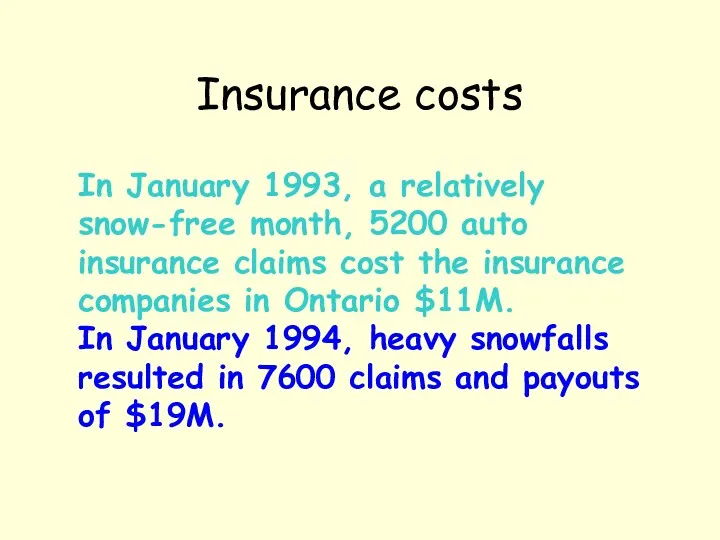
- 59. Insurance costs In January 1993, a relatively snow-free month, 5200 auto insurance claims cost the insurance
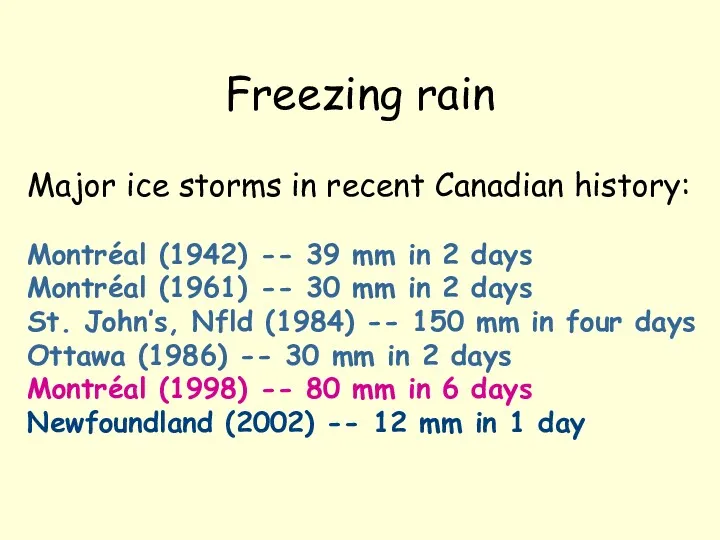
- 60. Freezing rain Major ice storms in recent Canadian history: Montréal (1942) -- 39 mm in 2
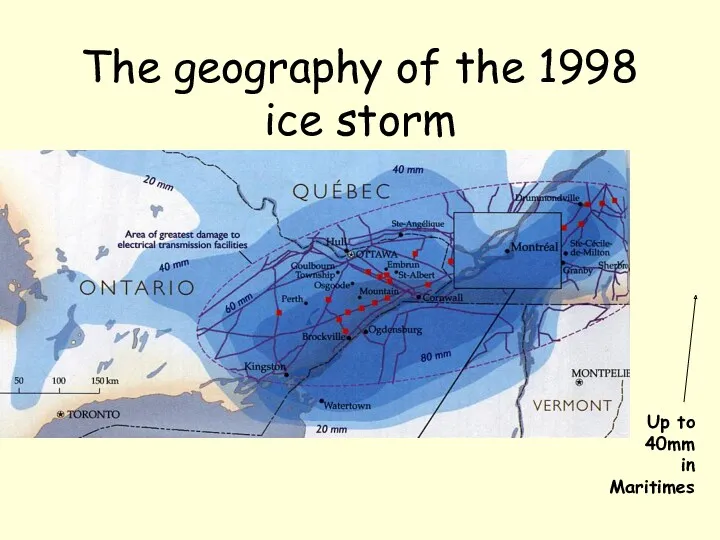
- 61. The geography of the 1998 ice storm Up to 40mm in Maritimes
- 62. The 1998 ice storm: >1300 hydro towers and 40,000 hydro poles damaged
- 63. Ice storm climatology mT cA rain freezes on contact N S -20° 0° 20° -40° mT
- 64. The 1998 ice storm # of customers without power CANADA Qué: 1.4M Ont: 230K New Bruns:
- 66. Скачать презентацию
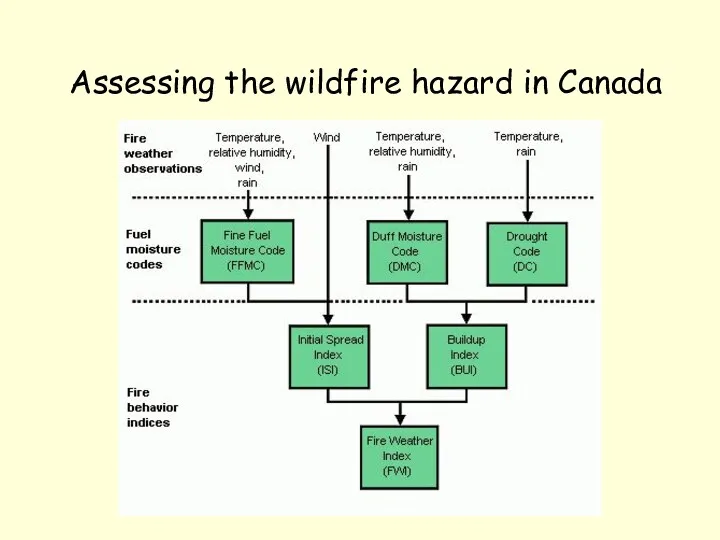
Assessing the wildfire hazard in Canada
Assessing the wildfire hazard in Canada
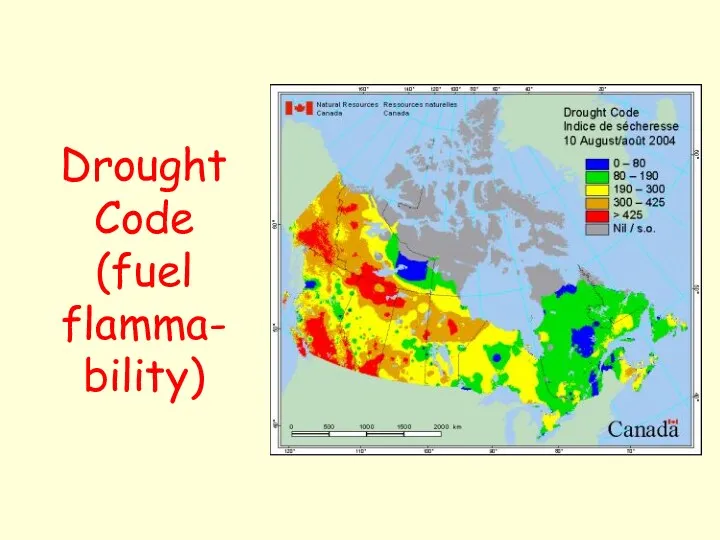
Drought Code (fuel flamma-bility)
Drought Code (fuel flamma-bility)
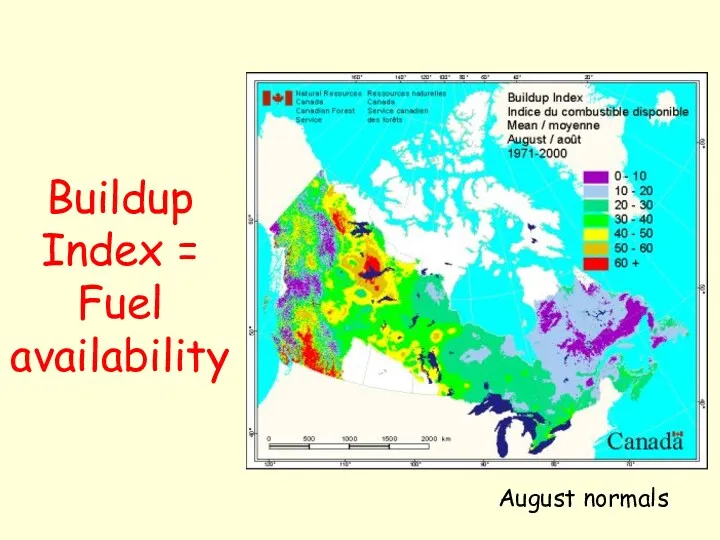
Buildup Index = Fuel availability
August normals
Buildup Index = Fuel availability
August normals
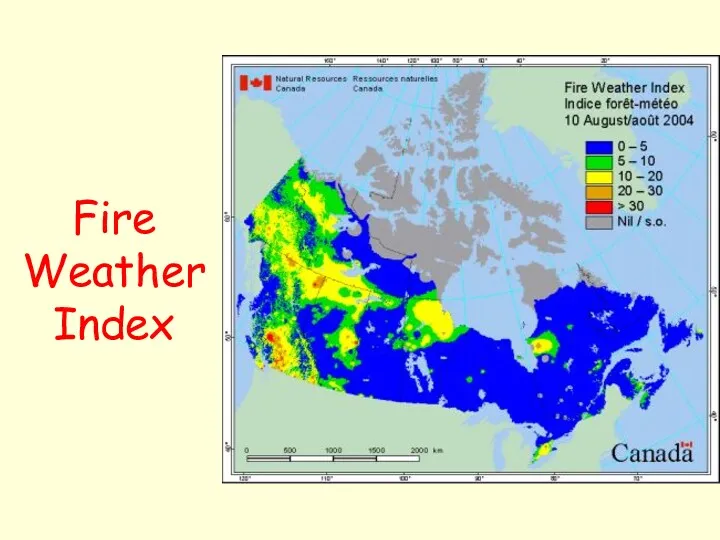
Fire Weather Index
Fire Weather Index
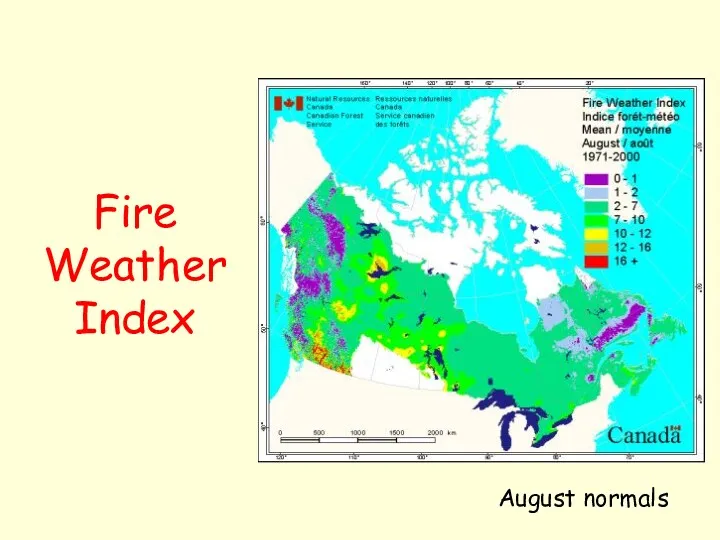
Fire Weather Index
August normals
Fire Weather Index
August normals
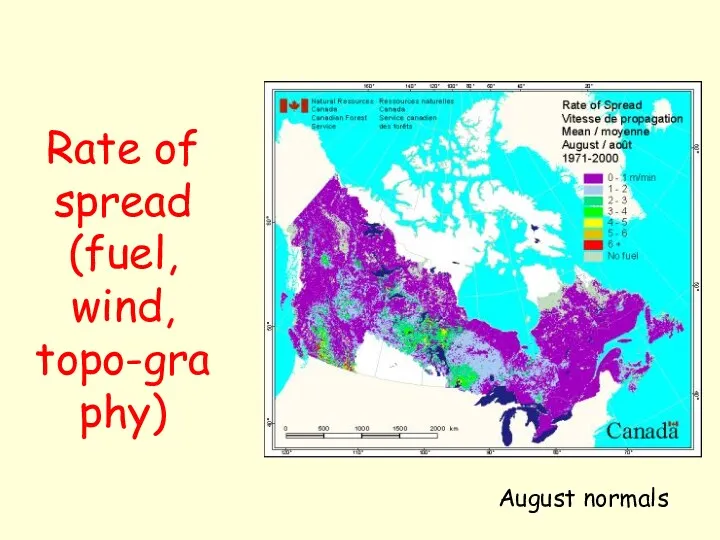
Rate of spread (fuel, wind, topo-graphy)
August normals
Rate of spread (fuel, wind, topo-graphy)
August normals
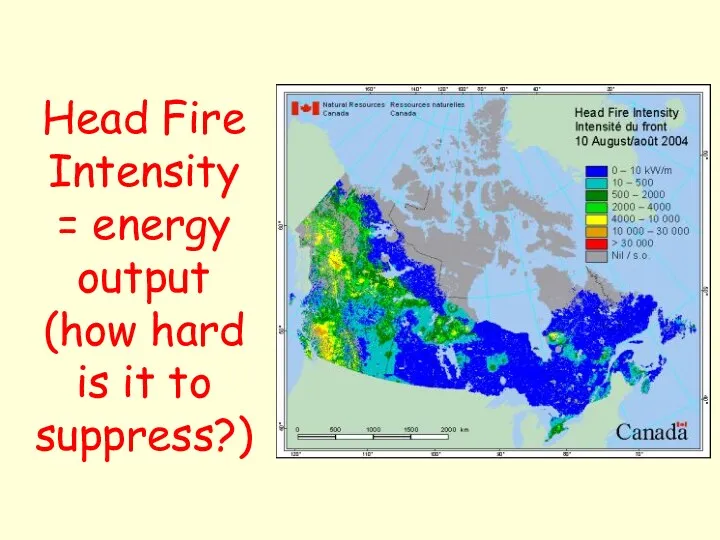
Head Fire Intensity = energy output (how hard is it to
Head Fire Intensity = energy output (how hard is it to
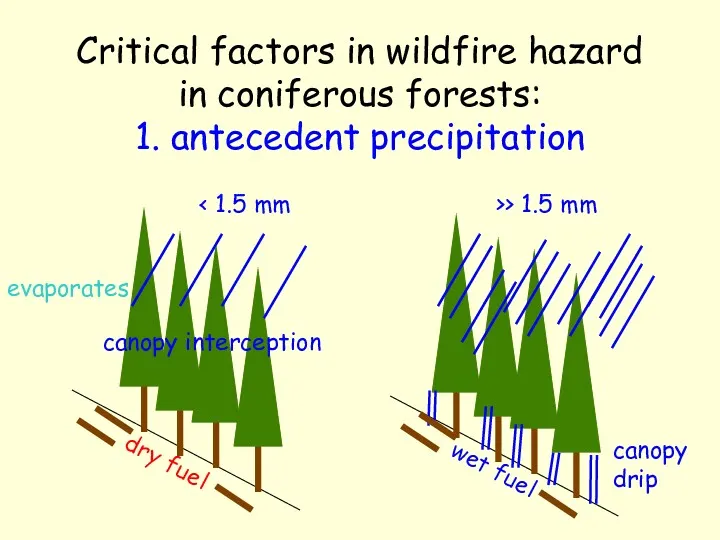
Critical factors in wildfire hazard in coniferous forests:
1. antecedent precipitation
dry
Critical factors in wildfire hazard in coniferous forests:
1. antecedent precipitation
dry
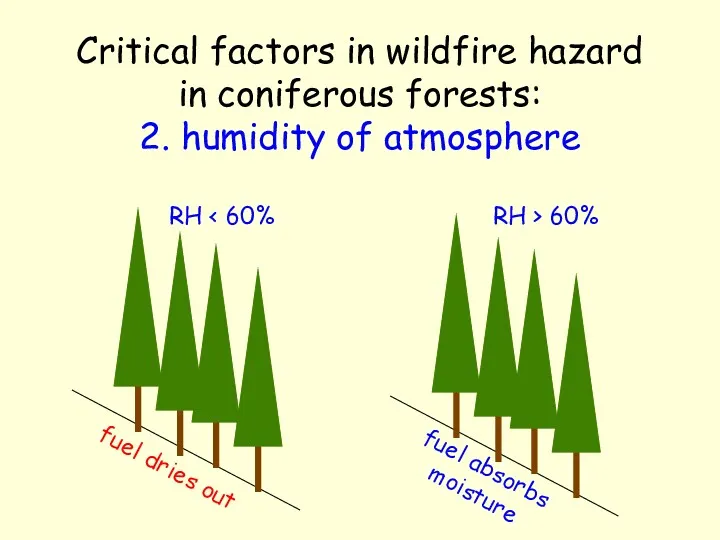
Critical factors in wildfire hazard in coniferous forests:
2. humidity of
Critical factors in wildfire hazard in coniferous forests: 2. humidity of
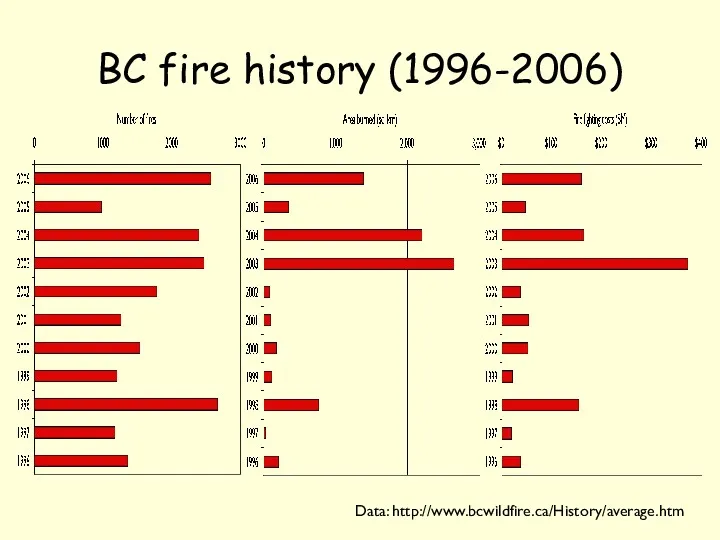
BC fire history (1996-2006)
Data: http://www.bcwildfire.ca/History/average.htm
BC fire history (1996-2006)
Data: http://www.bcwildfire.ca/History/average.htm
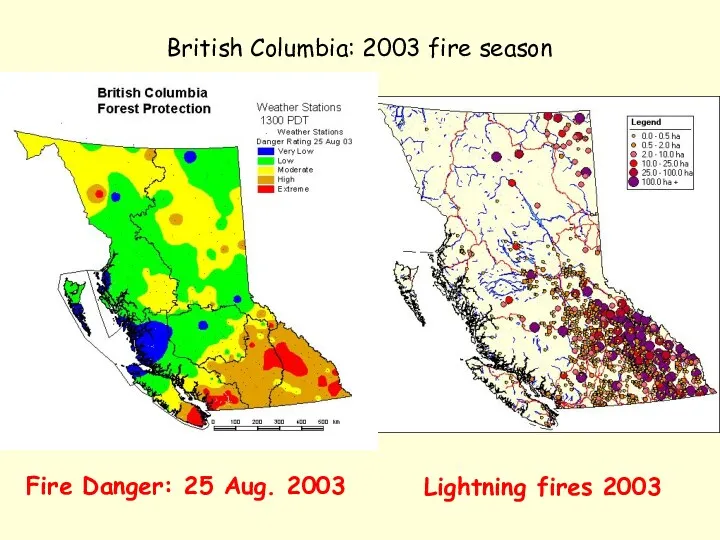
Lightning fires 2003
British Columbia: 2003 fire season
Fire Danger: 25 Aug. 2003
Lightning fires 2003
British Columbia: 2003 fire season
Fire Danger: 25 Aug. 2003
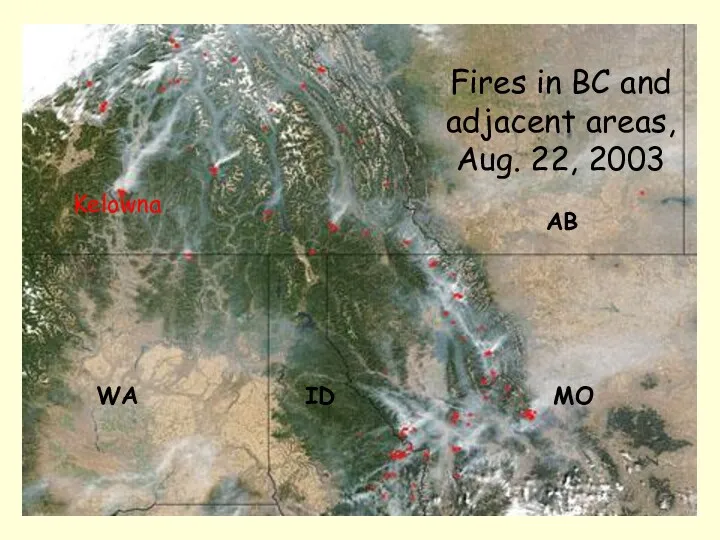
Fires in BC and adjacent areas, Aug. 22, 2003
WA ID MO
Kelowna
AB
Fires in BC and adjacent areas, Aug. 22, 2003
WA ID MO
Kelowna
AB
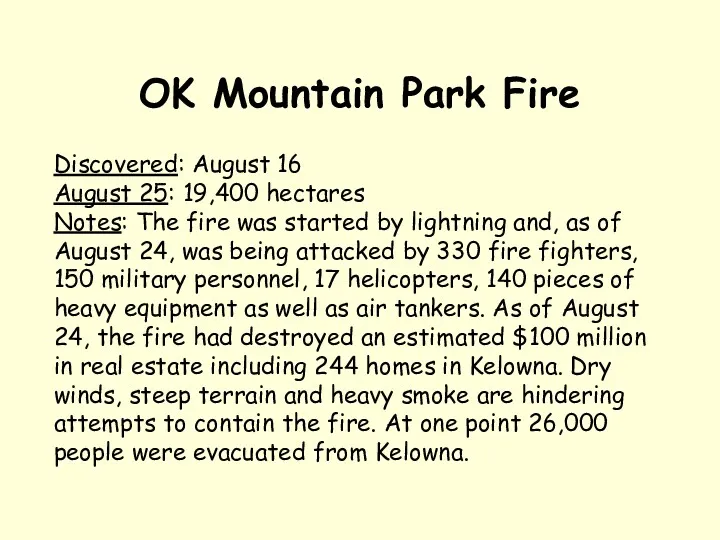
OK Mountain Park Fire
Discovered: August 16
August 25: 19,400 hectares
Notes:
OK Mountain Park Fire
Discovered: August 16
August 25: 19,400 hectares
Notes:
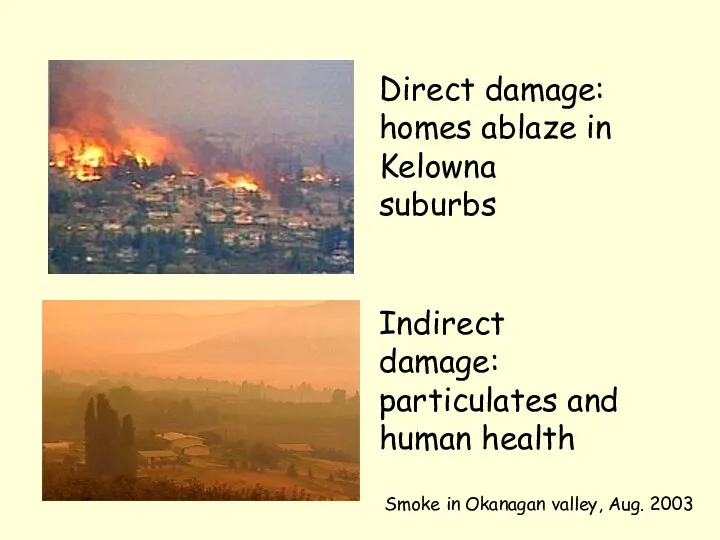
Direct damage: homes ablaze in Kelowna suburbs
Indirect damage: particulates and human
Direct damage: homes ablaze in Kelowna suburbs
Indirect damage: particulates and human
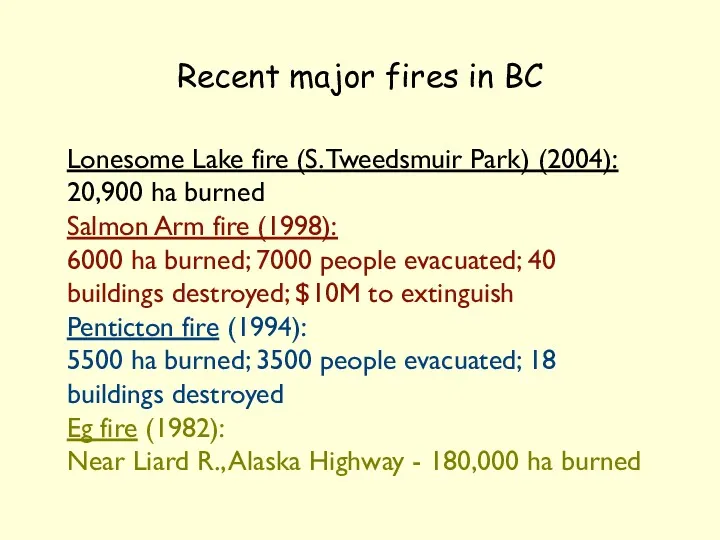
Recent major fires in BC
Lonesome Lake fire (S. Tweedsmuir Park) (2004):
20,900
Recent major fires in BC
Lonesome Lake fire (S. Tweedsmuir Park) (2004):
20,900
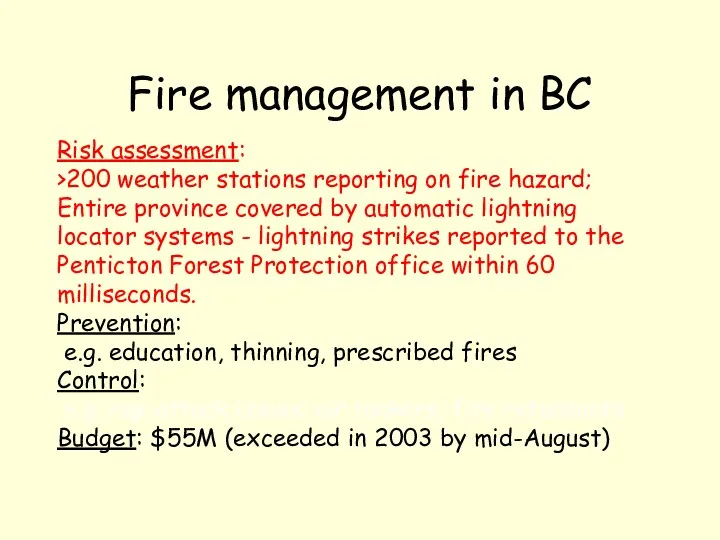
Fire management in BC
Risk assessment:
>200 weather stations reporting on fire hazard;
Entire
Fire management in BC
Risk assessment:
>200 weather stations reporting on fire hazard;
Entire
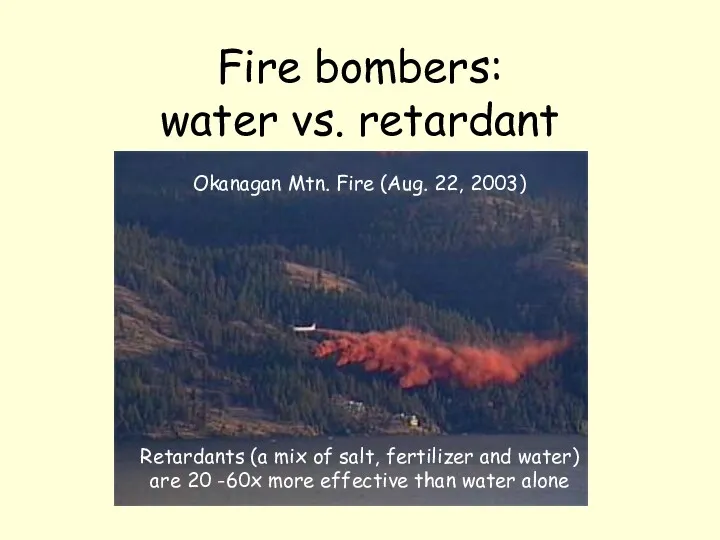
Fire bombers:
water vs. retardant
Okanagan Mtn. Fire (Aug. 22, 2003)
Retardants (a
Fire bombers:
water vs. retardant
Okanagan Mtn. Fire (Aug. 22, 2003)
Retardants (a
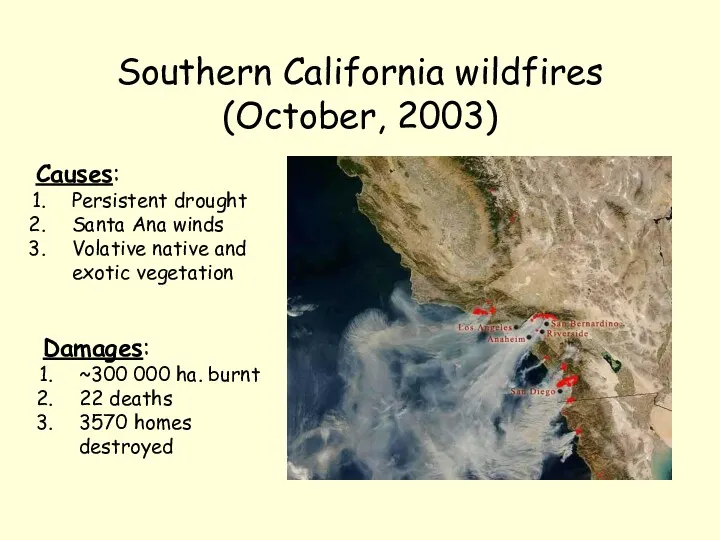
Southern California wildfires (October, 2003)
Causes:
Persistent drought
Santa Ana winds
Volative native and exotic
Southern California wildfires (October, 2003)
Causes:
Persistent drought
Santa Ana winds
Volative native and exotic
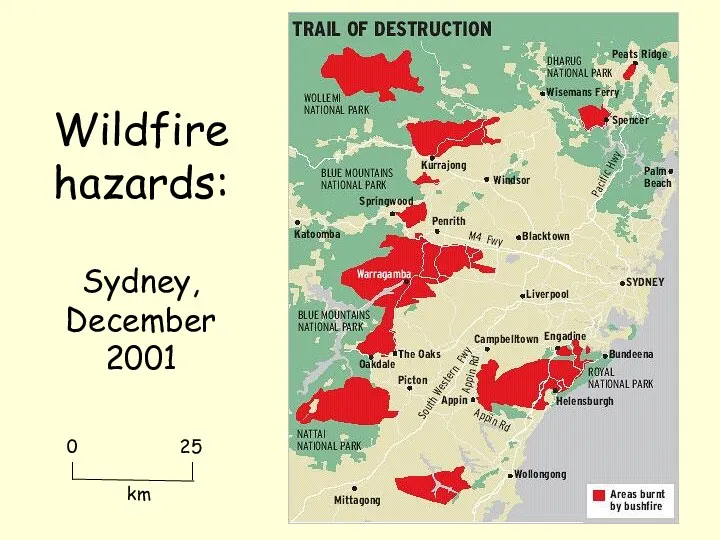
Wildfire hazards:
Sydney, December 2001
Wildfire hazards:
Sydney, December 2001
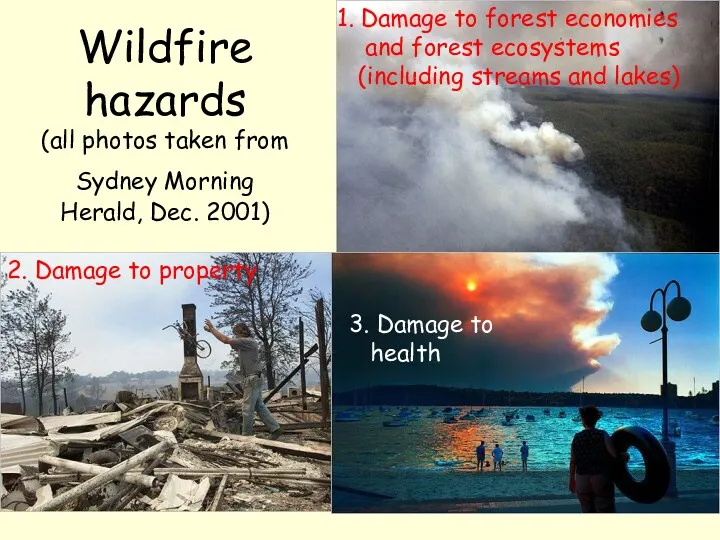
Wildfire hazards
(all photos taken from Sydney Morning Herald, Dec. 2001)
1.
Wildfire hazards
(all photos taken from Sydney Morning Herald, Dec. 2001)
1.
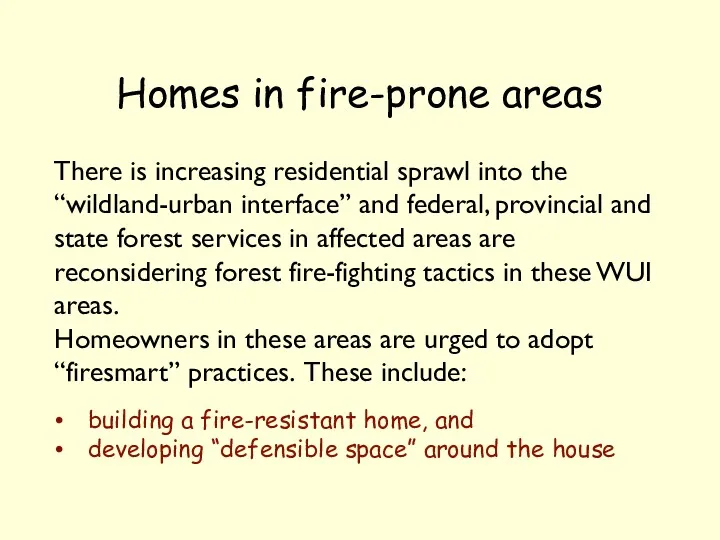
Homes in fire-prone areas
building a fire-resistant home, and
developing “defensible space” around
Homes in fire-prone areas
building a fire-resistant home, and
developing “defensible space” around
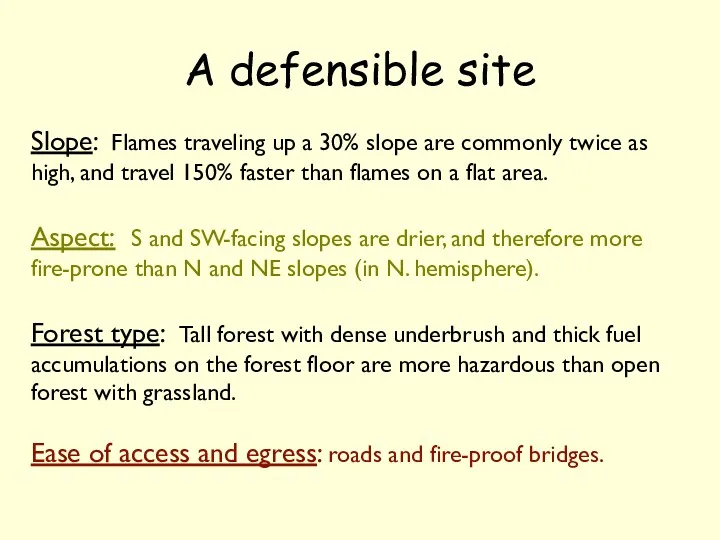
A defensible site
Slope: Flames traveling up a 30% slope are
A defensible site
Slope: Flames traveling up a 30% slope are
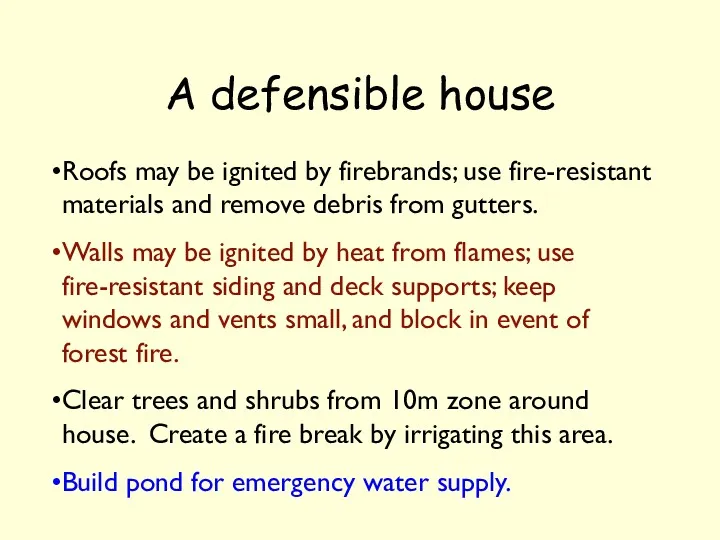
A defensible house
Roofs may be ignited by firebrands; use fire-resistant materials
A defensible house
Roofs may be ignited by firebrands; use fire-resistant materials
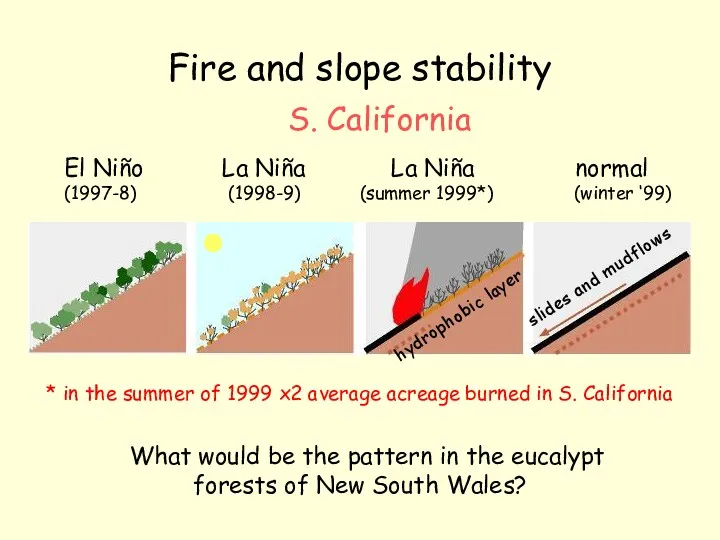
Fire and slope stability
El Niño La Niña La Niña normal
Fire and slope stability
El Niño La Niña La Niña normal
Other weather-related hazards
Frost hollows
Fog
Hail
Cold spells
Blizzards
Freezing rain
Other weather-related hazards
Frost hollows
Fog
Hail
Cold spells
Blizzards
Freezing rain
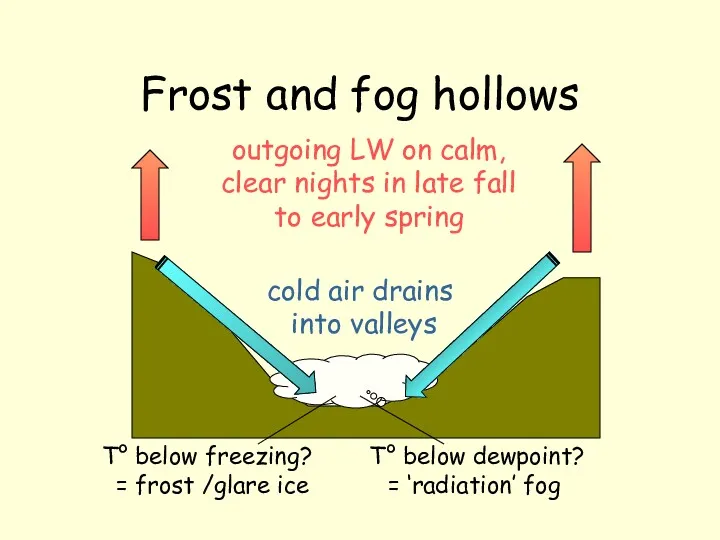
Frost and fog hollows
outgoing LW on calm, clear nights in late
Frost and fog hollows
outgoing LW on calm, clear nights in late
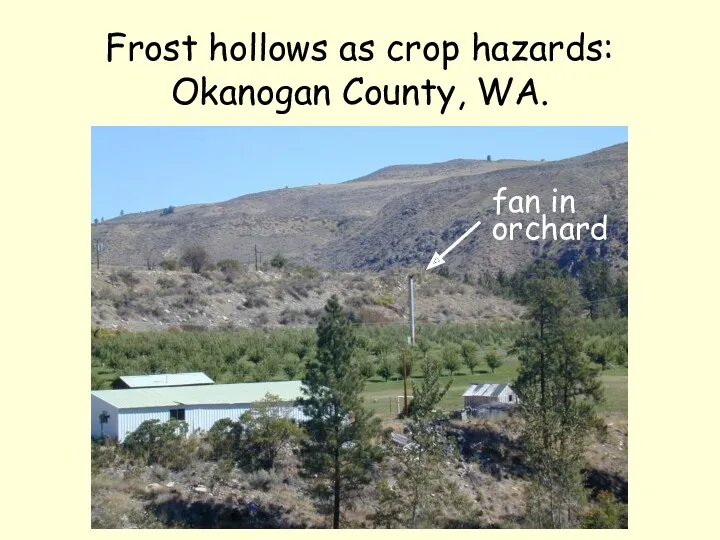
Frost hollows as crop hazards:
Okanogan County, WA.
fan in
orchard
Frost hollows as crop hazards:
Okanogan County, WA.
fan in
orchard
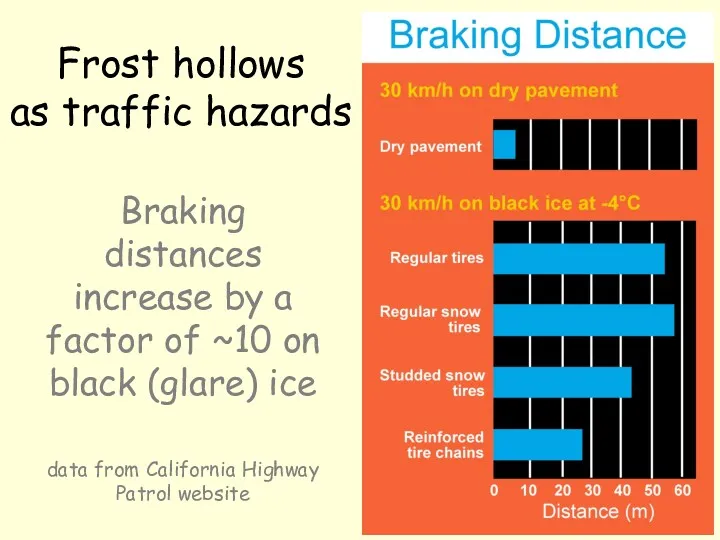
Braking distances increase by a factor of ~10 on black (glare)
Braking distances increase by a factor of ~10 on black (glare)
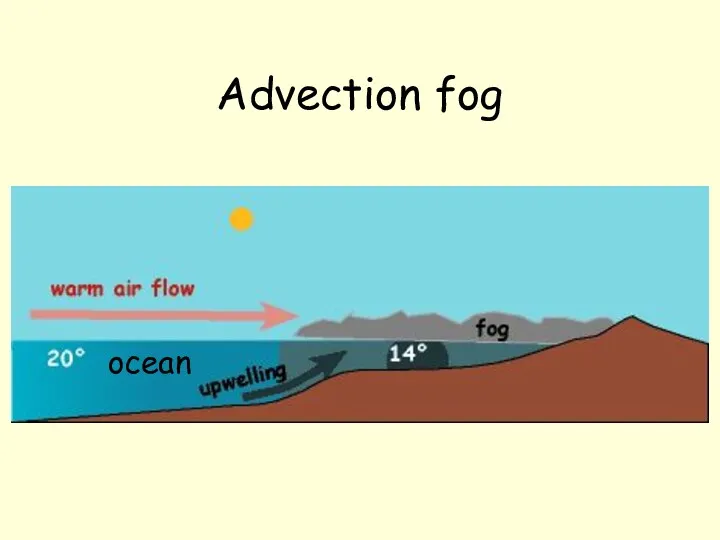
Advection fog
ocean
Advection fog
ocean
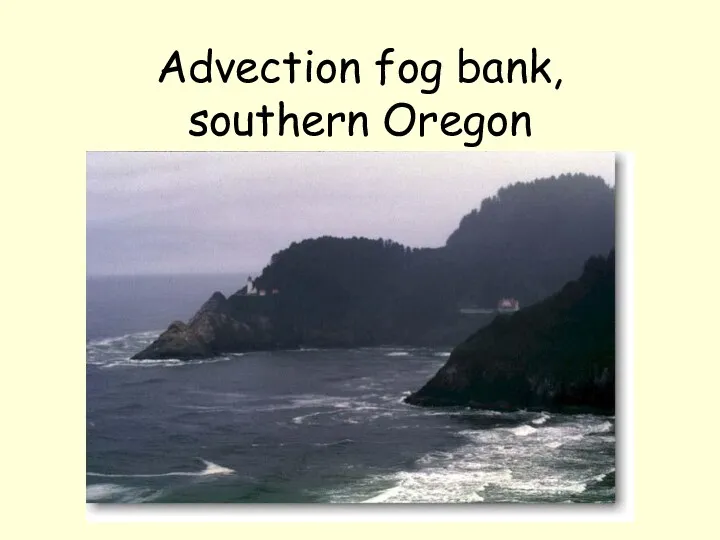
Advection fog bank, southern Oregon
Advection fog bank, southern Oregon
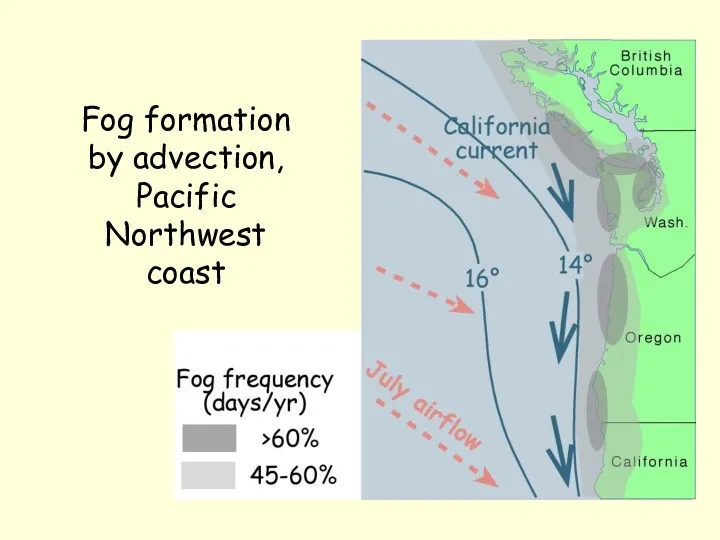
Fog formation by advection,
Pacific Northwest coast
Fog formation by advection,
Pacific Northwest coast
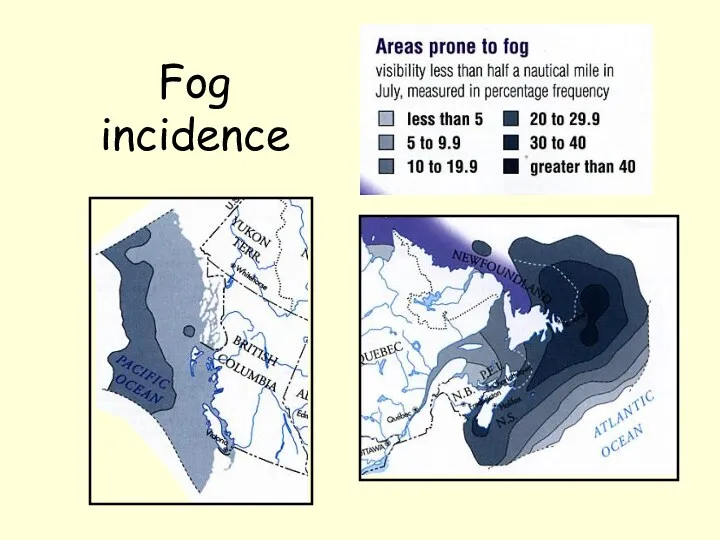
Fog incidence
Fog incidence
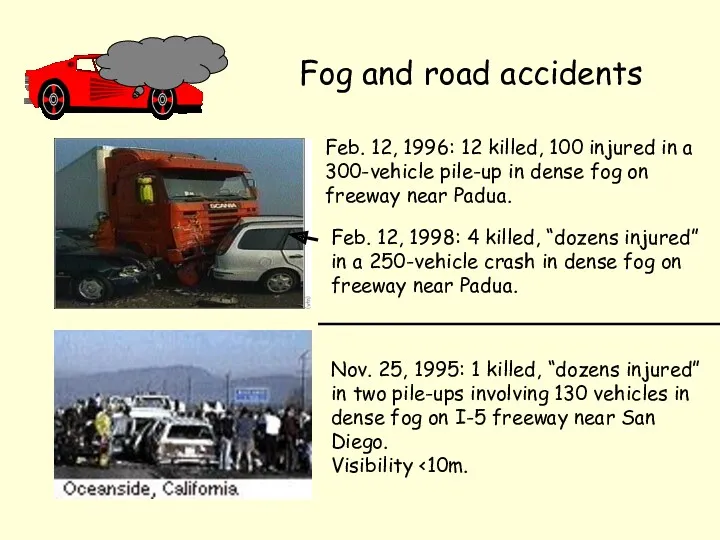
Fog and road accidents
Feb. 12, 1996: 12 killed, 100 injured in
Fog and road accidents
Feb. 12, 1996: 12 killed, 100 injured in
Fog and aircraft safety
Fog can cause flight delays, cancellations, and accidents.
Fog and aircraft safety
Fog can cause flight delays, cancellations, and accidents.
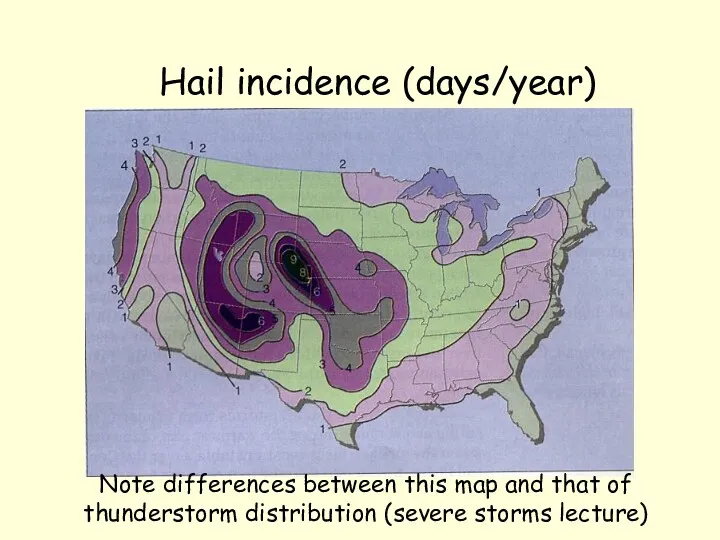
Hail incidence (days/year)
Note differences between this map and that of thunderstorm
Hail incidence (days/year)
Note differences between this map and that of thunderstorm
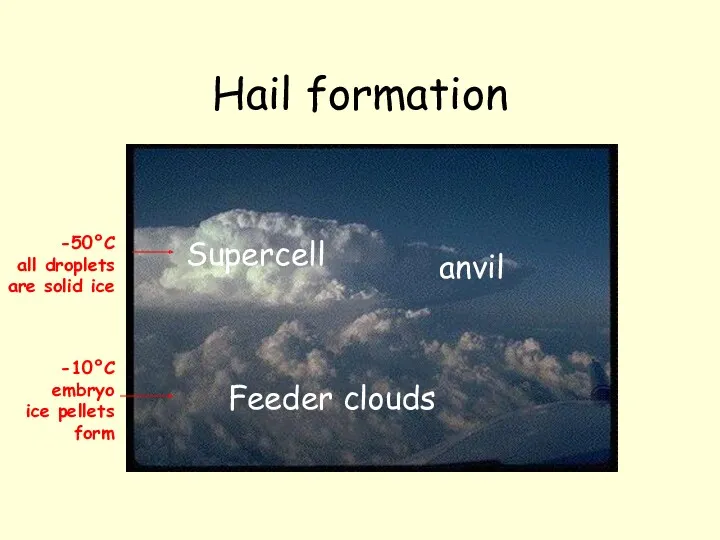
Hail formation
Feeder clouds
Supercell
anvil
-10°C
embryo
ice pellets
form
-50°C
all droplets
are solid ice
Hail formation
Feeder clouds
Supercell
anvil
-10°C
embryo
ice pellets
form
-50°C
all droplets
are solid ice
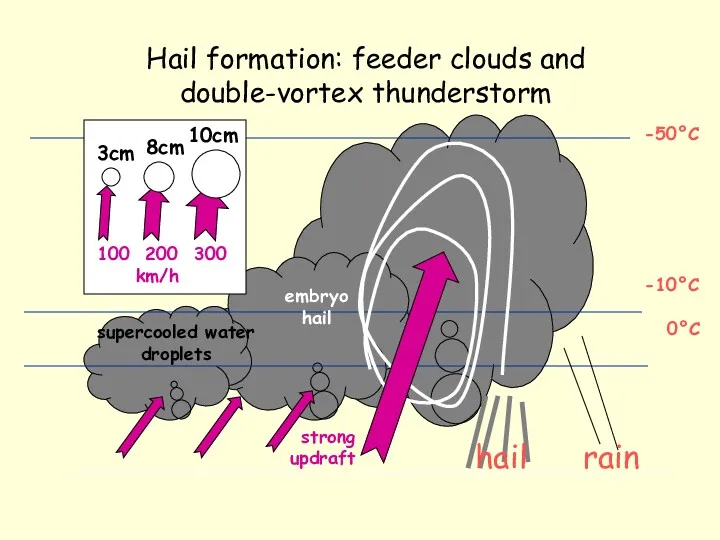
Hail formation: feeder clouds and double-vortex thunderstorm
-50°C
-10°C
0°C
supercooled water
droplets
embryo
hail
rain
hail
strong
updraft
Hail formation: feeder clouds and double-vortex thunderstorm
-50°C
-10°C
0°C
supercooled water
droplets
embryo
hail
rain
hail
strong
updraft
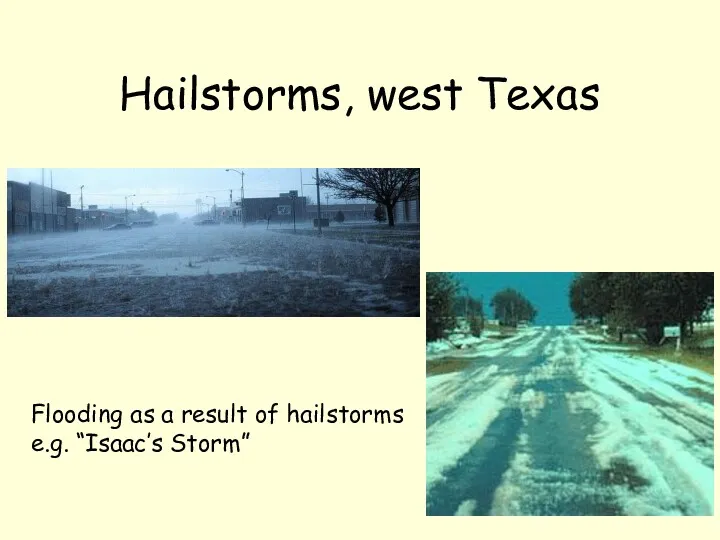
Hailstorms, west Texas
Flooding as a result of hailstorms
e.g. “Isaac’s Storm”
Hailstorms, west Texas
Flooding as a result of hailstorms
e.g. “Isaac’s Storm”
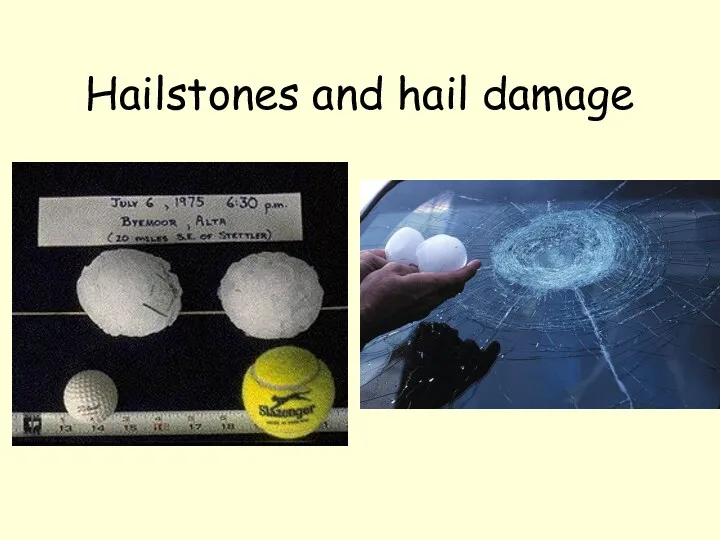
Hailstones and hail damage
Hailstones and hail damage
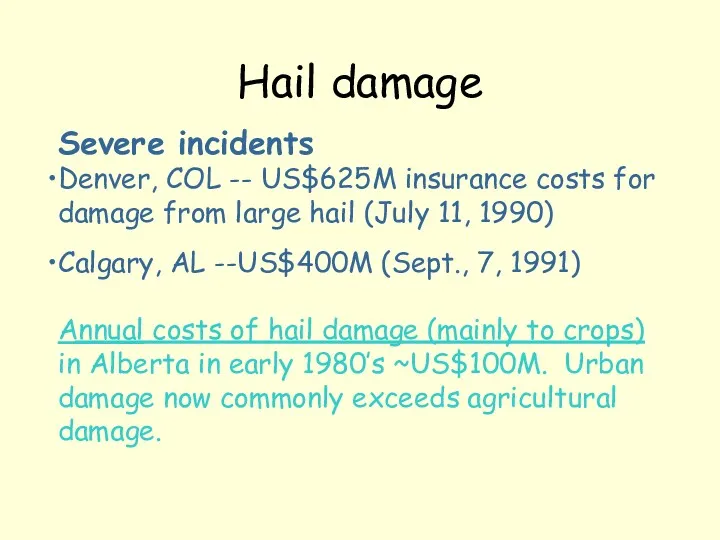
Hail damage
Severe incidents
Denver, COL -- US$625M insurance costs for damage from
Hail damage
Severe incidents
Denver, COL -- US$625M insurance costs for damage from
Hail suppression
Based on the concept that there are insufficient ice nuclei
Hail suppression
Based on the concept that there are insufficient ice nuclei
Hail suppression logistics
Seeding locations -- in vicinity of strongest updrafts; either
Hail suppression logistics
Seeding locations -- in vicinity of strongest updrafts; either
Results of hail suppression
N. Dakota: 45% reduction in hail insurance claims
Results of hail suppression
N. Dakota: 45% reduction in hail insurance claims
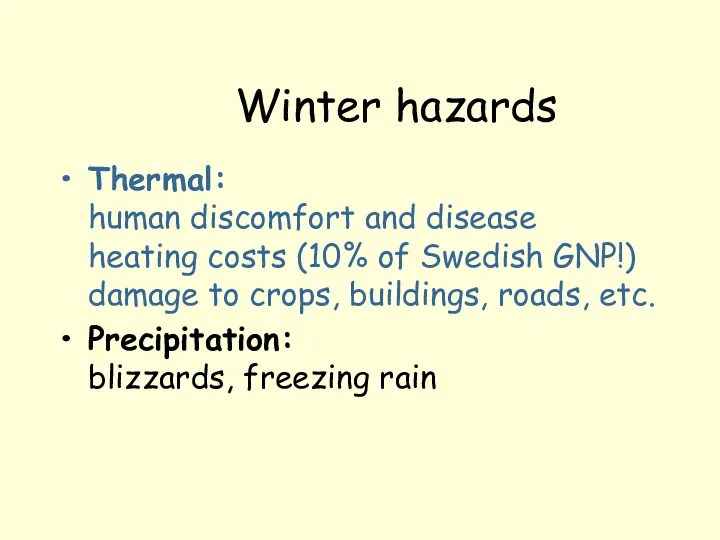
Winter hazards
Thermal:
human discomfort and disease
heating costs (10% of Swedish GNP!)
damage
Winter hazards
Thermal: human discomfort and disease heating costs (10% of Swedish GNP!) damage
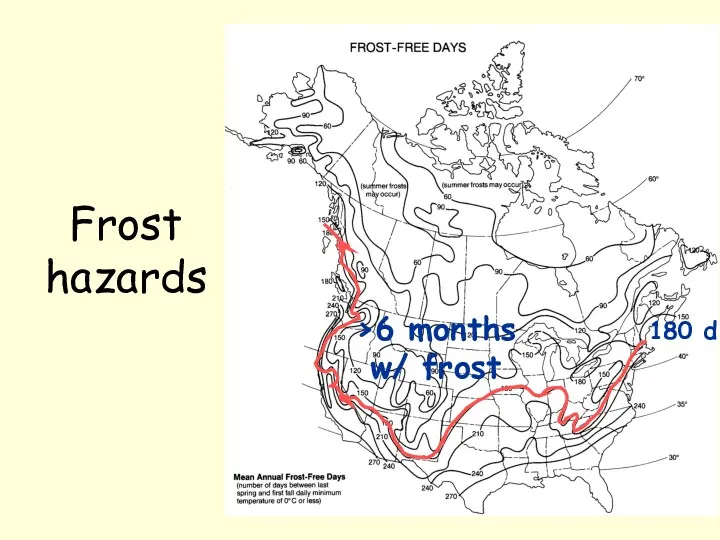
Frost
hazards
180 d
>6 months
w/ frost
Frost
hazards
180 d
>6 months
w/ frost
Hypothermia
Cold exposure results in vascorestriction of blood vessels, restricting flow of
Hypothermia
Cold exposure results in vascorestriction of blood vessels, restricting flow of
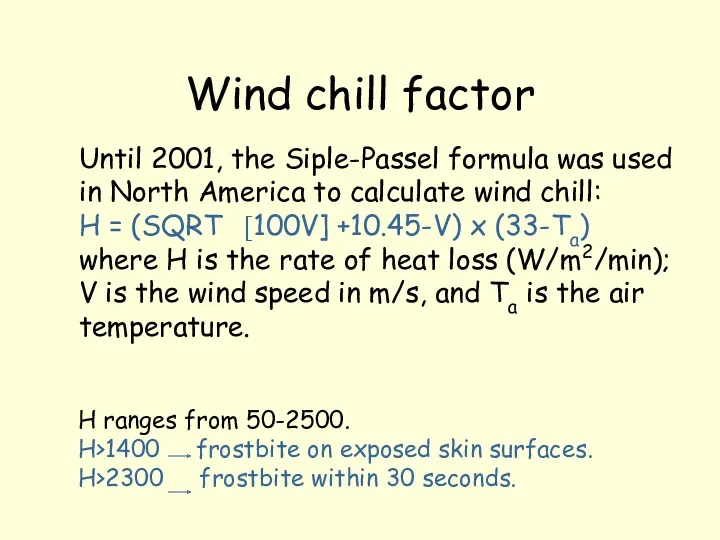
Wind chill factor
Until 2001, the Siple-Passel formula was used in North
Wind chill factor
Until 2001, the Siple-Passel formula was used in North
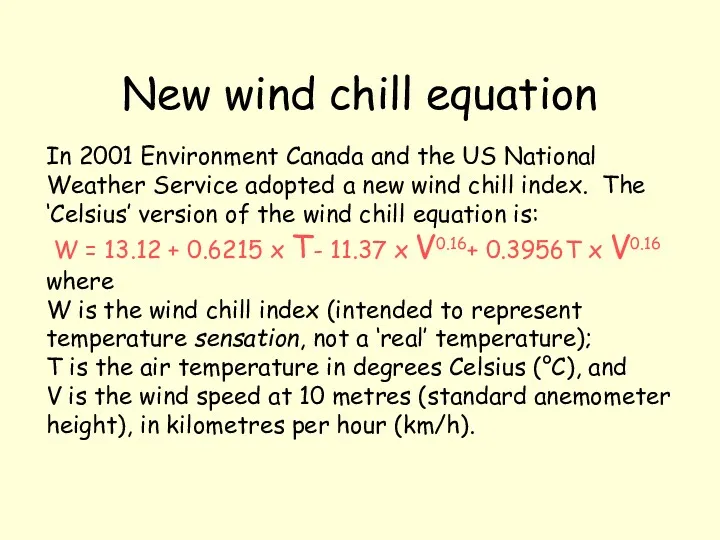
New wind chill equation
In 2001 Environment Canada and the US National
New wind chill equation
In 2001 Environment Canada and the US National
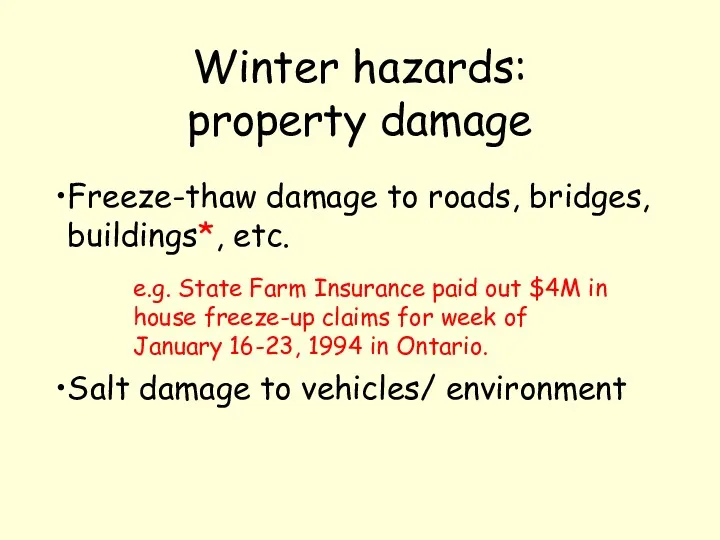
Winter hazards:
property damage
e.g. State Farm Insurance paid out $4M in house
Winter hazards:
property damage
e.g. State Farm Insurance paid out $4M in house
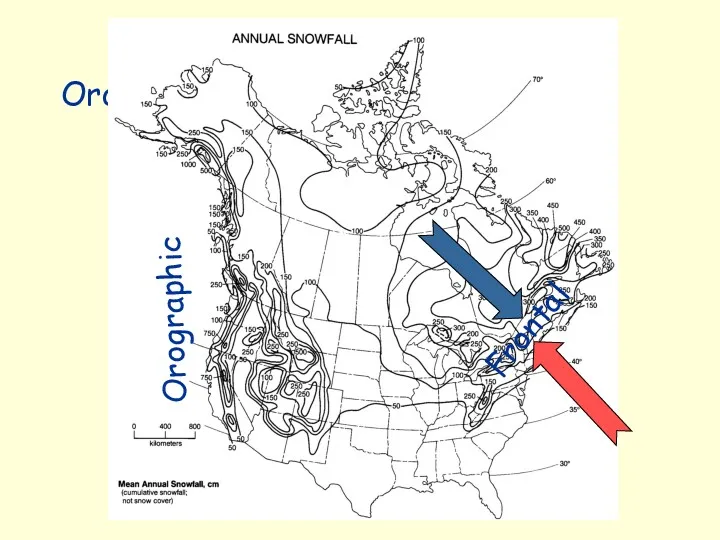
Orographic
Orographic
Frontal
Orographic
Orographic
Frontal
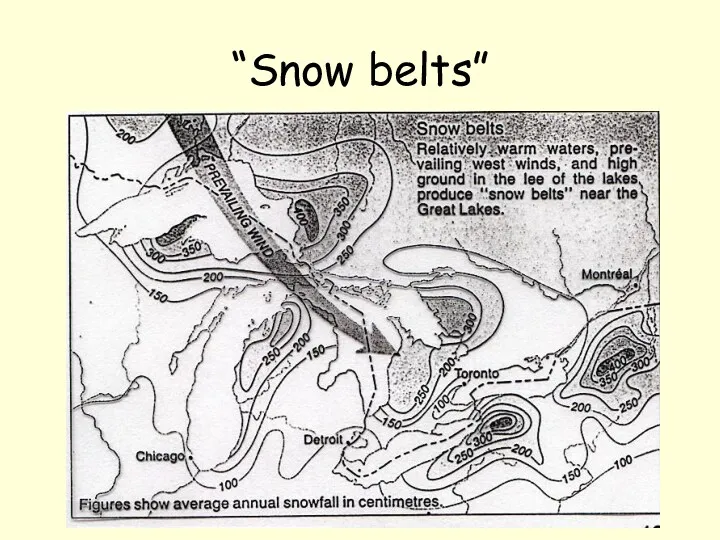
“Snow belts”
“Snow belts”
Blizzard hazards
e.g. 1997 blizzard in southern BC (~60 cm of snow
Blizzard hazards
e.g. 1997 blizzard in southern BC (~60 cm of snow
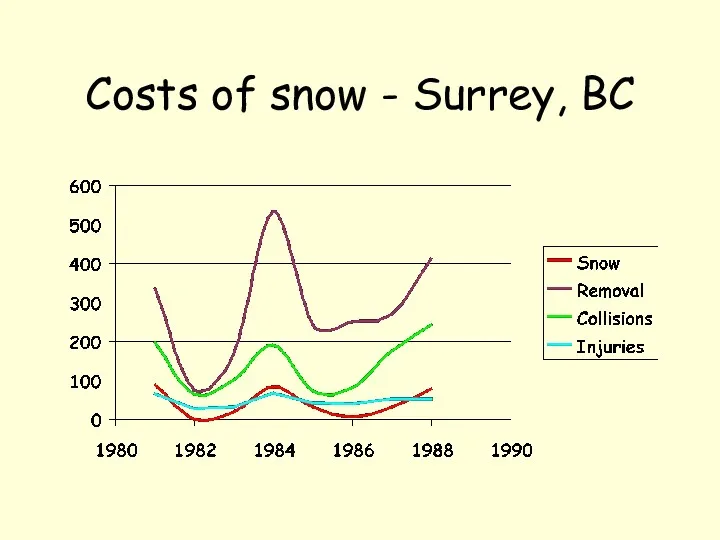
Costs of snow - Surrey, BC
Costs of snow - Surrey, BC
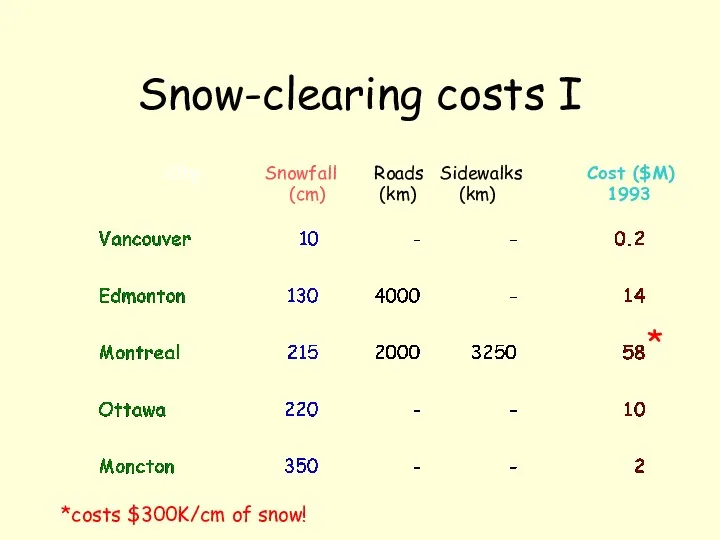
Snow-clearing costs I
City Snowfall Roads Sidewalks Cost ($M)
(cm) (km)
Snow-clearing costs I
City Snowfall Roads Sidewalks Cost ($M)
(cm) (km)
Snow-clearing costs II
Montreal has 72 ploughs, 47 loaders. 68 blowers (@$250K
Snow-clearing costs II
Montreal has 72 ploughs, 47 loaders. 68 blowers (@$250K
Insurance costs
In January 1993, a relatively snow-free month, 5200 auto insurance
Insurance costs
In January 1993, a relatively snow-free month, 5200 auto insurance
Freezing rain
Major ice storms in recent Canadian history:
Montréal (1942) -- 39
Freezing rain
Major ice storms in recent Canadian history:
Montréal (1942) -- 39
The geography of the 1998 ice storm
Up to 40mm
in Maritimes
The geography of the 1998 ice storm
Up to 40mm
in Maritimes
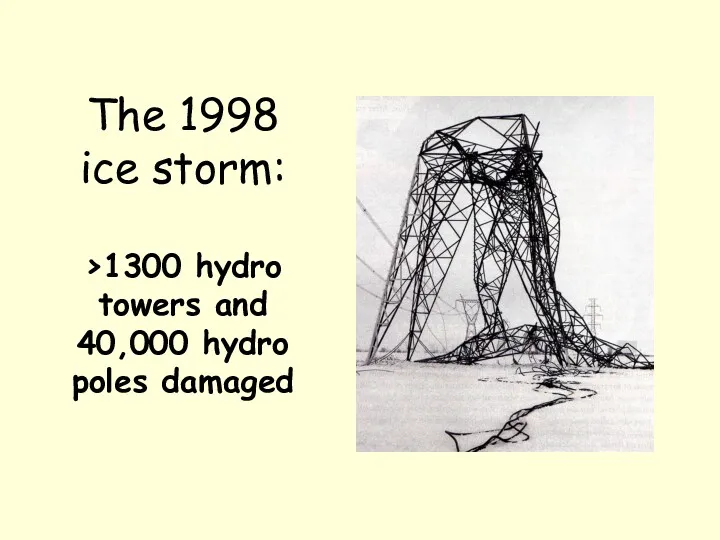
The 1998 ice storm:
>1300 hydro towers and 40,000 hydro poles damaged
The 1998 ice storm:
>1300 hydro towers and 40,000 hydro poles damaged
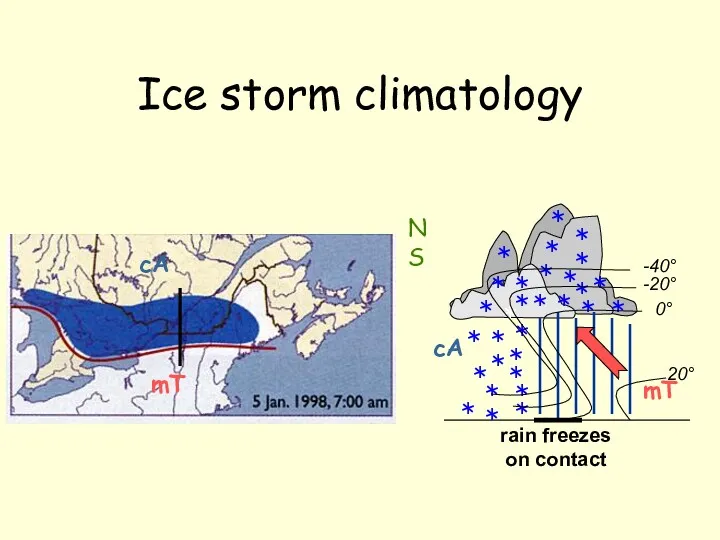
Ice storm climatology
mT
cA
rain freezes
on contact
N S
-20°
0°
20°
-40°
mT
cA
Ice storm climatology
mT
cA
rain freezes
on contact
N S
-20°
0°
20°
-40°
mT
cA
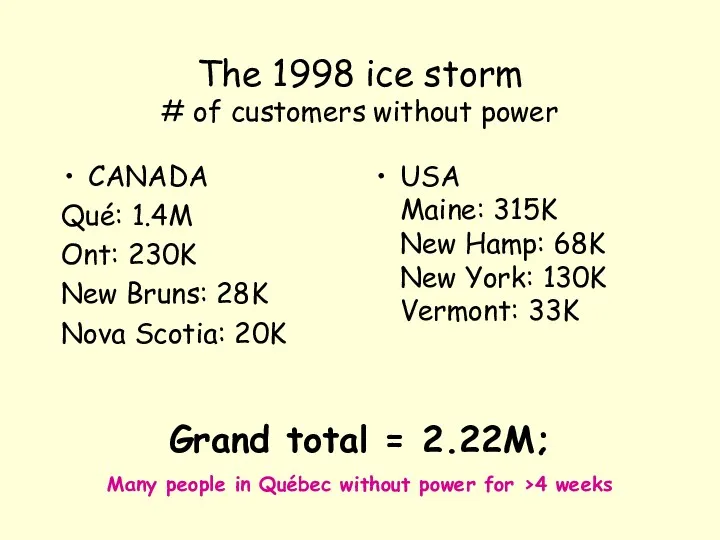
The 1998 ice storm
# of customers without power
CANADA
Qué: 1.4M
Ont: 230K
New
The 1998 ice storm
# of customers without power
CANADA
Qué: 1.4M
Ont: 230K
New
 Классный час по ПДД. 6 класс
 Правила пожарной безопасности и поведения в лесах
 Дослідження параметрів мікроклімату робочої зони
 Презентация к ОБЖ Ядерное оружие
 Территориальные подсистемы РСЧС
 Аварии на радиационно опасных объектах и их возможные последствия
 Небезпека на вулиці
 Пагубность вредных привычек и их профилактика
 Береги здоровье смолоду
 Проект Путешествие в страну дорожных знаков
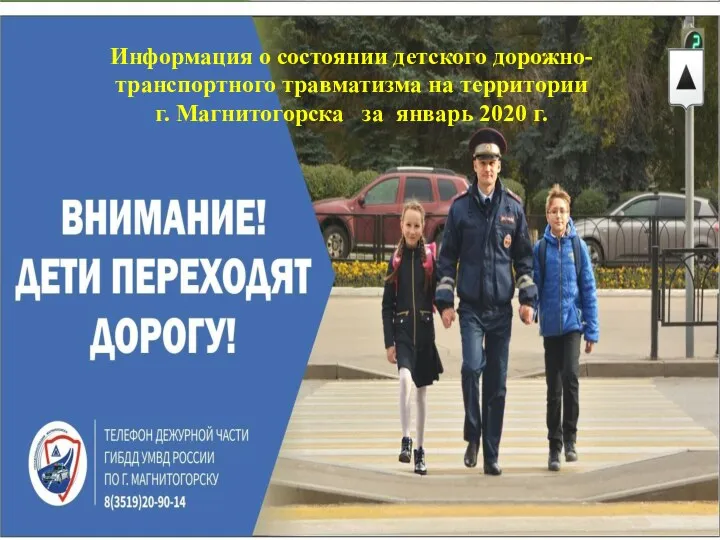 Информация о состоянии детского дорожно-транспортного травматизма на территории г. Магнитогорска за январь 2020 г
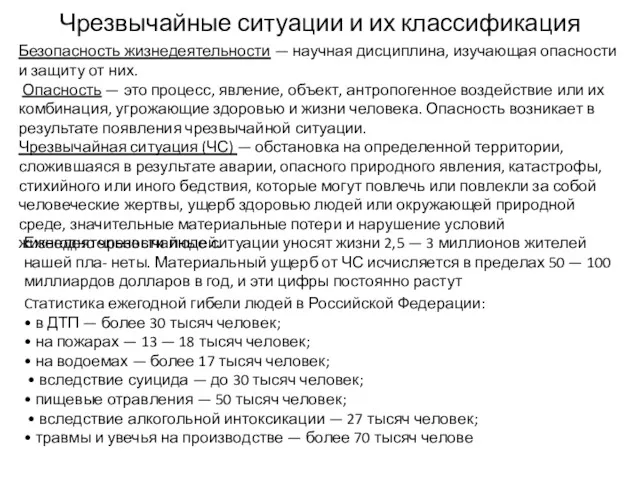 Чрезвычайные ситуации и их классификация
 Оказание первой помощи пострадавшим на производстве
 Мой любимый автомобиль. Для детей старшего дошкольного возраста
 Фаст-фудтың адам өміріне зияндылығы
 Я выбираю жизнь
 ВКР: Тушение пожаров и аварийноспасательные работы в детских дошкольных образовательных учреждениях
 Занятие по правилам дорожного движения.(презентация)
 Электронный паспорт территории Куединского муниципального округа Пермского края
 Пожарные приемно-контрольные приборы. (Лекция 6.1.3)
 История создания химического оружия
 Здоровьесберегающие технологии на уроках изобразительного искусства
 Защита человека и среды обитания от вредных и опасных факторов
 Bridge crossing safety
 Здоровый образ жизни школьника
 В безопасности нет мелочей
 Өндірістік шу, діріл, инфрадыбыс, ультрадыбыс. Шуылдың есту ағзасына әсері, нерв, қантамырлары және организмнің
 Оказание первой медицинской помощи при тепловом и солнечном ударе, отморожении и ожоге