- Wellbeing

Содержание
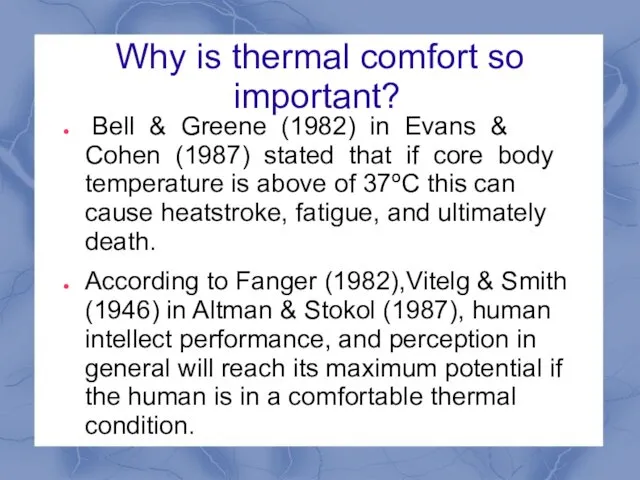
- 2. Why is thermal comfort so important? Bell & Greene (1982) in Evans & Cohen (1987) stated
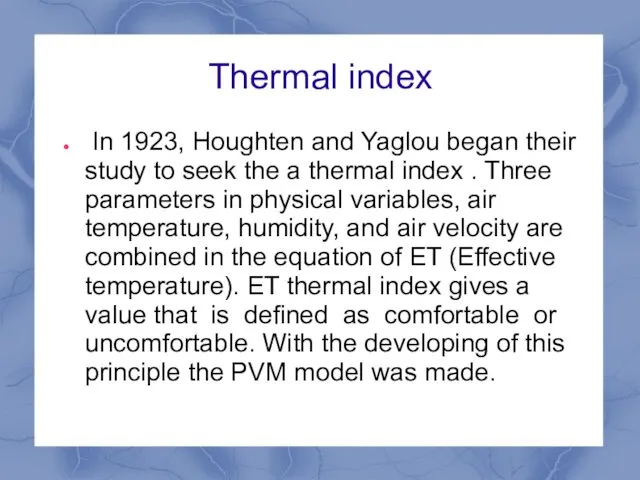
- 3. Thermal index In 1923, Houghten and Yaglou began their study to seek the a thermal index
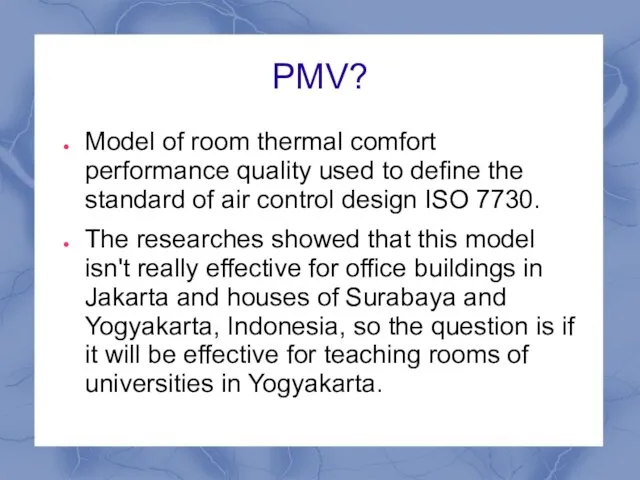
- 4. PMV? Model of room thermal comfort performance quality used to define the standard of air control
- 5. Problem So the problem sounds like: Is the PMV index model effective in predicting thermal comfort
- 6. The problem solving strategy The assessment of the significance of the difference between the value of
- 7. Objective, Hypothesis and Research Boundary The objective is to asses if model is effective or not
- 8. The variables of thermal comfort Climatic physical variables: 1. Air temperature 2. Mean radiant temperature 3.
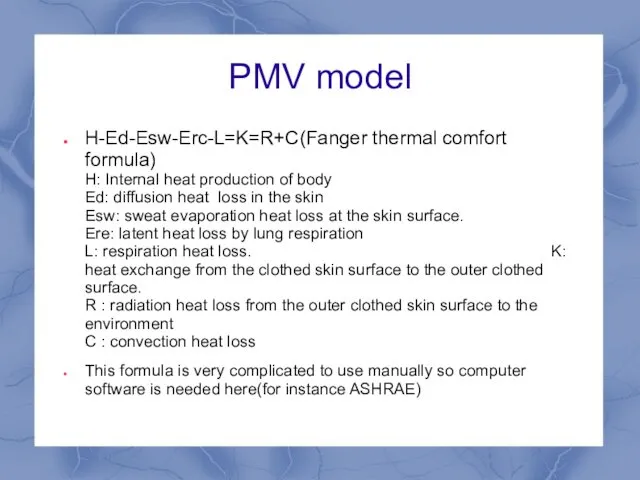
- 9. PMV model H-Ed-Esw-Erc-L=K=R+C(Fanger thermal comfort formula) H: Internal heat production of body Ed: diffusion heat loss
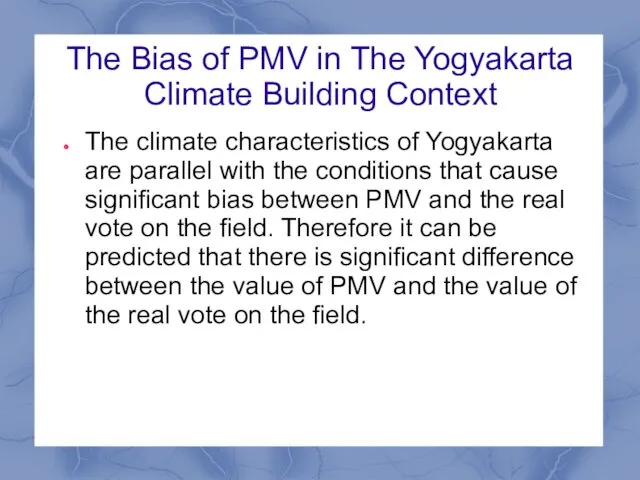
- 10. The Bias of PMV in The Yogyakarta Climate Building Context The climate characteristics of Yogyakarta are
- 11. Research method Location, Place and Sample Data Collecting The Method of Data Analysis
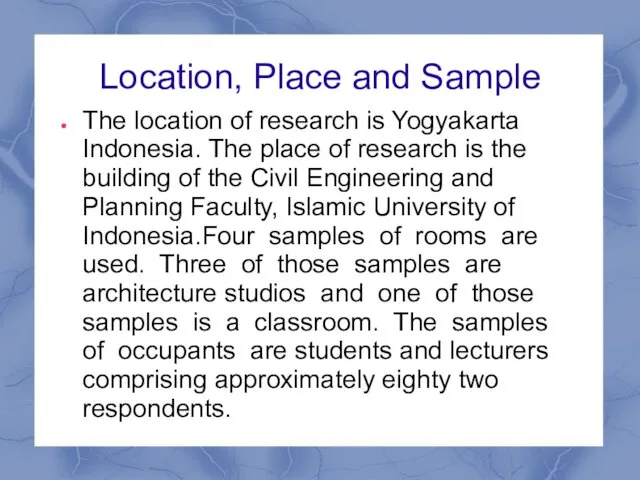
- 12. Location, Place and Sample The location of research is Yogyakarta Indonesia. The place of research is
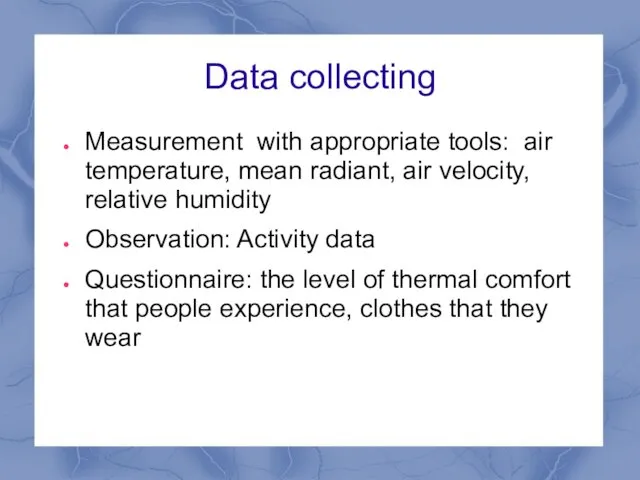
- 13. Data collecting Measurement with appropriate tools: air temperature, mean radiant, air velocity, relative humidity Observation: Activity
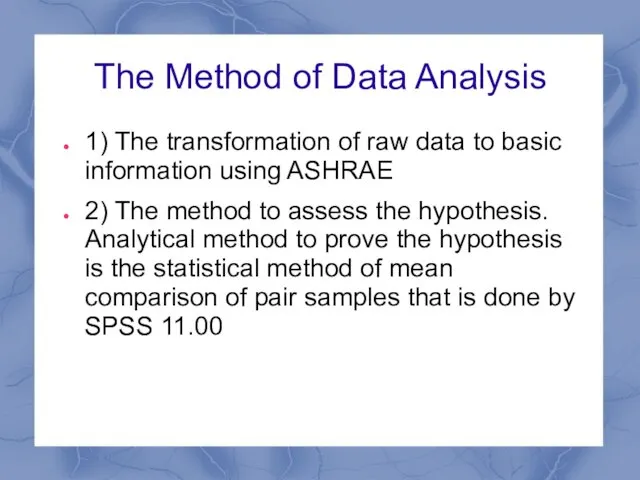
- 14. The Method of Data Analysis 1) The transformation of raw data to basic information using ASHRAE
- 15. Results and Conclusions
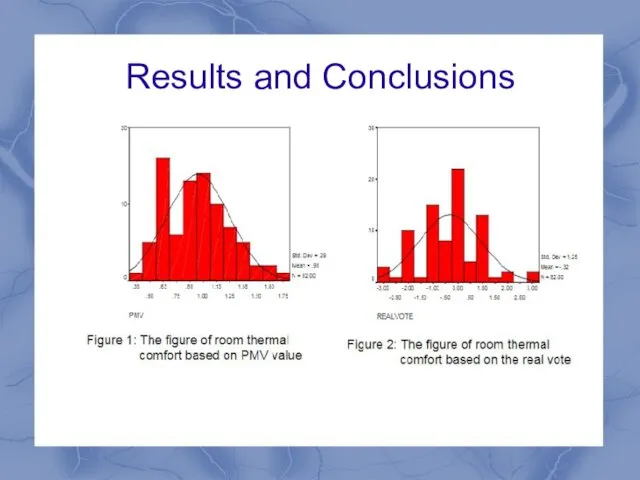
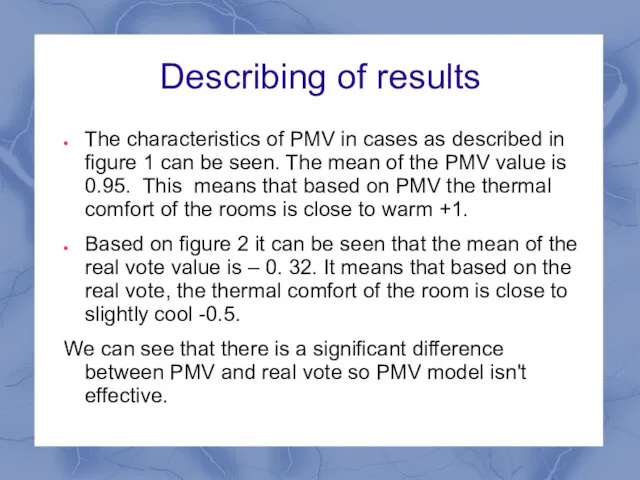
- 16. Describing of results The characteristics of PMV in cases as described in figure 1 can be
- 17. EnviroInfo Conferences: Knowledge Exchange Platform for Information Technology in Environmental Sustainability Research
- 18. The Role of Environmental Informatics Ecological information technologies are very important in solving ecological problems nowadays.
- 19. Development Phases of the EnviroInfo Network With the increasing of amounts of waste substances the pollution
- 20. Structure of the Technical Committee Environmental Informatics of the Society of Informatics
- 21. The Technical Committee Environmental Informatics of the Society of Informatics is structured in 3 Expert groups(Informatics
- 23. Скачать презентацию
Why is thermal comfort so important?
Bell & Greene (1982) in
Why is thermal comfort so important?
Bell & Greene (1982) in
Thermal index
In 1923, Houghten and Yaglou began their study to
Thermal index
In 1923, Houghten and Yaglou began their study to
PMV?
Model of room thermal comfort performance quality used to define the
PMV?
Model of room thermal comfort performance quality used to define the
Problem
So the problem sounds like:
Is the PMV index model effective
Problem
So the problem sounds like:
Is the PMV index model effective
The problem solving strategy
The assessment of the significance of the
The problem solving strategy
The assessment of the significance of the
Objective, Hypothesis and Research Boundary
The objective is to asses if
Objective, Hypothesis and Research Boundary
The objective is to asses if
The variables of thermal comfort
Climatic physical variables:
1. Air temperature
2. Mean
The variables of thermal comfort
Climatic physical variables:
1. Air temperature
2. Mean
PMV model
H-Ed-Esw-Erc-L=K=R+C(Fanger thermal comfort formula) H: Internal heat production of body
PMV model
H-Ed-Esw-Erc-L=K=R+C(Fanger thermal comfort formula) H: Internal heat production of body
The Bias of PMV in The Yogyakarta Climate Building Context
The
The Bias of PMV in The Yogyakarta Climate Building Context
The
Research method
Location, Place and Sample
Data Collecting
The Method of Data Analysis
Research method
Location, Place and Sample
Data Collecting
The Method of Data Analysis
Location, Place and Sample
The location of research is Yogyakarta Indonesia. The
Location, Place and Sample
The location of research is Yogyakarta Indonesia. The
Data collecting
Measurement with appropriate tools: air temperature, mean radiant, air velocity,
Data collecting
Measurement with appropriate tools: air temperature, mean radiant, air velocity,
The Method of Data Analysis
1) The transformation of raw data to
The Method of Data Analysis
1) The transformation of raw data to
Results and Conclusions
Results and Conclusions
Describing of results
The characteristics of PMV in cases as described
Describing of results
The characteristics of PMV in cases as described
EnviroInfo Conferences: Knowledge Exchange Platform for Information Technology in Environmental Sustainability
EnviroInfo Conferences: Knowledge Exchange Platform for Information Technology in Environmental Sustainability

The Role of Environmental Informatics
Ecological information technologies are very important in
The Role of Environmental Informatics
Ecological information technologies are very important in
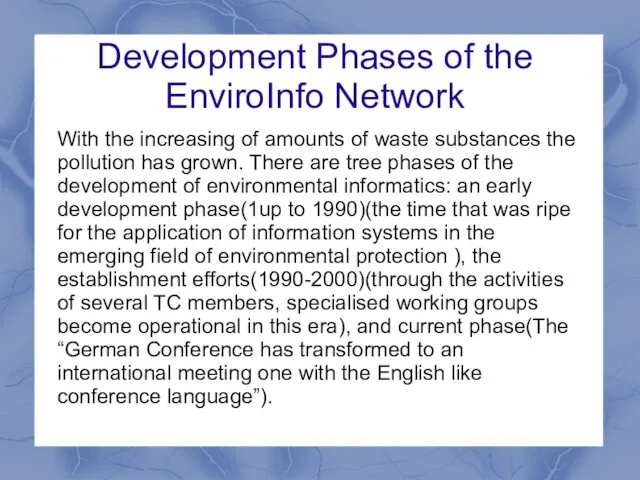
Development Phases of the EnviroInfo Network
With the increasing of amounts
Development Phases of the EnviroInfo Network
With the increasing of amounts
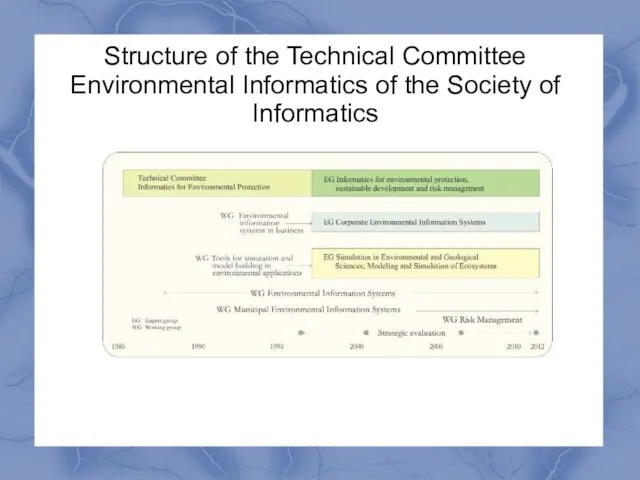
Structure of the Technical Committee Environmental Informatics of the Society of
Structure of the Technical Committee Environmental Informatics of the Society of

The Technical Committee Environmental Informatics of the Society of Informatics is
The Technical Committee Environmental Informatics of the Society of Informatics is
 Отклоняющееся поведение и социальный контроль
 An Artificial Mind via Cognitive Modular Neural Architectur
 Психология почерка человека
 Собеседование по найму: понятие, виды, типичные вопросы
 Архетипы
 Теоретические аспекты работы с детьми и подростками, склонными к девиантному поведению
 Адаптация 5-х классов к средней школе
 Руководитель тренингового занятия. Требования к тренеру
 Нейролингвистическое программирование
 Индивидуальность и исключительность
 Нistory of psychology
 Дружбой дорожить умейте!
 Теории выбора брачного партнера
 Алгоритм взаимодействия педагогов с детьми и подростками, склонными к суицидальному поведению
 Механизмы намеренного самоповреждающего поведения
 Виды общения
 Синдром профессионального выгорания у медицинских работников
 Родительское собрание 9 класс Психологические особенности в подростковом возрасте
 Диспозициональная теория личности
 Индивидуально-психологические особенности личности
 How not to learn new words: psychological point of view
 Физиология индивидуаьных различий
 Интересы и духовные запросы юности
 Девиантное поведение в подростковом возрасте
 Парадигма в психологии
 Общение. Виды общения
 Понятие о благоприятном психологическом климате в коллективе
 Психологические особенности учащихся профессиональной школы. (Тема 3)