EMVA 1288 Standard for measurement and presentation of specifications for machine vision. Sensors and cameras презентация
- EMVA 1288 Standard for measurement and presentation of specifications for machine vision. Sensors and cameras

Содержание
- 2. Why we need EMVA 1288 Standard EMVA 1288 Standard organization Measurement setup 1288 Module 1 “in
- 3. Motivation Existing Standards for cameras are not suitable for MV Each Sensor and Camera Manufacturer has
- 4. The EMVA 1288 Working Group (logos status 2007) The EMVA 1288 Working group is open! Contact
- 5. Current status Standard Release 2.0 Covers Sensitivity Spatial and Temporal Noise; Linearity Adapted by many companies
- 6. Illumination Setup from Module 1 Homogenous illumination Without lens F-number 8 Definition of temperature measurements Standard
- 7. Module 1 measurement Possible realizations of set up
- 8. Outlook measurement setup variation for Color module Integrating sphere Illuminator Integrating sphere Recommended Setup: (Preliminary) Diffuser
- 9. Camera Mathematical Model Parameters Parameter Identification Standard 1288 Module 1 2) Mathematical Model ! The standard
- 10. Standard 1288 Module 1 3) Basic Information This section delivers general information and information regarding the
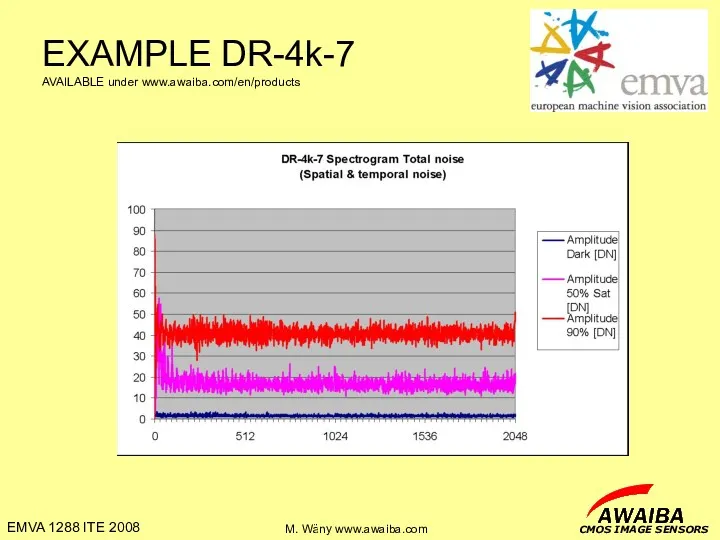
- 11. EXAMPLE DR-4k-7 AVAILABLE under www.awaiba.com/en/products
- 12. Standard 1288 Module 1 4) Operation Point This section describes exactly in what configuration the camera
- 13. EXAMPLE DR-4k7 AVAILABLE under www.awaiba.com/en/products
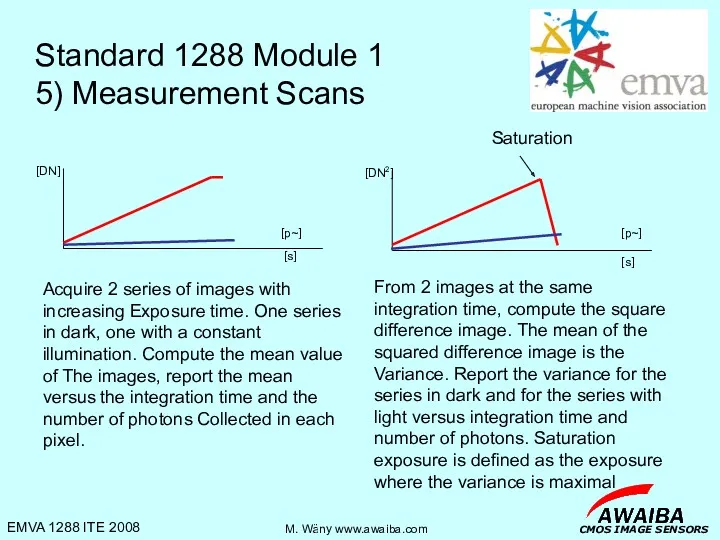
- 14. Standard 1288 Module 1 5) Measurement Scans Acquire 2 series of images with increasing Exposure time.
- 15. EXAMPLE DR-4k-7 AVAILABLE under www.awaiba.com/en/products
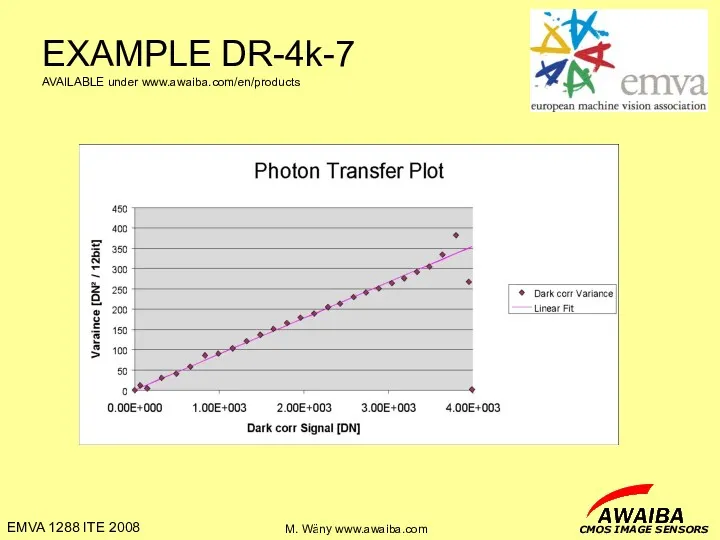
- 16. Standard 1288 Module 1 6) Photon Transfer Method Subtract the mean dark values from the mean
- 17. EXAMPLE DR-4k-7 AVAILABLE under www.awaiba.com/en/products
- 18. Standard 1288 Module 1 7) Derived Quantities
- 19. EXAMPLE DR-4k-7 AVAILABLE under www.awaiba.com/en/products
- 20. Standard 1288 Module 1 8) SNR Plot Plot the SNR values resulting from each integration time
- 21. EXAMPLE DR-4k-7 AVAILABLE under www.awaiba.com/en/products DYN = 66dB Theoretical limit of SNR based on photon shot
- 22. Standard 1288 Module 1 9) Quantum Efficiency Plot From the conversion gain and the light intensity
- 23. EXAMPLE DR-4k-7 AVAILABLE under www.awaiba.com/en/products
- 24. Standard 1288 Module 1 10) Dark Current Acquire series of dark images versus increasing integration times
- 25. EXAMPLE DR-4k-7 AVAILABLE under www.awaiba.com/en/products Dark current doubling temperature 11.2K Dark current at ambient 3e-/ms
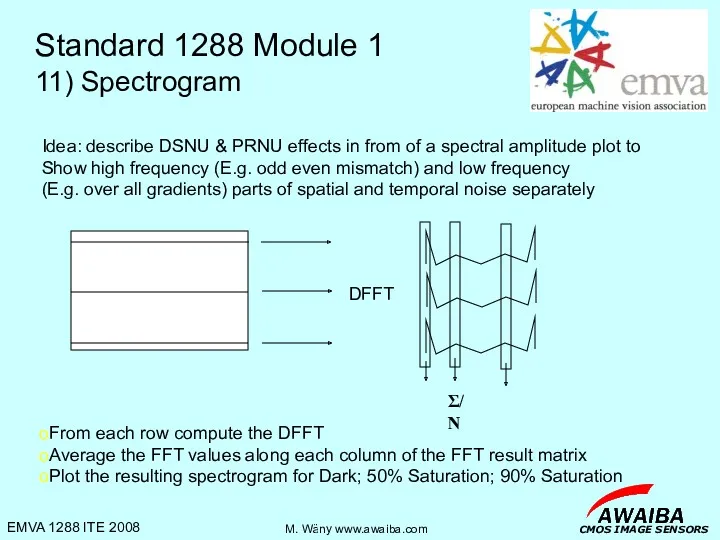
- 26. Standard 1288 Module 1 11) Spectrogram From each row compute the DFFT Average the FFT values
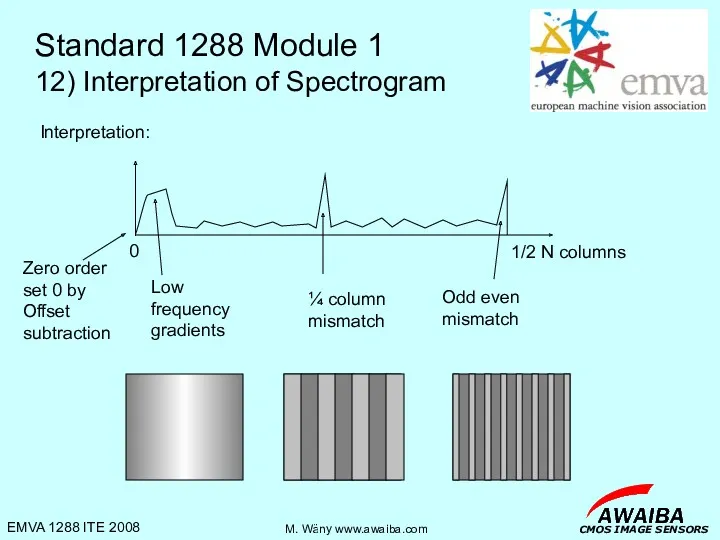
- 27. Standard 1288 Module 1 12) Interpretation of Spectrogram
- 28. EXAMPLE DR-4k-7 AVAILABLE under www.awaiba.com/en/products
- 29. User Benefit 1288 Compare different Settings Objectively
- 30. Optimize performance based on real values rather than visual impression! Raw sample image DR-4k-7 at previously
- 32. Скачать презентацию
Why we need EMVA 1288 Standard
EMVA 1288 Standard organization
Measurement setup
1288 Module
Why we need EMVA 1288 Standard
EMVA 1288 Standard organization
Measurement setup
1288 Module
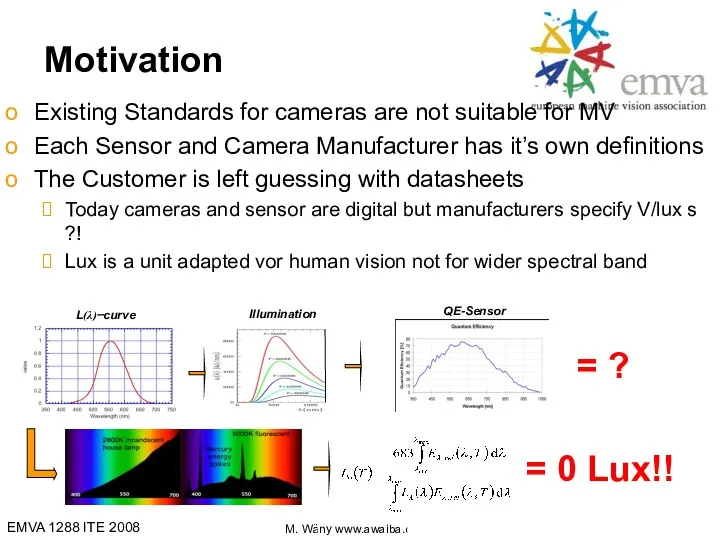
Motivation
Existing Standards for cameras are not suitable for MV
Each Sensor and
Motivation
Existing Standards for cameras are not suitable for MV
Each Sensor and
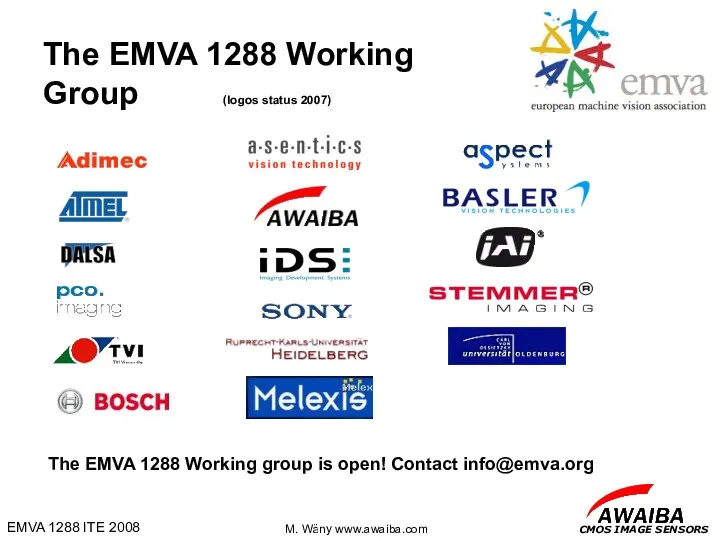
The EMVA 1288 Working Group (logos status 2007)
The EMVA 1288 Working
The EMVA 1288 Working Group (logos status 2007)
The EMVA 1288 Working

Current status
Standard Release 2.0
Covers Sensitivity Spatial and Temporal Noise; Linearity
Adapted
Current status
Standard Release 2.0
Covers Sensitivity Spatial and Temporal Noise; Linearity
Adapted
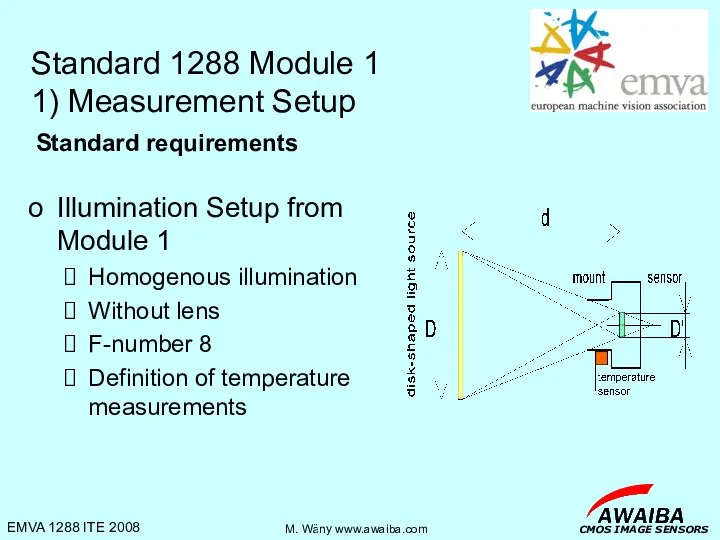
Illumination Setup from Module 1
Homogenous illumination
Without lens
F-number 8
Definition of temperature measurements
Standard
Illumination Setup from Module 1
Homogenous illumination
Without lens
F-number 8
Definition of temperature measurements
Standard

Module 1 measurement
Possible realizations of set up
Module 1 measurement
Possible realizations of set up
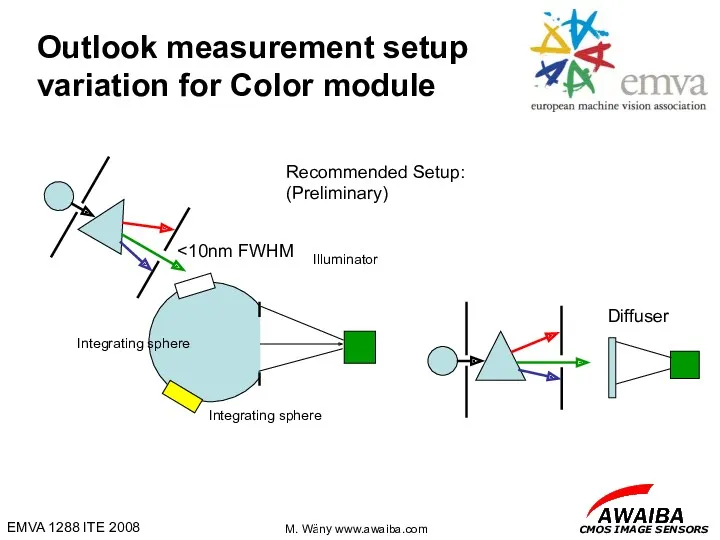
Outlook measurement setup variation for Color module
Integrating sphere
Illuminator
Integrating sphere
Recommended Setup:
(Preliminary)
Diffuser
<10nm FWHM
Outlook measurement setup variation for Color module
Integrating sphere
Illuminator
Integrating sphere
Recommended Setup:
(Preliminary)
Diffuser
<10nm FWHM
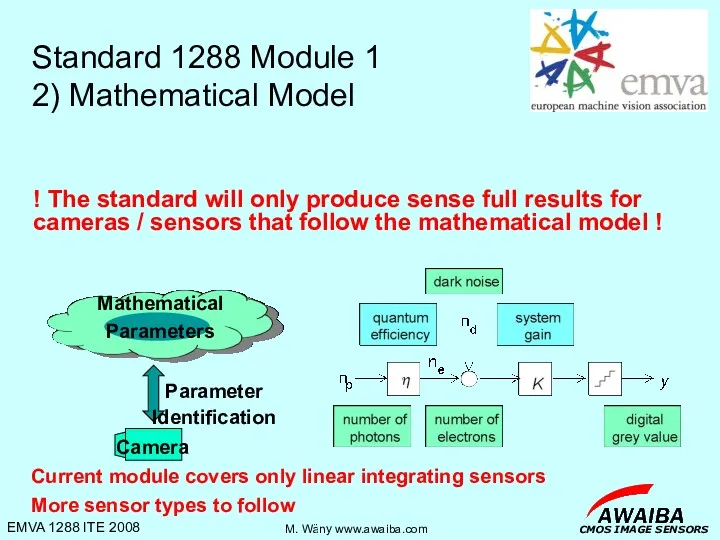
Camera
Mathematical Model
Parameters
Parameter
Identification
Standard 1288 Module 1
2) Mathematical Model
! The standard will only
Camera
Mathematical Model
Parameters
Parameter
Identification
Standard 1288 Module 1
2) Mathematical Model
! The standard will only
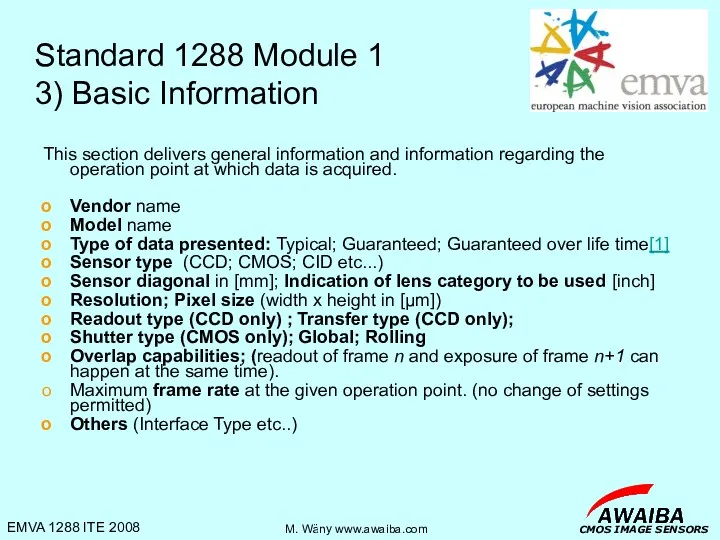
Standard 1288 Module 1
3) Basic Information
This section delivers general information and
Standard 1288 Module 1
3) Basic Information
This section delivers general information and

EXAMPLE DR-4k-7
AVAILABLE under www.awaiba.com/en/products
EXAMPLE DR-4k-7
AVAILABLE under www.awaiba.com/en/products
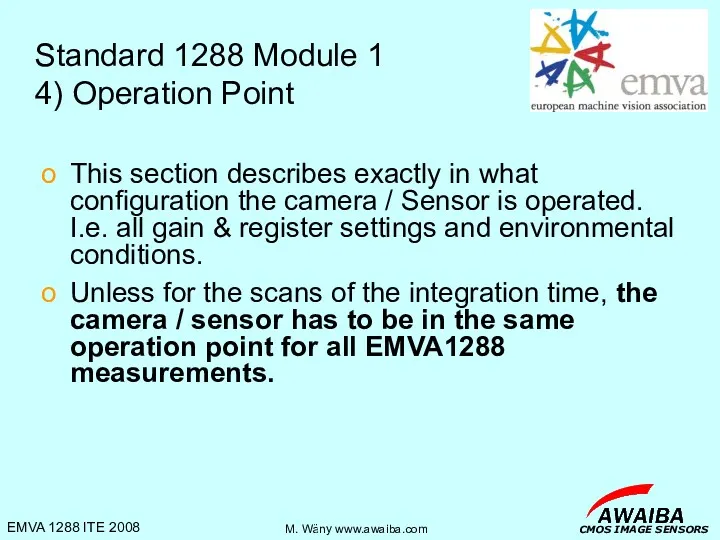
Standard 1288 Module 1
4) Operation Point
This section describes exactly in what
Standard 1288 Module 1
4) Operation Point
This section describes exactly in what
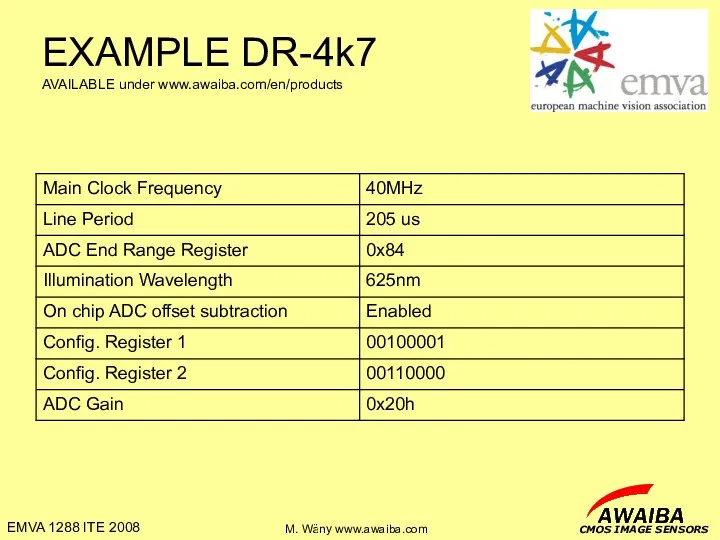
EXAMPLE DR-4k7
AVAILABLE under www.awaiba.com/en/products
EXAMPLE DR-4k7
AVAILABLE under www.awaiba.com/en/products
Standard 1288 Module 1
5) Measurement Scans
Acquire 2 series of images with
Standard 1288 Module 1
5) Measurement Scans
Acquire 2 series of images with
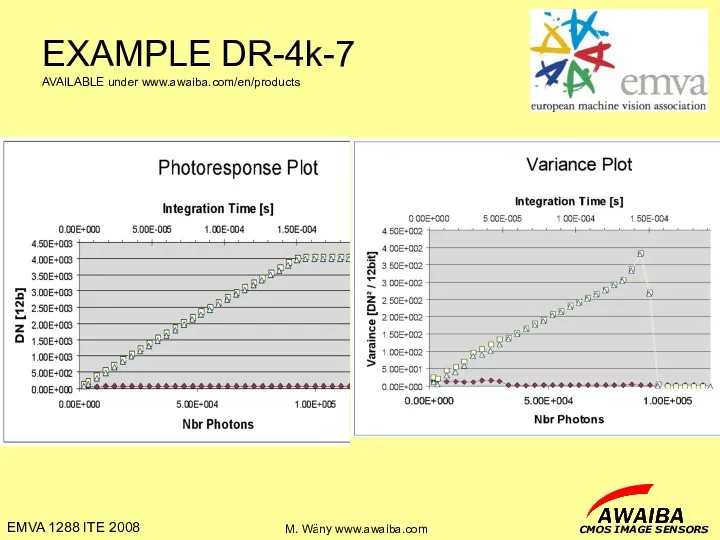
EXAMPLE DR-4k-7
AVAILABLE under www.awaiba.com/en/products
EXAMPLE DR-4k-7
AVAILABLE under www.awaiba.com/en/products

Standard 1288 Module 1
6) Photon Transfer Method
Subtract the mean dark values
Standard 1288 Module 1
6) Photon Transfer Method
Subtract the mean dark values
EXAMPLE DR-4k-7
AVAILABLE under www.awaiba.com/en/products
EXAMPLE DR-4k-7
AVAILABLE under www.awaiba.com/en/products
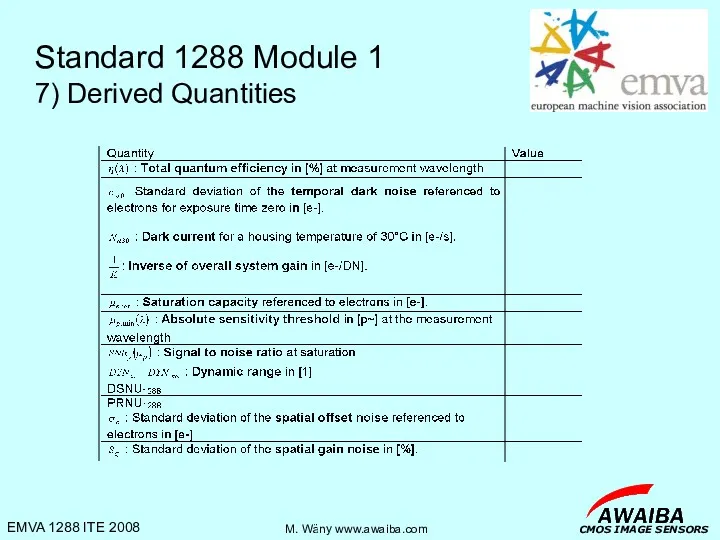
Standard 1288 Module 1
7) Derived Quantities
Standard 1288 Module 1
7) Derived Quantities
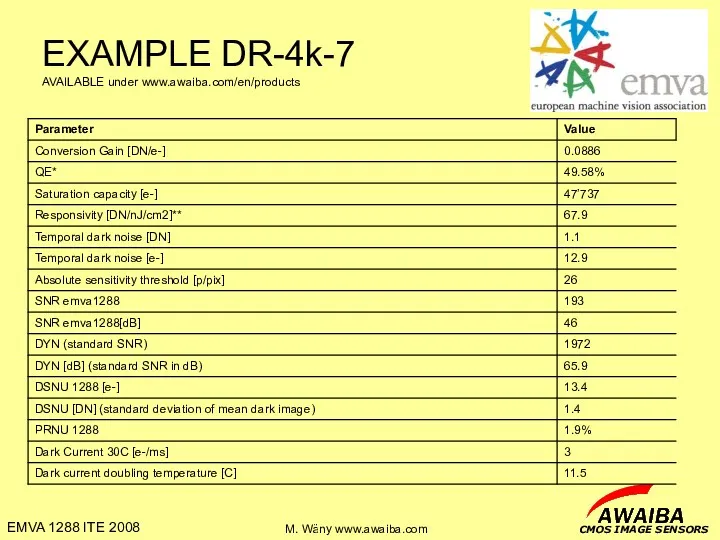
EXAMPLE DR-4k-7
AVAILABLE under www.awaiba.com/en/products
EXAMPLE DR-4k-7
AVAILABLE under www.awaiba.com/en/products

Standard 1288 Module 1
8) SNR Plot
Plot the SNR values resulting from
Standard 1288 Module 1
8) SNR Plot
Plot the SNR values resulting from
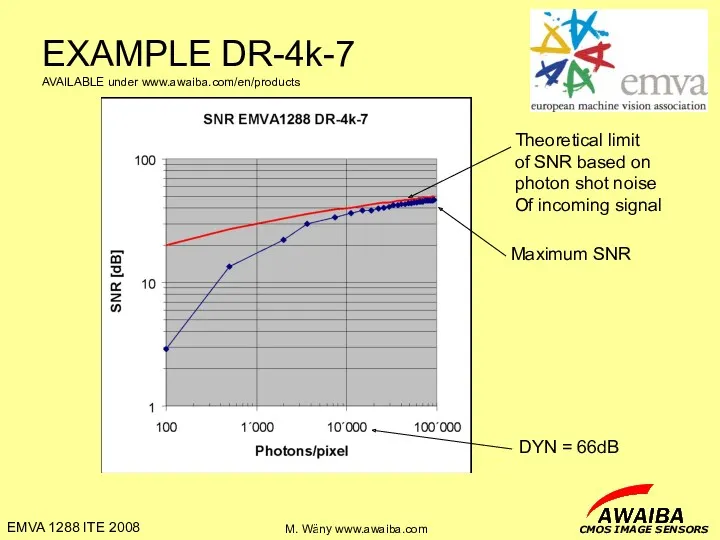
EXAMPLE DR-4k-7
AVAILABLE under www.awaiba.com/en/products
DYN = 66dB
Theoretical limit
of SNR based on
photon shot
EXAMPLE DR-4k-7
AVAILABLE under www.awaiba.com/en/products
DYN = 66dB
Theoretical limit
of SNR based on
photon shot

Standard 1288 Module 1
9) Quantum Efficiency Plot
From the conversion gain and
Standard 1288 Module 1
9) Quantum Efficiency Plot
From the conversion gain and
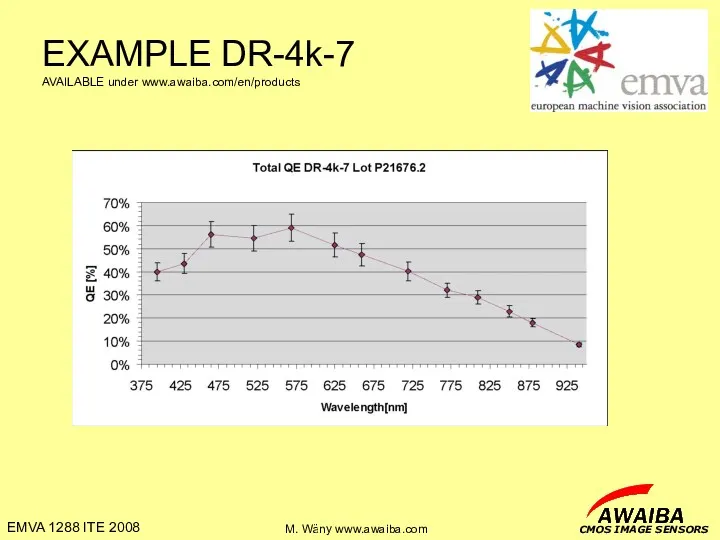
EXAMPLE DR-4k-7
AVAILABLE under www.awaiba.com/en/products
EXAMPLE DR-4k-7
AVAILABLE under www.awaiba.com/en/products

Standard 1288 Module 1
10) Dark Current
Acquire series of dark images versus
Standard 1288 Module 1
10) Dark Current
Acquire series of dark images versus

EXAMPLE DR-4k-7
AVAILABLE under www.awaiba.com/en/products
Dark current doubling temperature 11.2K
Dark current at ambient
EXAMPLE DR-4k-7
AVAILABLE under www.awaiba.com/en/products
Dark current doubling temperature 11.2K
Dark current at ambient
Standard 1288 Module 1
11) Spectrogram
From each row compute the DFFT
Average the
Standard 1288 Module 1
11) Spectrogram
From each row compute the DFFT
Average the
Standard 1288 Module 1
12) Interpretation of Spectrogram
Standard 1288 Module 1
12) Interpretation of Spectrogram
EXAMPLE DR-4k-7
AVAILABLE under www.awaiba.com/en/products
EXAMPLE DR-4k-7
AVAILABLE under www.awaiba.com/en/products
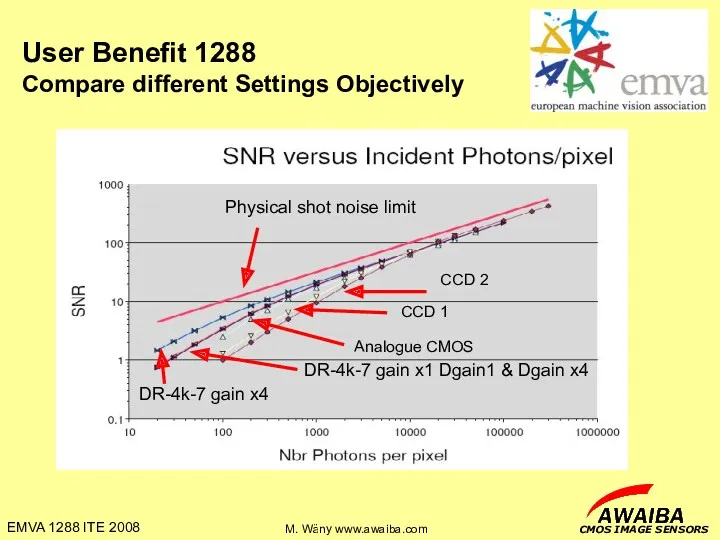
User Benefit 1288
Compare different Settings Objectively
User Benefit 1288
Compare different Settings Objectively
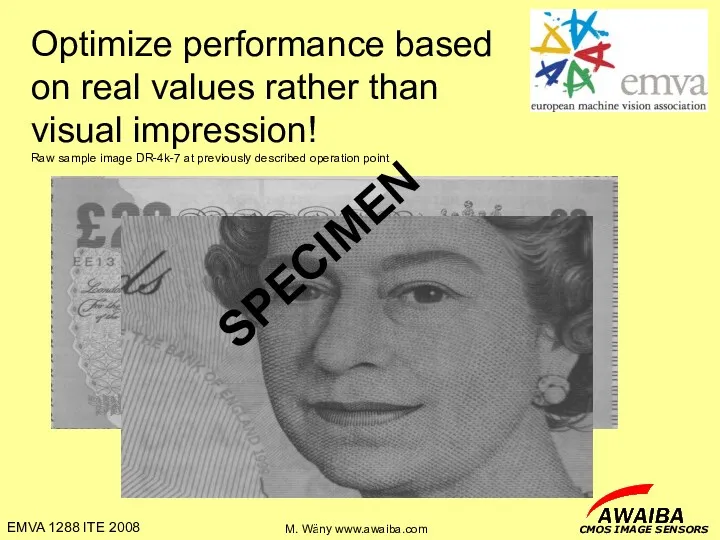
Optimize performance based on real values rather than visual impression!
Raw sample
Optimize performance based on real values rather than visual impression! Raw sample
 Психология межличностных и межгрупповых отношений
 Выжигание
 Внеурочная работа в начальной школе
 ВИЧ
ВИЧ Международный союз электросвязи (ITU)
 Фундаменты мелкого заложения. Виды фундаментов
 Профилактика речевых нарушений у детей в детском саду
 Способы решения показательных уравнений
 презентация для самообразования учителей о Кембриджской Программе внедрения семи модулей, как Новых подходах в воспитании и обучении детей.
 Мой город Саранск
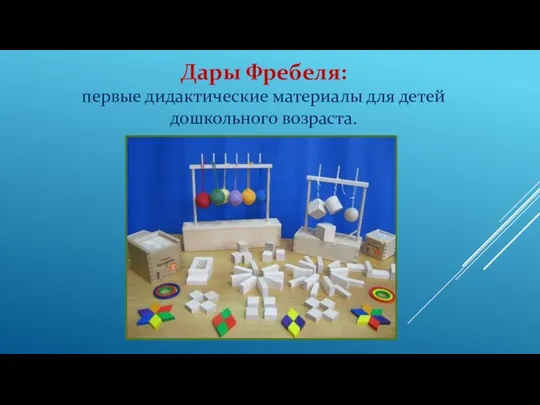 Дары Фребеля: первые дидактические материалы для детей дошкольного возраста.
 Менингококковая инфекция
 Социальное партнёрство с родителями, как условие развития творческих способностей обучающихся
  Различение звуков К-Т (подготовительная группа).
 Презентация к проекту Получение коллоидного раствора серебра и изучение его свойств
 Исследовательская работа Я на радугу-дугу полюбуюсь, побегу!
 Парламент против короля. Революция в Англии
 Презентация межпредметной игры по математике,информатике, физике и химии для 8-10 классов 30 пятёрок
 презентация к логопедическому занятию Весна идет! Весне дорогу!
 Zoobazar. Методическое пособие
 Презентация Тематические карточки как новый метод использования раздаточных материалов в работе с детьми 6 – 7 лет
 Презентация Формирование здорового образа жизни
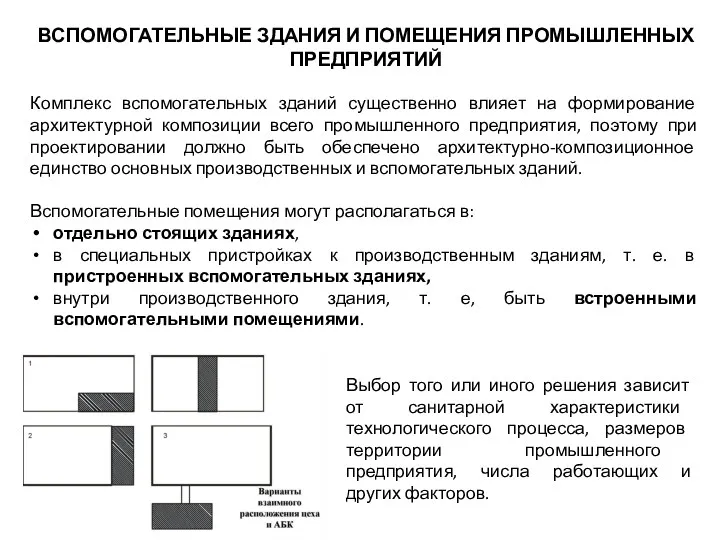 Вспомогательные здания и помещения промышленных предприятий
 Организация деятельности общероссийской детско-юношеской организации Российское движение школьников
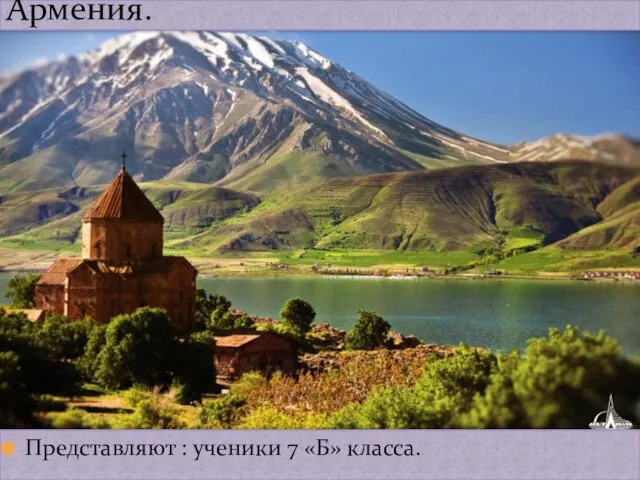 Армения, государство на севере Азии
 Строительство первого интегрированного газохимического комплекса в Атырауской области
 Притча о мытаре и фарисее
 Welcome to Java India