- Stock market basics and stock pricing

Содержание
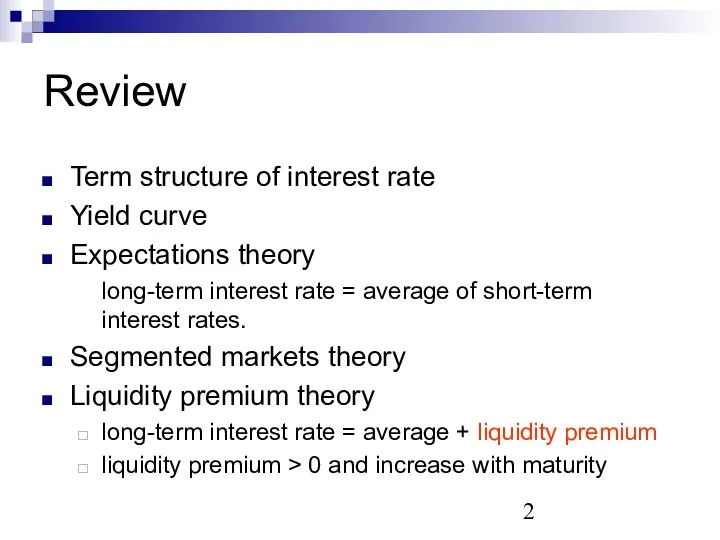
- 2. Review Term structure of interest rate Yield curve Expectations theory long-term interest rate = average of
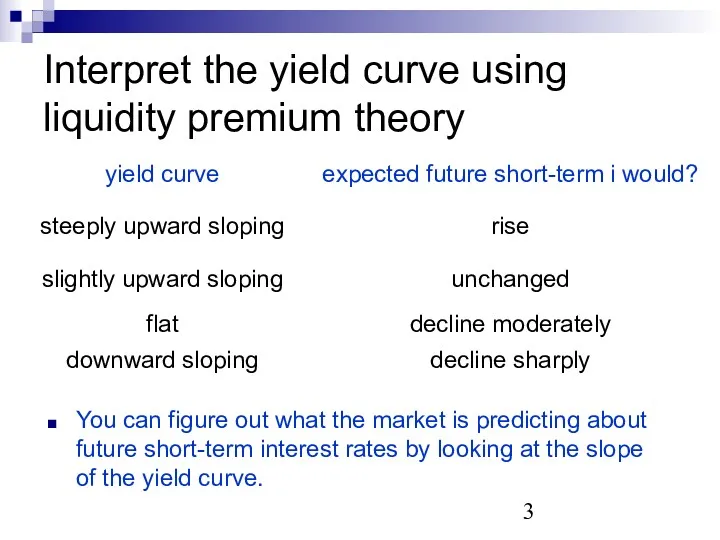
- 3. Interpret the yield curve using liquidity premium theory You can figure out what the market is
- 4. Stocks A share of stock is a claim on the net income and assets of the
- 5. Rights of shareholders Shareholders (stockholders) have ownership interest in the company proportional to shares owned. Large
- 6. Shareholders’ payoff possible income: dividends: payments made periodically, usually every quarter, to stockholders. Shareholders are eligible
- 7. Stock exchanges New York Stock Exchange (NYSE, "Big Board" ) NASDAQ (National Association of Securities Dealers
- 8. Read stock quotes 52-Wk Rng Highest and lowest share price achieved by the stock over the
- 9. Major events 1987 crash: total value of stocks fell by about a trillion dollars between August
- 10. If I could forecast stock price Fundamental analysis macro-econ and firm performance ? dividend ? stock’s
- 11. Technical analysis cycles and waves candle stick chart
- 12. Alternative views of stock pricing Fundamental Finance View: Stock prices are largely determined by the true
- 13. Pricing principle of ‘fundamental view’ ‘Basic principle of finance’: value today = present value of future
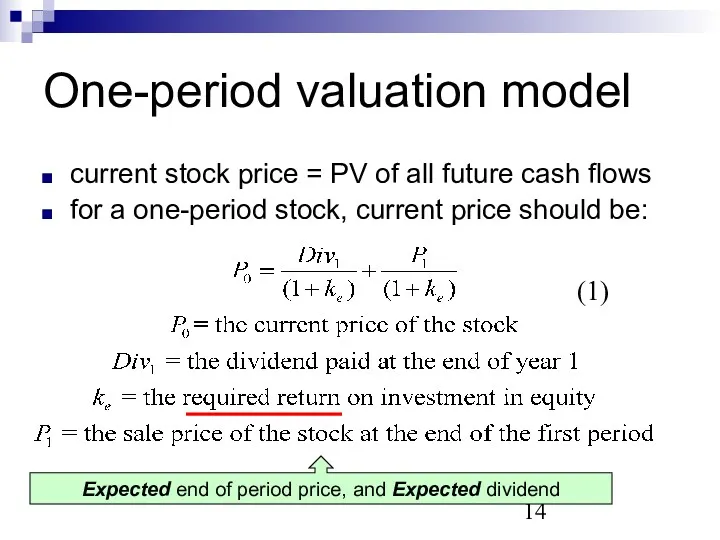
- 14. One-period valuation model current stock price = PV of all future cash flows for a one-period
- 15. If n is large, Pn happens far in the future, then the last term of the
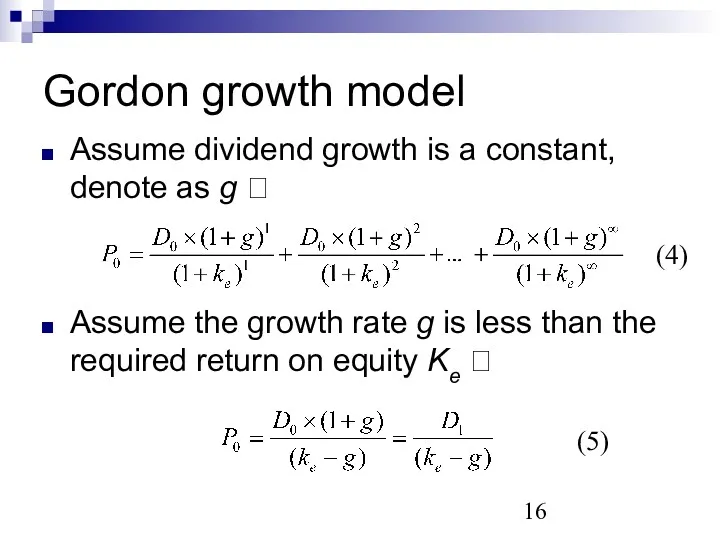
- 16. Gordon growth model Assume dividend growth is a constant, denote as g ? Assume the growth
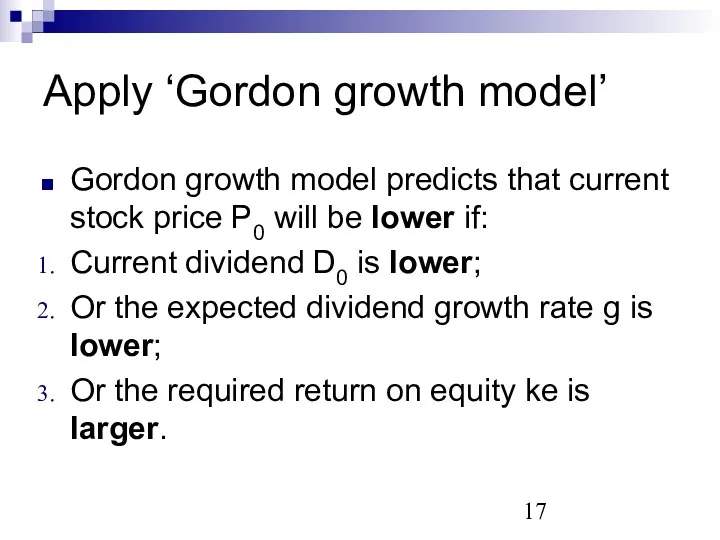
- 17. Apply ‘Gordon growth model’ Gordon growth model predicts that current stock price P0 will be lower
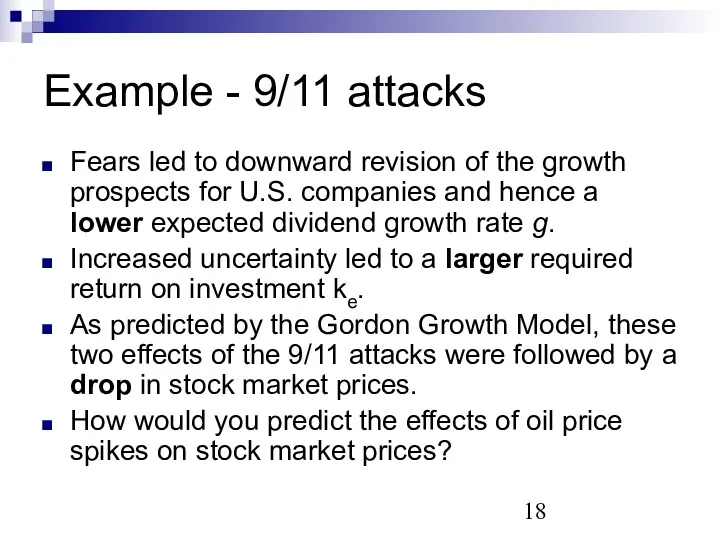
- 18. Example - 9/11 attacks Fears led to downward revision of the growth prospects for U.S. companies
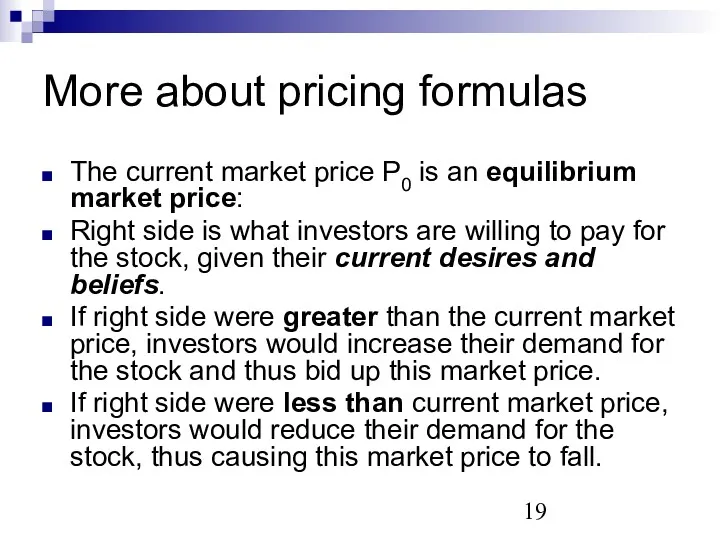
- 19. More about pricing formulas The current market price P0 is an equilibrium market price: Right side
- 21. Скачать презентацию
Review
Term structure of interest rate
Yield curve
Expectations theory
long-term interest rate = average
Review
Term structure of interest rate
Yield curve
Expectations theory
long-term interest rate = average
Interpret the yield curve using liquidity premium theory
You can figure out
Interpret the yield curve using liquidity premium theory
You can figure out
Stocks
A share of stock is a claim on the net income
Stocks
A share of stock is a claim on the net income
Rights of shareholders
Shareholders (stockholders) have ownership interest in the company proportional
Rights of shareholders
Shareholders (stockholders) have ownership interest in the company proportional
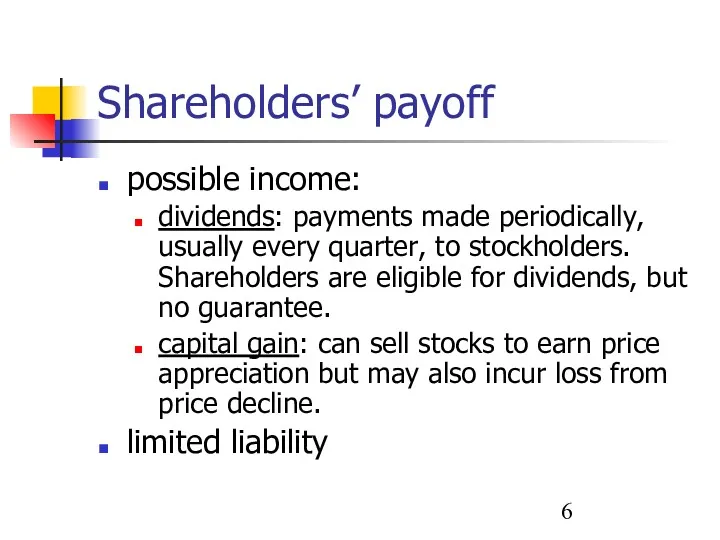
Shareholders’ payoff
possible income:
dividends: payments made periodically, usually every quarter, to stockholders.
Shareholders’ payoff
possible income:
dividends: payments made periodically, usually every quarter, to stockholders.
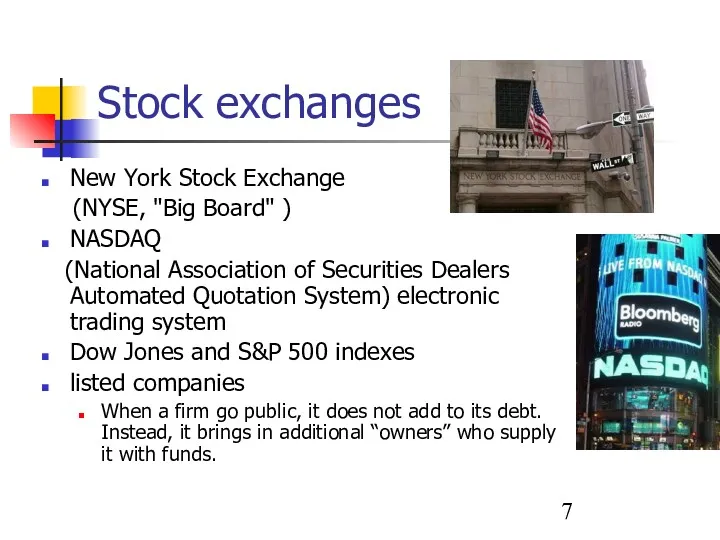
Stock exchanges
New York Stock Exchange
(NYSE, "Big Board" )
NASDAQ
(National
Stock exchanges
New York Stock Exchange
(NYSE, "Big Board" )
NASDAQ
(National
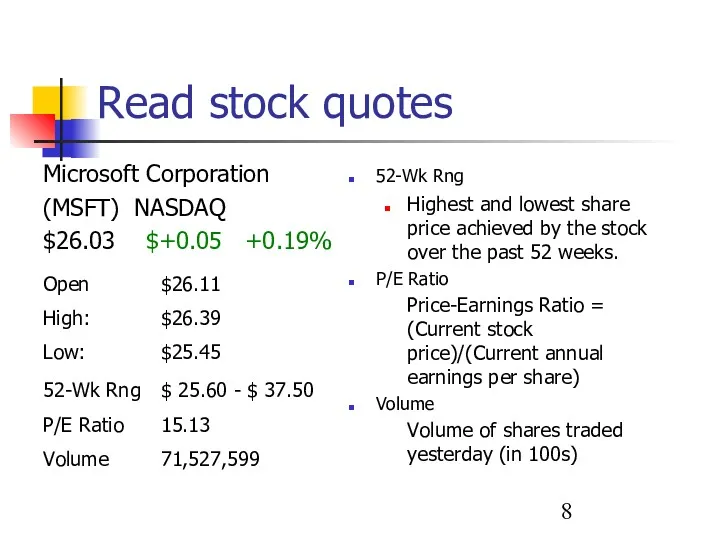
Read stock quotes
52-Wk Rng
Highest and lowest share price achieved by
Read stock quotes
52-Wk Rng
Highest and lowest share price achieved by
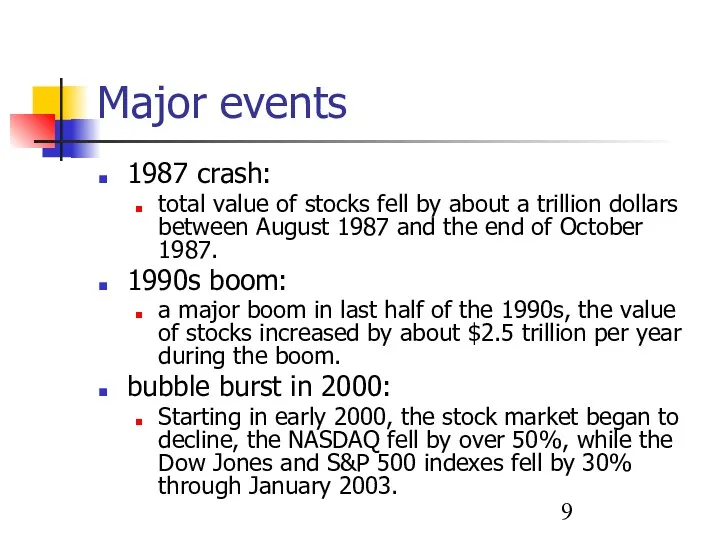
Major events
1987 crash:
total value of stocks fell by about a
Major events
1987 crash:
total value of stocks fell by about a
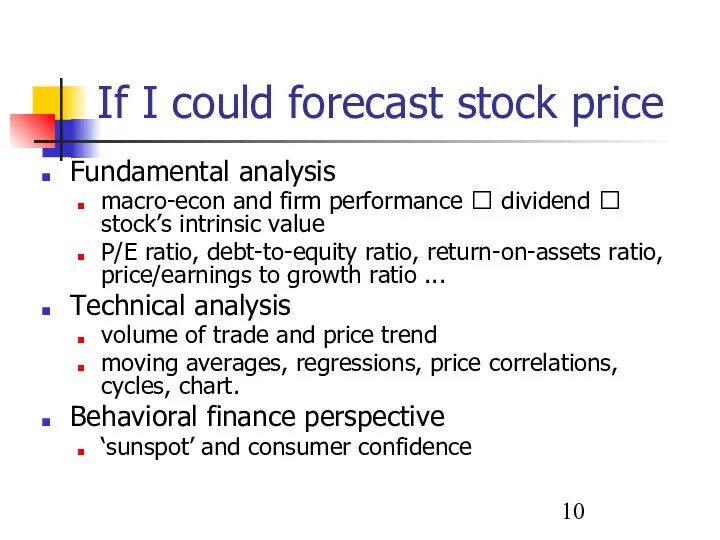
If I could forecast stock price
Fundamental analysis
macro-econ and firm performance
If I could forecast stock price
Fundamental analysis
macro-econ and firm performance
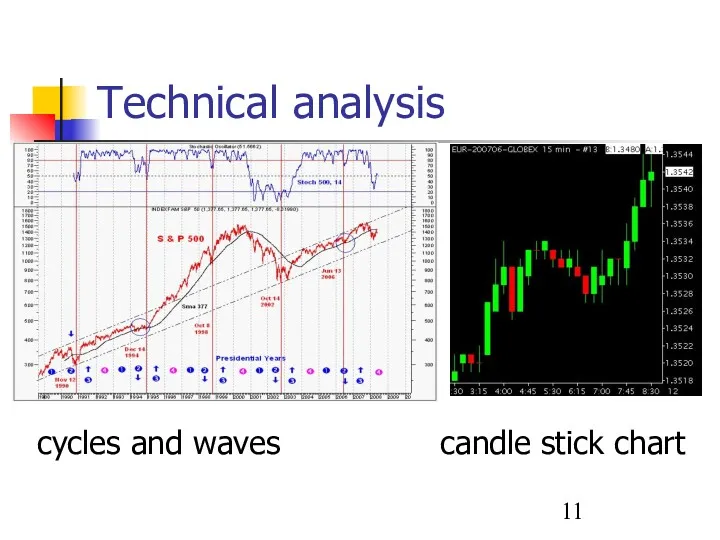
Technical analysis
cycles and waves candle stick chart
Technical analysis
cycles and waves candle stick chart
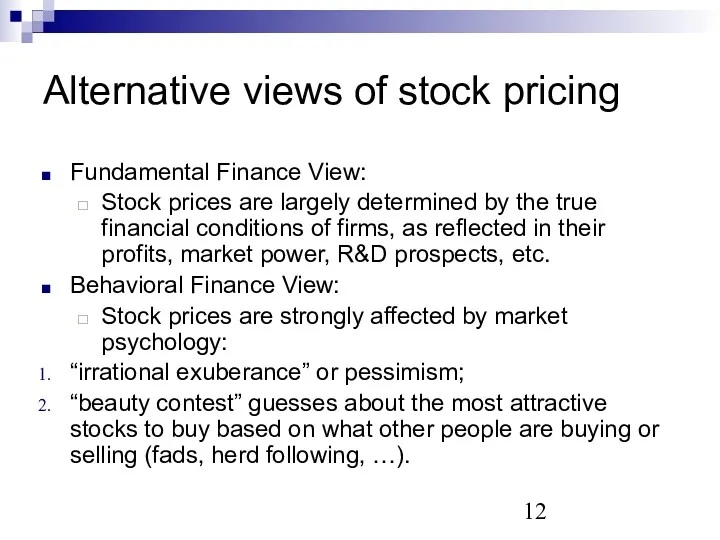
Alternative views of stock pricing
Fundamental Finance View:
Stock prices are largely
Alternative views of stock pricing
Fundamental Finance View:
Stock prices are largely
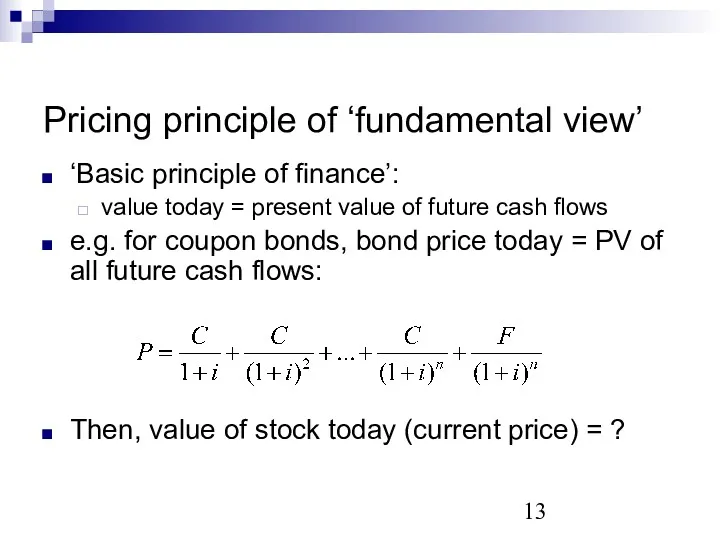
Pricing principle of ‘fundamental view’
‘Basic principle of finance’:
value today = present
Pricing principle of ‘fundamental view’
‘Basic principle of finance’:
value today = present
One-period valuation model
current stock price = PV of all future cash
One-period valuation model
current stock price = PV of all future cash
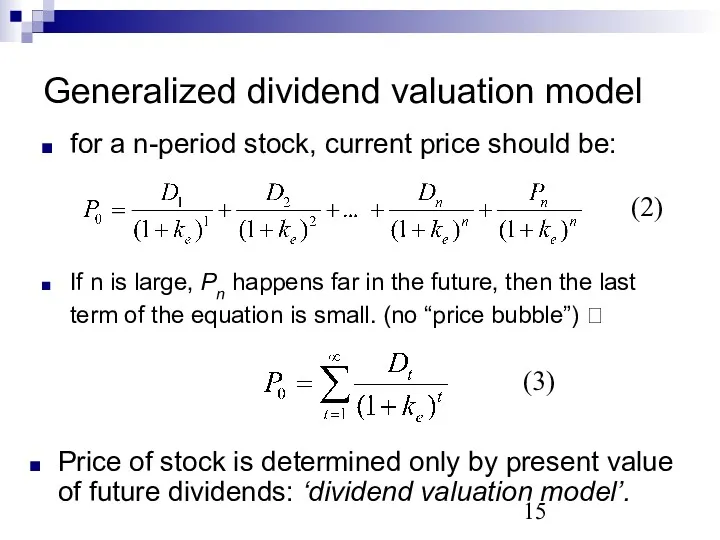
If n is large, Pn happens far in the future, then
If n is large, Pn happens far in the future, then
Gordon growth model
Assume dividend growth is a constant, denote as g
Gordon growth model
Assume dividend growth is a constant, denote as g
Apply ‘Gordon growth model’
Gordon growth model predicts that current stock price
Apply ‘Gordon growth model’
Gordon growth model predicts that current stock price
Example - 9/11 attacks
Fears led to downward revision of the
Example - 9/11 attacks
Fears led to downward revision of the
More about pricing formulas
The current market price P0 is an equilibrium
More about pricing formulas
The current market price P0 is an equilibrium
 Пётр Ильич Чайковский (1840–1893)
 1917 год: от февраля к октябрю
 Опорно-двигательная система человека. Скелет головы
 Презентация Лащенко
 Оксиды серы (IV) и (VI). Производство серной кислоты
 Государственный фонд развития промышленности Московской области
 Наблюдение за насекомыми
 16 ноября- Международный день толерантности
 Занятие по дополнительной образовательной программе Микробиология для школьников по теме: Водоросли, их строение. Биологические особенности
 Загрязнение гидросферы. Материалы к урокам географии и экологии.
 Л_1_СТ_Фізико_технічні_основи_променевої_діагностики_
 Конфликты и способы их разрешения.
 Мораль. Человек и общество
 Периодический закон и периодическая система химических элементов.
 Точность, взаимозаменяемость деталей и узлов столярных изделий
 Podstawy finansów. Rachunek wyników
 Михаил Юрьевич Лермонтов 15 октября 1814 года – 27 июля 1841 года. Русский поэт, прозаик, драматург, художник
 Денсаулық сақтауды жоспарлаудың, қаржыландырудың қазіргі кездегі проблемалары
 Проект по строительству завода по производству высококачественных нефтепродуктов на территории Свердловской области
 Згурський Петро. Студентський парламент
 Psikhologia_organizatsii_1
 Информационная система ЖИВУ.РФ
 Отчёт о прохождении производственной практики в строительной компании ООО СК УРАЛПОЛ
 Где логика? Интерактивная игра
 Роль и назначение международных стандартов финансовой отчетности (МСФО). Порядок создания МСФО
 Семь мудрецов Древней Греции
 История престольного праздника День Святых Первоверховных апостолов Петра и Павла
 Биологические науки. Интерактивный кроссворд