- Summary of Approach Simulations to Assess VHF Compatibility for GLS/ILS/VOR

Содержание
- 2. Overview Summary of Issue Simulation Description Scenarios Results
- 3. Summary of Issue Several navigation aids share the same VHF spectrum (108 – 118 MHz) VDB
- 4. Summary of Issue, Continued Aircraft installation contributes to D/U limits Antenna gain variation due to difference
- 5. Simulation Overview and Purpose Model nav aid transmitters, including transmission loss (ILS, VOR, VDB) Model aircraft
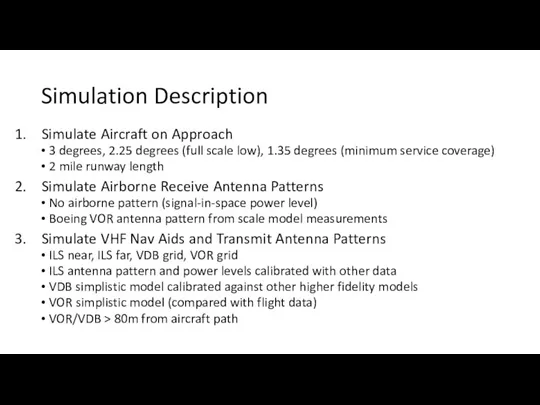
- 6. Simulation Description Simulate Aircraft on Approach 3 degrees, 2.25 degrees (full scale low), 1.35 degrees (minimum
- 7. 1. Simulate Aircraft on Approach (not to scale) ILS Near ILS Far VDB / VOR Grid
- 8. The green grid denotes the modeled area (only covers one side of the runway) Runway Length:
- 9. Aircraft positions simulated every 0.002 nmi Aircraft positions simulated every 0.01 nmi Additional Position Sampling Resolution
- 10. 2. Simulate Airborne Antenna Patterns Simulate no Airborne Antenna Pattern Provides Signal-In-Space Desired / Undesired ratio
- 11. 3. Simulate VHF Nav Aids and Transmit Patterns ILS LOC VOR VDB
- 12. 1. Simulate ILS LOC Signal Strength ILS Localizer Antenna Pattern Source: Stefan Müller and Felix Butsch
- 13. ILS Signal Strength Equation FSPL(distance = 10*log10(distance) + 20*log10(108 MHz) – 147.55 + 29.1527 FSPL(distance >822.7611
- 14. Simulated Approach Height vs. LOC Distance Comparing simulated antenna heights with heights above LOC antenna simulated
- 15. Has same general shape, differences could be due to differences in Ground Antenna Gain from the
- 16. Due to a jump in the traced Transmitter gain antenna Recreating Navcom ILS overflight plots with
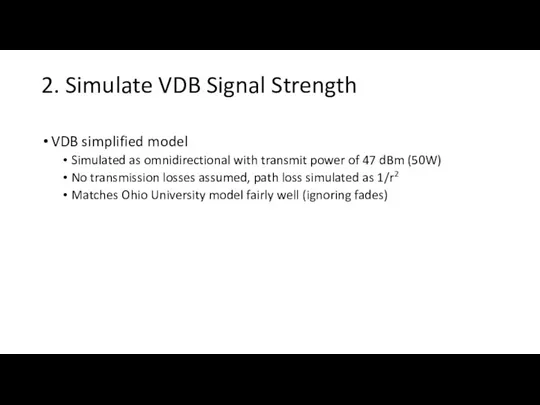
- 17. 2. Simulate VDB Signal Strength VDB simplified model Simulated as omnidirectional with transmit power of 47
- 18. Compare Simple VDB Model (Red) with Ohio University EM Model and Flight Measurements From: Skidmore, Wilson,
- 19. Comparing HPOL Results
- 20. Difference OU HPOL Sim and Simple Model Matches roughly well within +/-5dB, not accounting for fades
- 21. 3. Simulate VOR Signal Strength VOR simplified model Simulated as +6dB gain below 60 degrees elevation,
- 22. Compare Simple VOR Model with Bremen Flight Inspection Measurements The EIRP is set as 53 dBm
- 23. Bremen test data vs Simulated VOR Signal (No Simulated Aircraft Antenna) 27 Approach, Go Around –
- 24. Bremen test data vs Simulated VOR Signal (No Simulated Aircraft Antenna) 09 Approach – VOR overflight
- 25. Transmit Simplified Models Summary ILS LOC Simplified model based on NavCom gain vs. el and 1/R,
- 26. D/U Simulation Results
- 27. D/U Simulation Scenarios VDB Desired / ILS Near Undesired VDB Desired / ILS Far Undesired VDB
- 28. VDB Desired / ILS Near Undesired VDB Location Grid and ILS Near Stable Location Scatter plots
- 29. Formulas EIRPVDB = 47 dBm [1] EIRPILS in the main beam = 60 dBm [1] Gtransmitter,VDB
- 30. Explanation on the Scatter plots Each circle corresponds with a GBAS antenna location. If the dot
- 31. Full A/C Flight Path
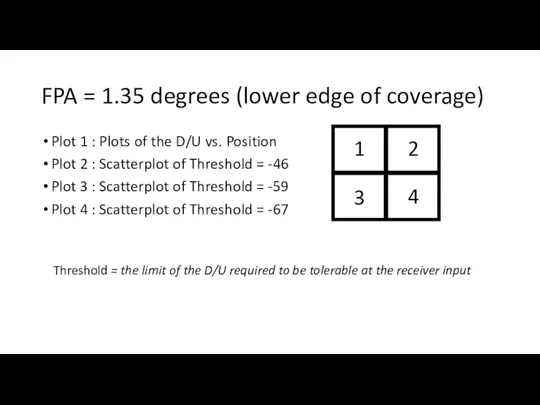
- 32. FPA = 1.35 degrees (lower edge of coverage) Plot 1 : Plots of the D/U vs.
- 33. 1.35 Degrees, No Antenna , U = ILS Near
- 34. 1.35 Degrees, Boeing VOR , U = ILS Near
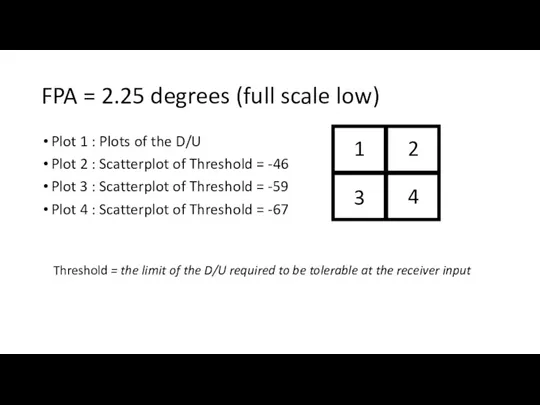
- 35. FPA = 2.25 degrees (full scale low) Plot 1 : Plots of the D/U Plot 2
- 36. 2.25 Degrees, No Antenna , U = ILS Near
- 37. 2.25 Degrees, Boeing VOR , U = ILS Near
- 38. FPA = 3 degrees (On Glideslope) Plot 1 : Plots of the D/U Plot 2 :
- 39. 3 Degrees, No Antenna , U = ILS Near
- 40. 3 Degrees, Boeing VOR , U = ILS Near
- 41. A/C Flight Path to 200 ft
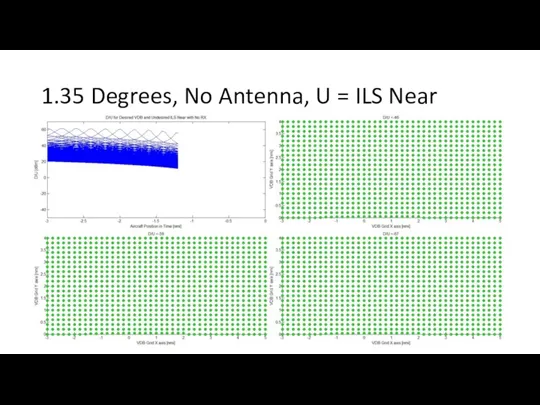
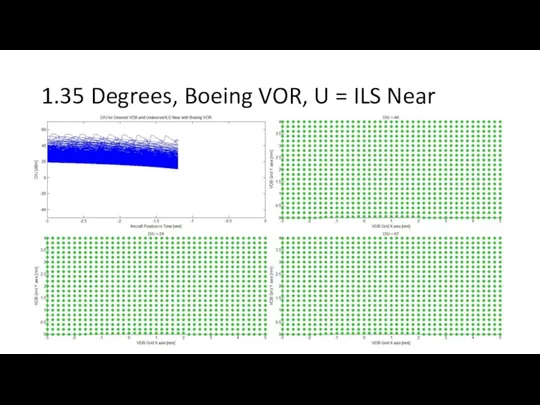
- 42. FPA = 1.35 degrees (Lowest Coverage) Plot 1 : Plots of the D/U Plot 2 :
- 43. 1.35 Degrees, No Antenna, U = ILS Near
- 44. 1.35 Degrees, Boeing VOR, U = ILS Near
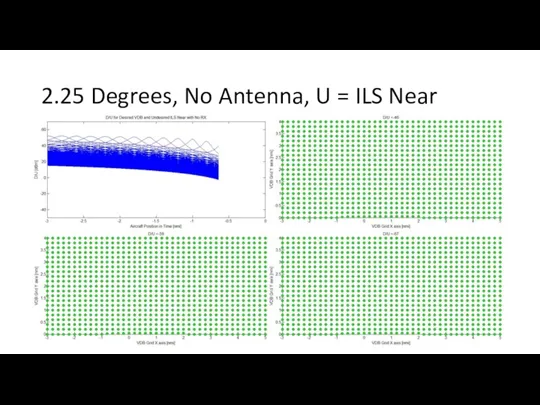
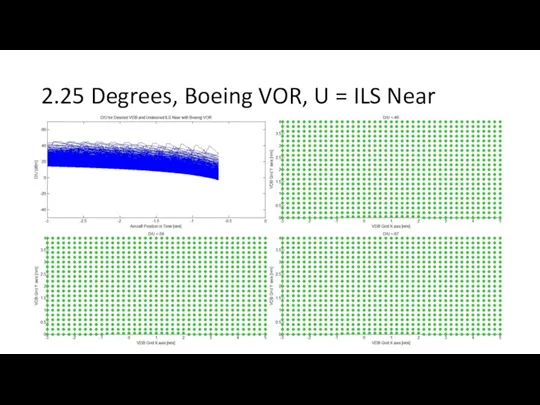
- 45. FPA = 2.25 degrees (Full Scale Low) Plot 1 : Plots of the D/U Plot 2
- 46. 2.25 Degrees, No Antenna, U = ILS Near
- 47. 2.25 Degrees, Boeing VOR, U = ILS Near
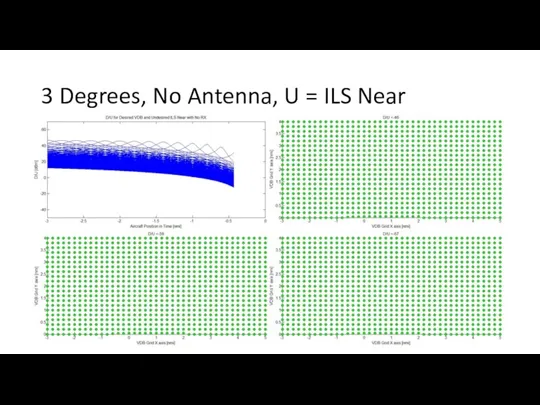
- 48. FPA = 3 degrees (On Glideslope) Plot 1 : Plots of the D/U Plot 2 :
- 49. 3 Degrees, No Antenna, U = ILS Near
- 50. 3 Degrees, Boeing VOR, U = ILS Near
- 51. Summary VDB / ILS Near D/U Antenna Gain Variation Contribution to worst case D/U at the
- 52. VDB Desired / ILS Far Undesired VDB Location Grid and ILS Far Stable Location Scatter plots
- 53. Formulas EIRPVDB = 47 dBm [1] EIRPILS in the main beam = 60 dBm [1] GTransmitter,VDB
- 54. Full A/C Flight Path
- 55. 1.35 Degrees, No Antenna, U = ILS Far
- 56. 2.25 Degrees, No Antenna, U = ILS Far
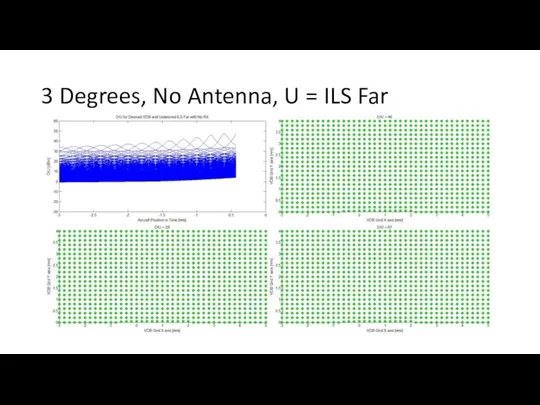
- 57. 3 Degrees, No Antenna, U = ILS Far
- 58. A/C Flight Path to 200 ft
- 59. 1.35 Degrees, No Antenna, U = ILS Far
- 60. 2.25 Degrees, No Antenna, U = ILS Far
- 61. 3 Degrees, No Antenna, U = ILS Far
- 62. Summary VDB / ILS Far D/U Antenna Gain Variation Contribution to worst case D/U at the
- 63. VDB Desired / VOR Undesired VDB Location Grid and VOR Location Grid Scatter plots for VDB
- 64. Assumptions VOR antenna is 10 meters above the ground VDB antenna is 10 meters above the
- 65. Formulas EIRPVDB = 47 dBm [1] EIRPVOR = 50 dBm [1] GTransmitter,VDB = 0 dB (Isotropic
- 66. Full A/C Flight Path
- 67. 1.35 Degrees, No Antenna, Points = VDB Note: The size for locations with the number of
- 68. 1.35 Degrees, No Antenna, Points = VOR Note: The size for locations with the number of
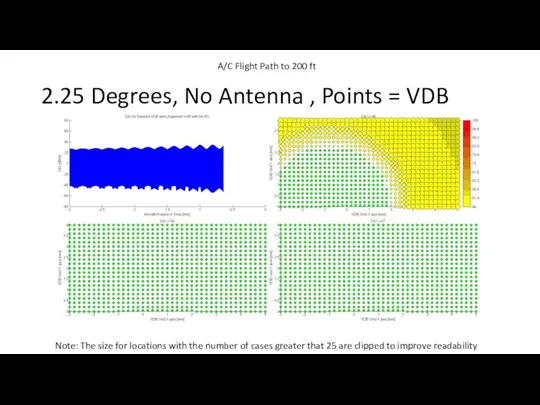
- 69. 2.25 Degrees, No Antenna , Points = VDB Note: The size for locations with the number
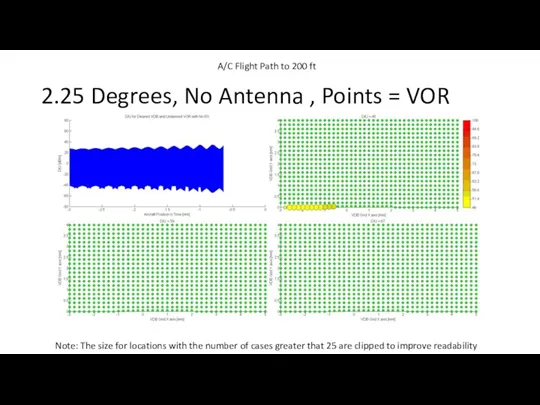
- 70. 2.25 Degrees, No Antenna , Points = VOR Note: The size for locations with the number
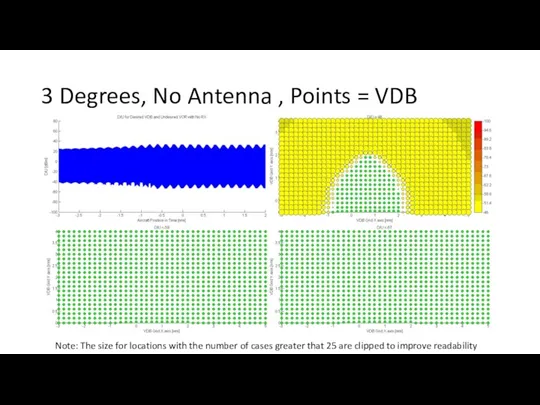
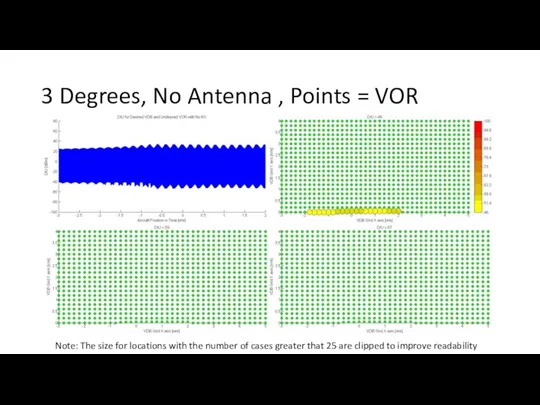
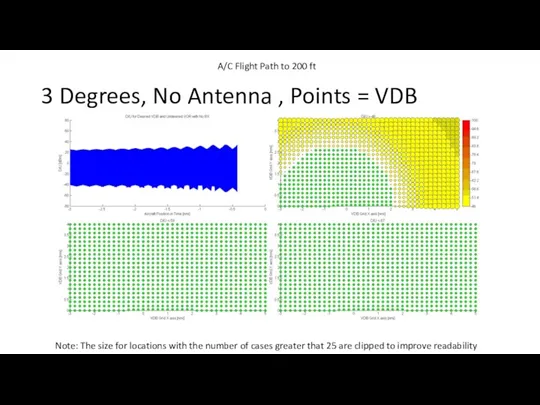
- 71. 3 Degrees, No Antenna , Points = VDB Note: The size for locations with the number
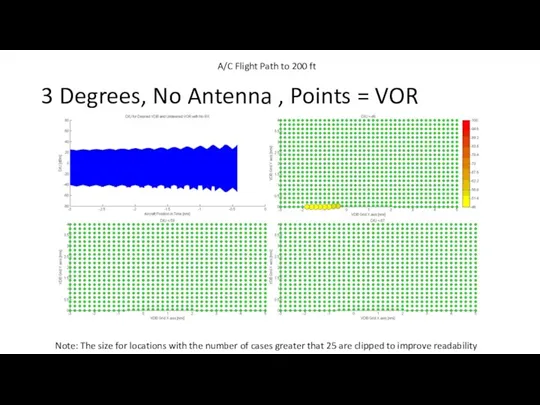
- 72. 3 Degrees, No Antenna , Points = VOR Note: The size for locations with the number
- 73. A/C Flight Path to 200 ft
- 74. 1.35 Degrees, No Antenna , Points = VDB Note: The size for locations with the number
- 75. 1.35 Degrees, No Antenna , Points = VOR Note: The size for locations with the number
- 76. 2.25 Degrees, No Antenna , Points = VDB Note: The size for locations with the number
- 77. 2.25 Degrees, No Antenna , Points = VOR Note: The size for locations with the number
- 78. 3 Degrees, No Antenna , Points = VDB Note: The size for locations with the number
- 79. 3 Degrees, No Antenna , Points = VOR Note: The size for locations with the number
- 81. Скачать презентацию
Overview
Summary of Issue
Simulation Description
Scenarios
Results
Overview
Summary of Issue
Simulation Description
Scenarios
Results
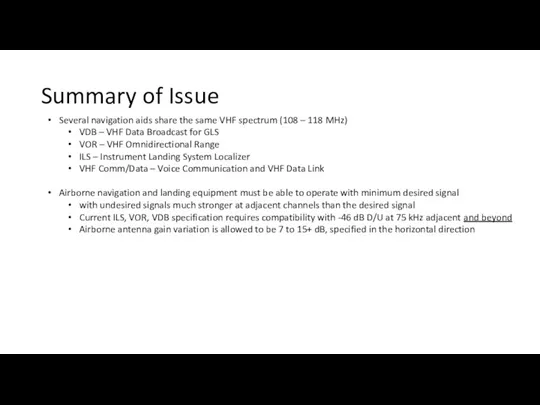
Summary of Issue
Several navigation aids share the same VHF spectrum (108
Summary of Issue
Several navigation aids share the same VHF spectrum (108
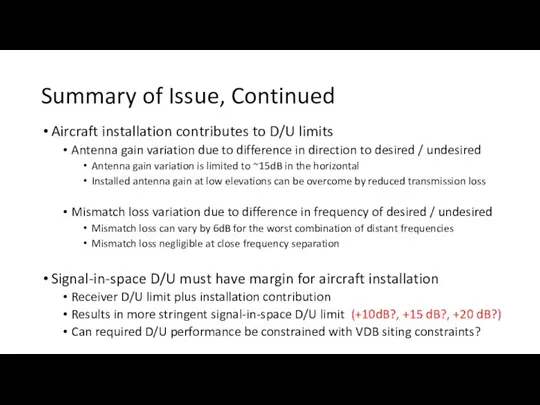
Summary of Issue, Continued
Aircraft installation contributes to D/U limits
Antenna gain variation
Summary of Issue, Continued
Aircraft installation contributes to D/U limits
Antenna gain variation
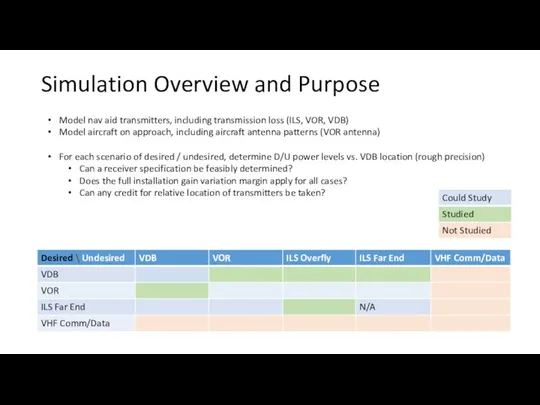
Simulation Overview and Purpose
Model nav aid transmitters, including transmission loss (ILS,
Simulation Overview and Purpose
Model nav aid transmitters, including transmission loss (ILS,
Simulation Description
Simulate Aircraft on Approach
3 degrees, 2.25 degrees (full scale low),
Simulation Description
Simulate Aircraft on Approach
3 degrees, 2.25 degrees (full scale low),
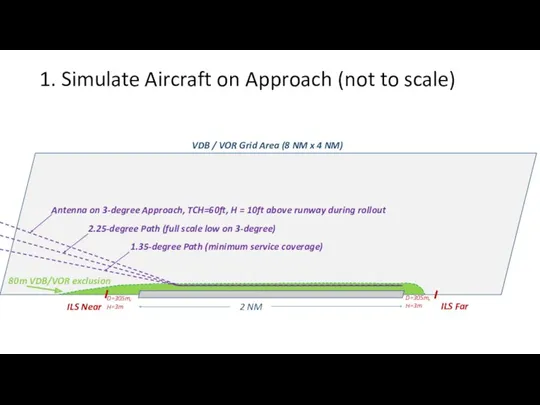
1. Simulate Aircraft on Approach (not to scale)
ILS Near
ILS Far
VDB /
1. Simulate Aircraft on Approach (not to scale)
ILS Near
ILS Far
VDB /
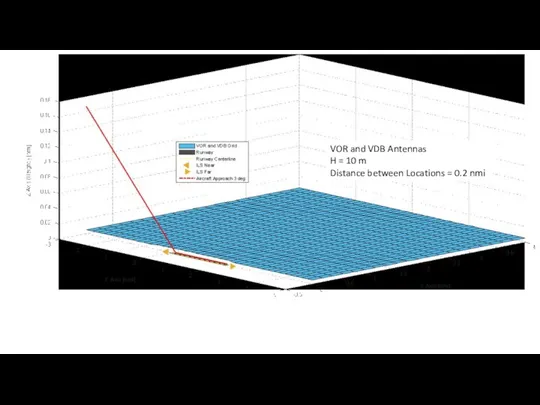
The green grid denotes the modeled area (only covers one side
The green grid denotes the modeled area (only covers one side
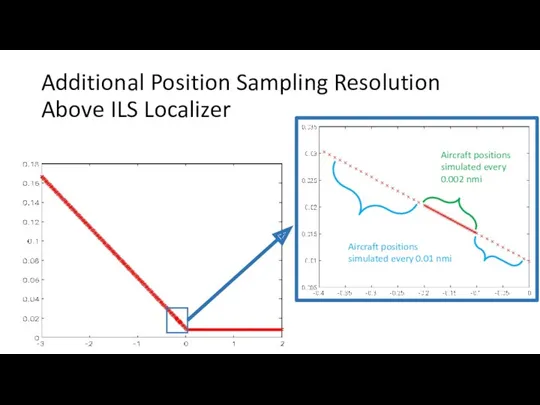
Aircraft positions simulated every 0.002 nmi
Aircraft positions simulated every 0.01 nmi
Additional
Aircraft positions simulated every 0.002 nmi
Aircraft positions simulated every 0.01 nmi
Additional
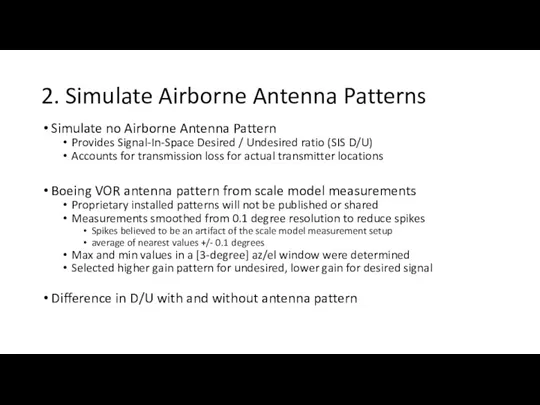
2. Simulate Airborne Antenna Patterns
Simulate no Airborne Antenna Pattern
Provides Signal-In-Space Desired
2. Simulate Airborne Antenna Patterns
Simulate no Airborne Antenna Pattern
Provides Signal-In-Space Desired
3. Simulate VHF Nav Aids and Transmit Patterns
ILS LOC
VOR
VDB
3. Simulate VHF Nav Aids and Transmit Patterns
ILS LOC
VOR
VDB
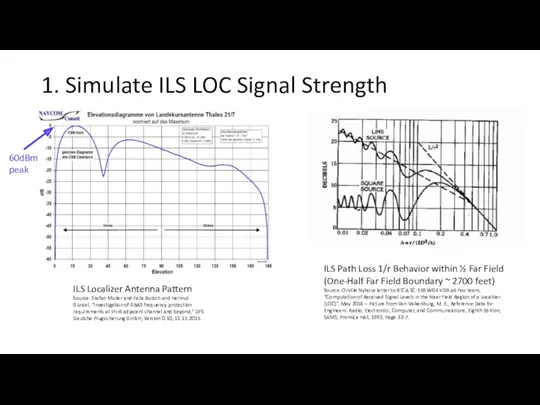
1. Simulate ILS LOC Signal Strength
ILS Localizer Antenna Pattern
Source: Stefan Müller
1. Simulate ILS LOC Signal Strength
ILS Localizer Antenna Pattern
Source: Stefan Müller
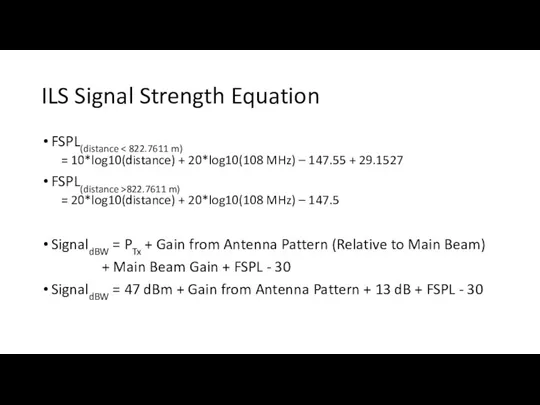
ILS Signal Strength Equation
FSPL(distance < 822.7611 m)
= 10*log10(distance) + 20*log10(108
ILS Signal Strength Equation
FSPL(distance < 822.7611 m)
= 10*log10(distance) + 20*log10(108
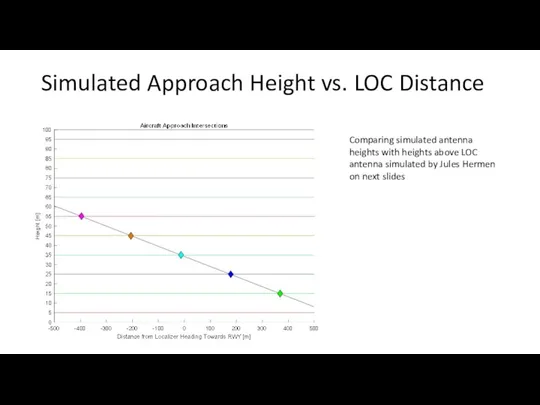
Simulated Approach Height vs. LOC Distance
Comparing simulated antenna heights with heights
Simulated Approach Height vs. LOC Distance
Comparing simulated antenna heights with heights
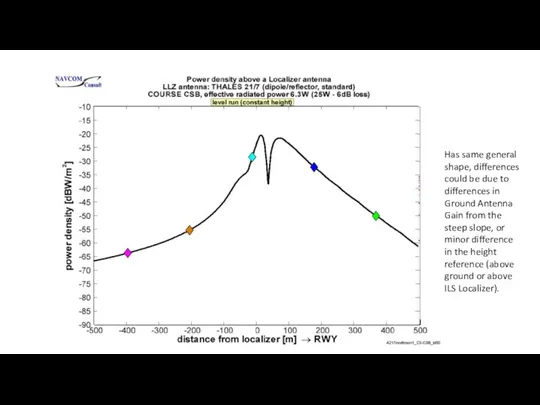
Has same general shape, differences could be due to differences in
Has same general shape, differences could be due to differences in
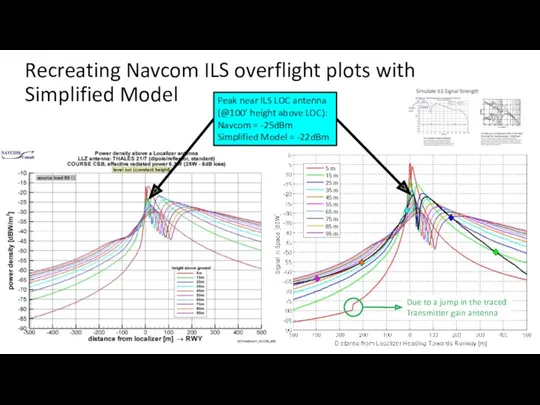
Due to a jump in the traced Transmitter gain antenna
Recreating Navcom
Due to a jump in the traced Transmitter gain antenna
Recreating Navcom
2. Simulate VDB Signal Strength
VDB simplified model
Simulated as omnidirectional with transmit
2. Simulate VDB Signal Strength
VDB simplified model
Simulated as omnidirectional with transmit
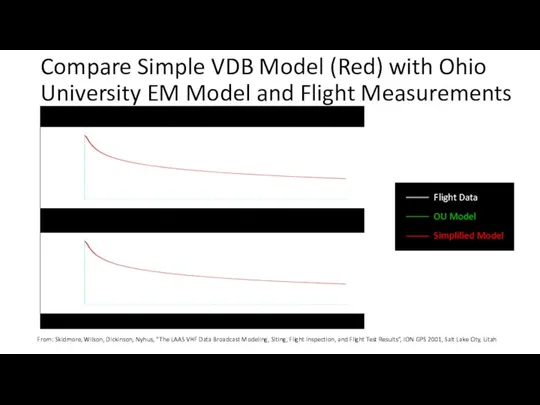
Compare Simple VDB Model (Red) with Ohio University EM Model and
Compare Simple VDB Model (Red) with Ohio University EM Model and
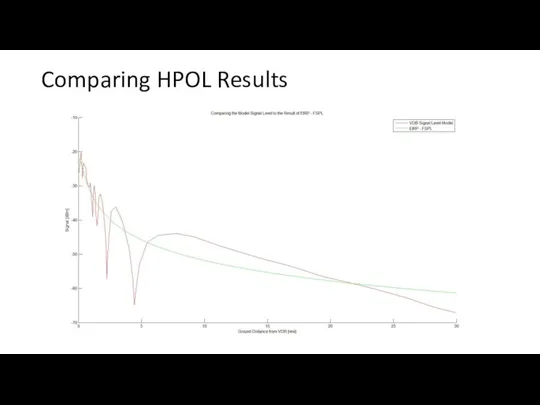
Comparing HPOL Results
Comparing HPOL Results
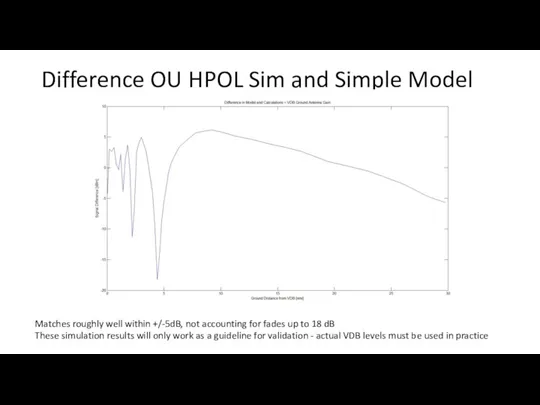
Difference OU HPOL Sim and Simple Model
Matches roughly well within +/-5dB,
Difference OU HPOL Sim and Simple Model
Matches roughly well within +/-5dB,
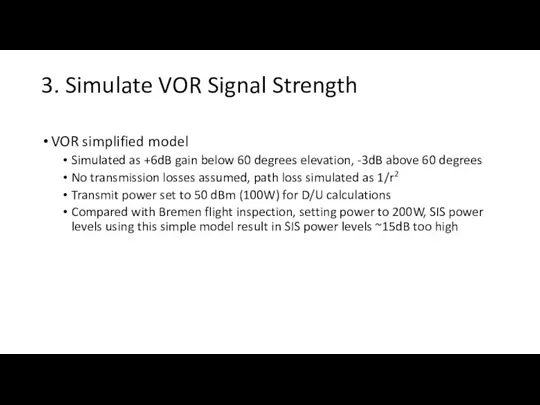
3. Simulate VOR Signal Strength
VOR simplified model
Simulated as +6dB gain below
3. Simulate VOR Signal Strength
VOR simplified model
Simulated as +6dB gain below
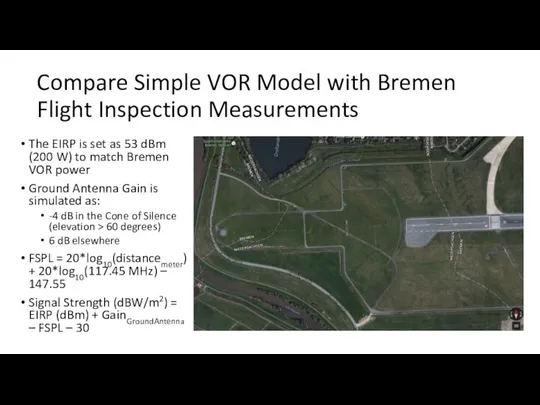
Compare Simple VOR Model with Bremen Flight Inspection Measurements
The EIRP is
Compare Simple VOR Model with Bremen Flight Inspection Measurements
The EIRP is
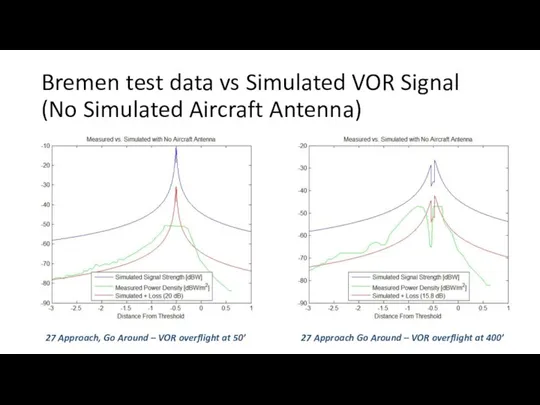
Bremen test data vs Simulated VOR Signal
(No Simulated Aircraft Antenna)
27 Approach,
Bremen test data vs Simulated VOR Signal
(No Simulated Aircraft Antenna)
27 Approach,
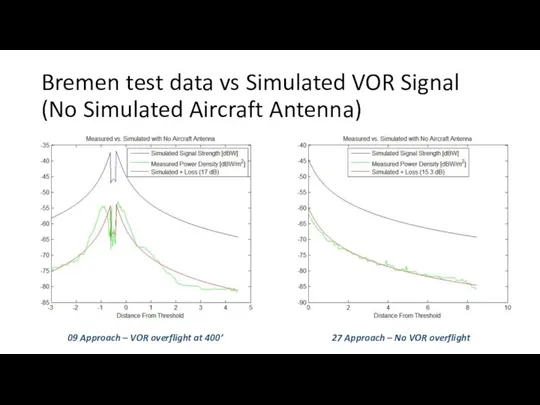
Bremen test data vs Simulated VOR Signal
(No Simulated Aircraft Antenna)
09 Approach
Bremen test data vs Simulated VOR Signal
(No Simulated Aircraft Antenna)
09 Approach
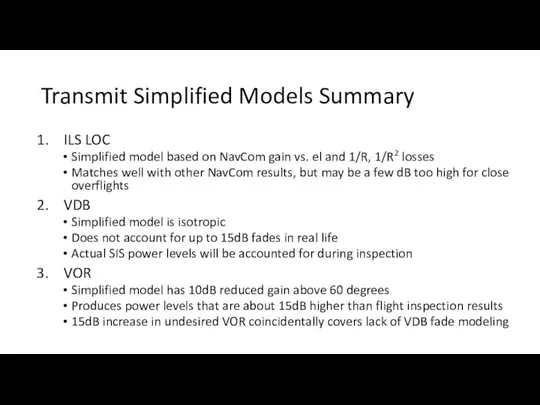
Transmit Simplified Models Summary
ILS LOC
Simplified model based on NavCom gain vs.
Transmit Simplified Models Summary
ILS LOC
Simplified model based on NavCom gain vs.
D/U Simulation Results
D/U Simulation Results
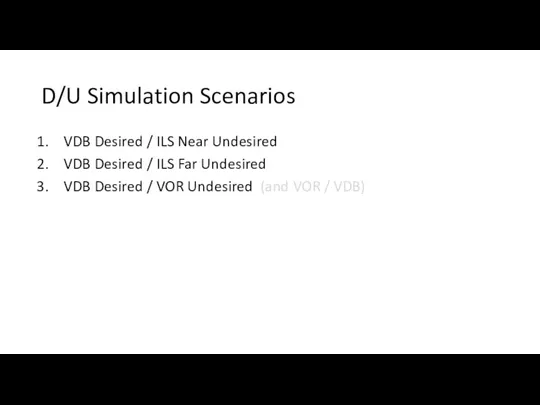
D/U Simulation Scenarios
VDB Desired / ILS Near Undesired
VDB Desired / ILS
D/U Simulation Scenarios
VDB Desired / ILS Near Undesired
VDB Desired / ILS
VDB Desired / ILS Near Undesired
VDB Location Grid and ILS
VDB Desired / ILS Near Undesired
VDB Location Grid and ILS
![Formulas EIRPVDB = 47 dBm [1] EIRPILS in the main](/_ipx/f_webp&q_80&fit_contain&s_1440x1080/imagesDir/jpg/356778/slide-28.jpg)
Formulas
EIRPVDB = 47 dBm [1]
EIRPILS in the main beam = 60
Formulas
EIRPVDB = 47 dBm [1]
EIRPILS in the main beam = 60
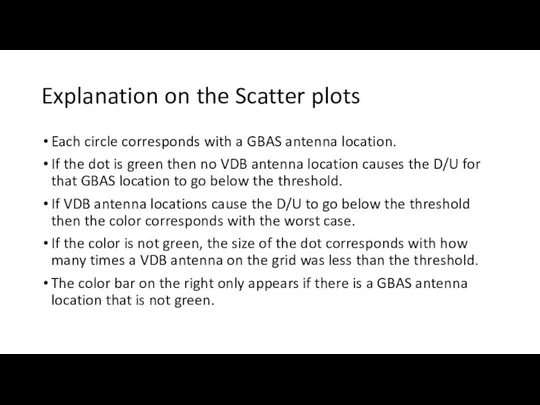
Explanation on the Scatter plots
Each circle corresponds with a GBAS antenna
Explanation on the Scatter plots
Each circle corresponds with a GBAS antenna

Full A/C Flight Path
Full A/C Flight Path
FPA = 1.35 degrees (lower edge of coverage)
Plot 1 : Plots
FPA = 1.35 degrees (lower edge of coverage)
Plot 1 : Plots
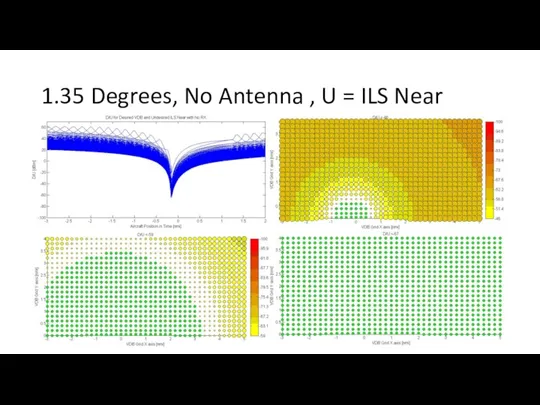
1.35 Degrees, No Antenna , U = ILS Near
1.35 Degrees, No Antenna , U = ILS Near
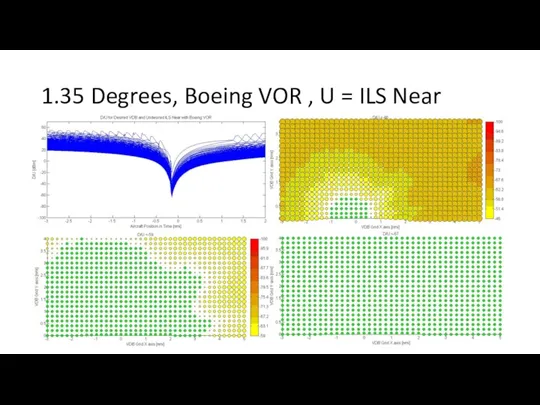
1.35 Degrees, Boeing VOR , U = ILS Near
1.35 Degrees, Boeing VOR , U = ILS Near
FPA = 2.25 degrees (full scale low)
Plot 1 : Plots of
FPA = 2.25 degrees (full scale low)
Plot 1 : Plots of
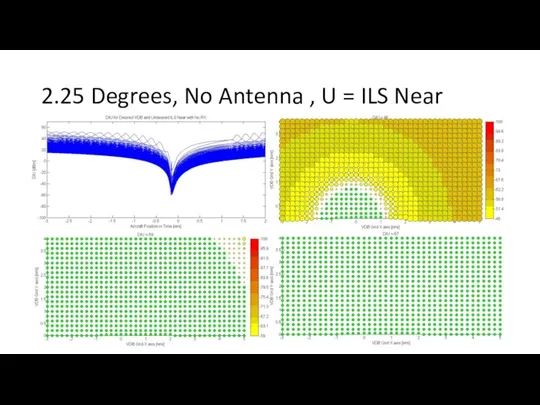
2.25 Degrees, No Antenna , U = ILS Near
2.25 Degrees, No Antenna , U = ILS Near
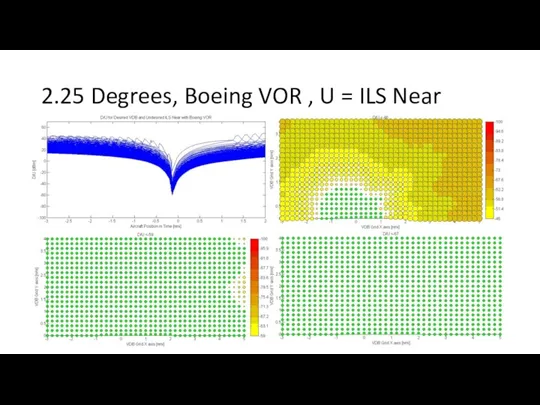
2.25 Degrees, Boeing VOR , U = ILS Near
2.25 Degrees, Boeing VOR , U = ILS Near
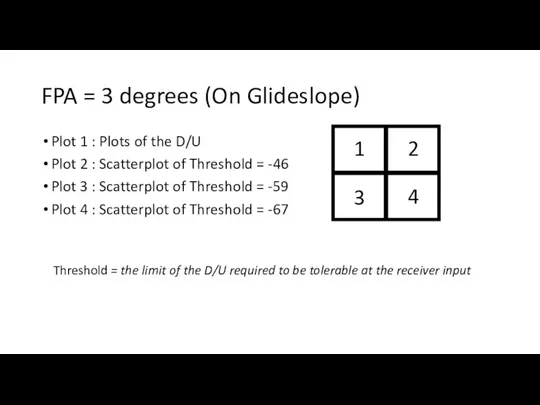
FPA = 3 degrees (On Glideslope)
Plot 1 : Plots of the
FPA = 3 degrees (On Glideslope)
Plot 1 : Plots of the
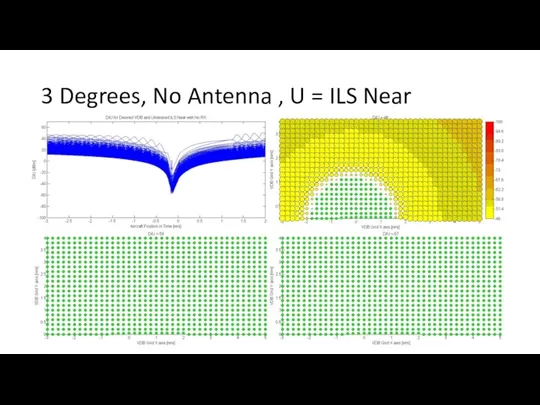
3 Degrees, No Antenna , U = ILS Near
3 Degrees, No Antenna , U = ILS Near
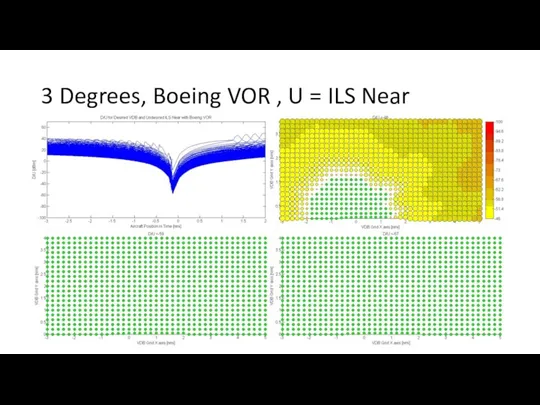
3 Degrees, Boeing VOR , U = ILS Near
3 Degrees, Boeing VOR , U = ILS Near

A/C Flight Path to 200 ft
A/C Flight Path to 200 ft
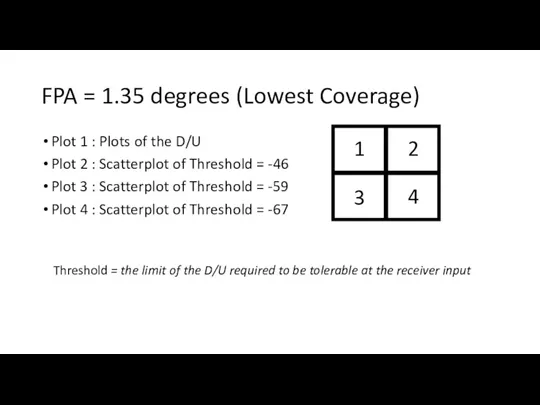
FPA = 1.35 degrees (Lowest Coverage)
Plot 1 : Plots of the
FPA = 1.35 degrees (Lowest Coverage)
Plot 1 : Plots of the
1.35 Degrees, No Antenna, U = ILS Near
1.35 Degrees, No Antenna, U = ILS Near
1.35 Degrees, Boeing VOR, U = ILS Near
1.35 Degrees, Boeing VOR, U = ILS Near

FPA = 2.25 degrees (Full Scale Low)
Plot 1 : Plots of
FPA = 2.25 degrees (Full Scale Low)
Plot 1 : Plots of
2.25 Degrees, No Antenna, U = ILS Near
2.25 Degrees, No Antenna, U = ILS Near
2.25 Degrees, Boeing VOR, U = ILS Near
2.25 Degrees, Boeing VOR, U = ILS Near

FPA = 3 degrees (On Glideslope)
Plot 1 : Plots of the
FPA = 3 degrees (On Glideslope)
Plot 1 : Plots of the
3 Degrees, No Antenna, U = ILS Near
3 Degrees, No Antenna, U = ILS Near

3 Degrees, Boeing VOR, U = ILS Near
3 Degrees, Boeing VOR, U = ILS Near
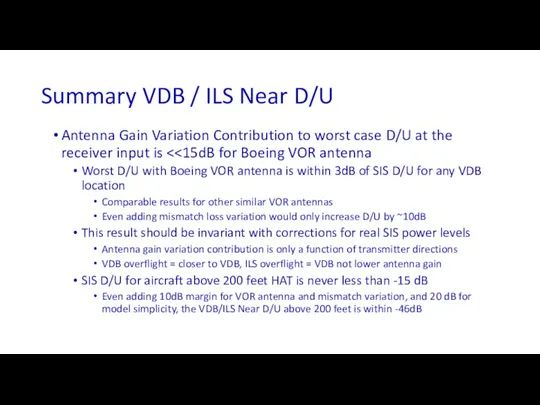
Summary VDB / ILS Near D/U
Antenna Gain Variation Contribution to worst
Summary VDB / ILS Near D/U
Antenna Gain Variation Contribution to worst
VDB Desired / ILS Far Undesired
VDB Location Grid and ILS Far
VDB Desired / ILS Far Undesired
VDB Location Grid and ILS Far
![Formulas EIRPVDB = 47 dBm [1] EIRPILS in the main](/_ipx/f_webp&q_80&fit_contain&s_1440x1080/imagesDir/jpg/356778/slide-52.jpg)
Formulas
EIRPVDB = 47 dBm [1]
EIRPILS in the main beam = 60
Formulas
EIRPVDB = 47 dBm [1]
EIRPILS in the main beam = 60
Full A/C Flight Path
Full A/C Flight Path
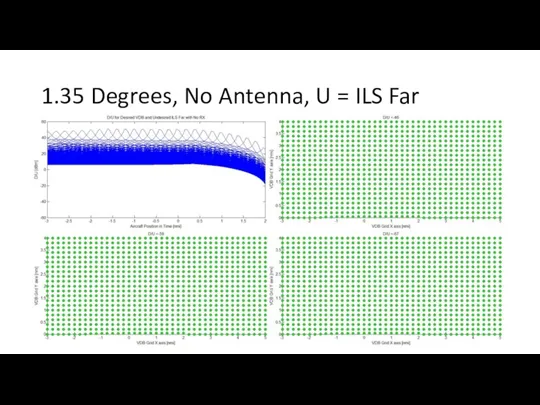
1.35 Degrees, No Antenna, U = ILS Far
1.35 Degrees, No Antenna, U = ILS Far
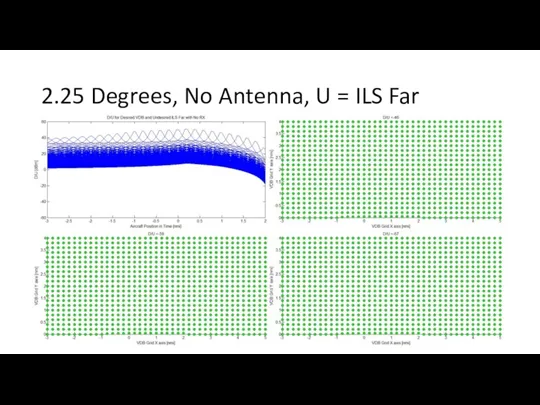
2.25 Degrees, No Antenna, U = ILS Far
2.25 Degrees, No Antenna, U = ILS Far
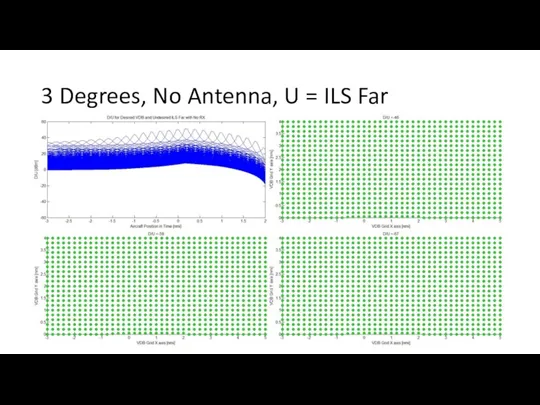
3 Degrees, No Antenna, U = ILS Far
3 Degrees, No Antenna, U = ILS Far
A/C Flight Path to 200 ft
A/C Flight Path to 200 ft
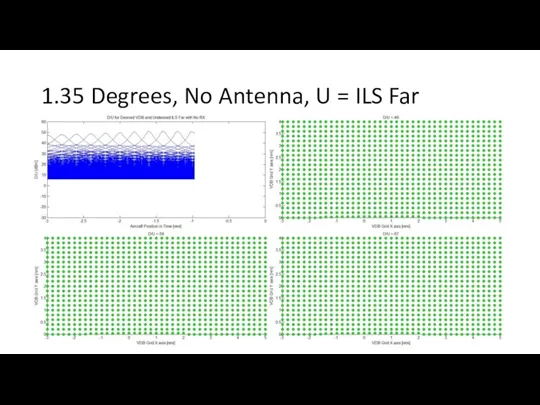
1.35 Degrees, No Antenna, U = ILS Far
1.35 Degrees, No Antenna, U = ILS Far
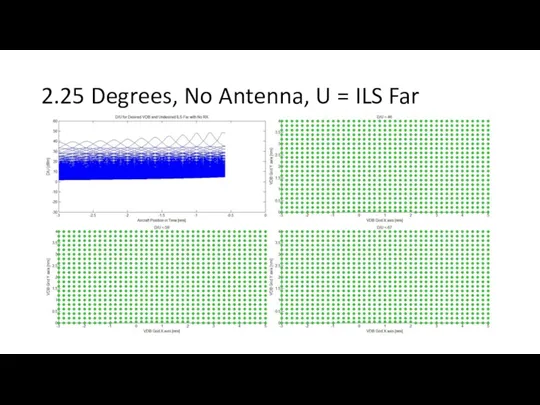
2.25 Degrees, No Antenna, U = ILS Far
2.25 Degrees, No Antenna, U = ILS Far
3 Degrees, No Antenna, U = ILS Far
3 Degrees, No Antenna, U = ILS Far
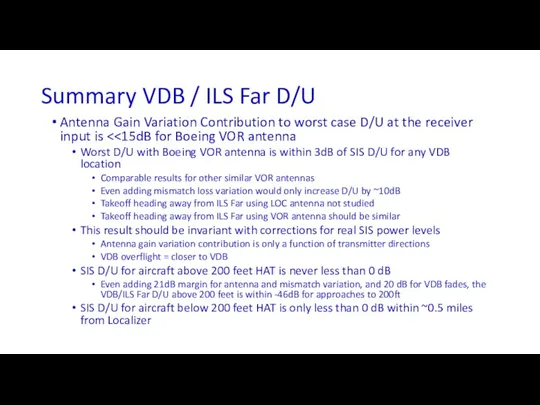
Summary VDB / ILS Far D/U
Antenna Gain Variation Contribution to worst
Summary VDB / ILS Far D/U
Antenna Gain Variation Contribution to worst
VDB Desired / VOR Undesired
VDB Location Grid and VOR Location Grid
Scatter
VDB Desired / VOR Undesired
VDB Location Grid and VOR Location Grid
Scatter
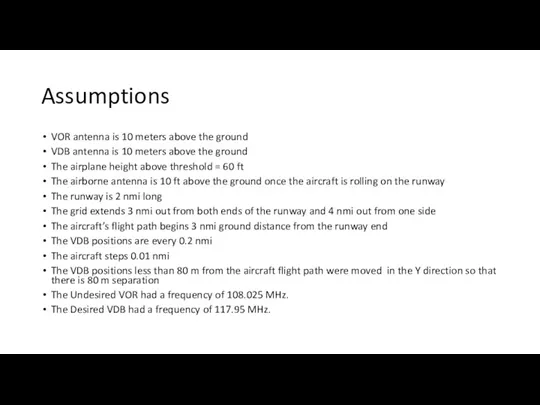
Assumptions
VOR antenna is 10 meters above the ground
VDB antenna is 10
Assumptions
VOR antenna is 10 meters above the ground
VDB antenna is 10
![Formulas EIRPVDB = 47 dBm [1] EIRPVOR = 50 dBm](/_ipx/f_webp&q_80&fit_contain&s_1440x1080/imagesDir/jpg/356778/slide-64.jpg)
Formulas
EIRPVDB = 47 dBm [1]
EIRPVOR = 50 dBm [1]
GTransmitter,VDB = 0
Formulas
EIRPVDB = 47 dBm [1]
EIRPVOR = 50 dBm [1]
GTransmitter,VDB = 0

Full A/C Flight Path
Full A/C Flight Path
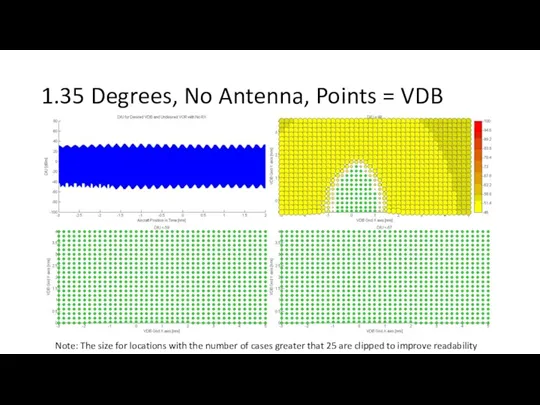
1.35 Degrees, No Antenna, Points = VDB
Note: The size for locations
1.35 Degrees, No Antenna, Points = VDB
Note: The size for locations
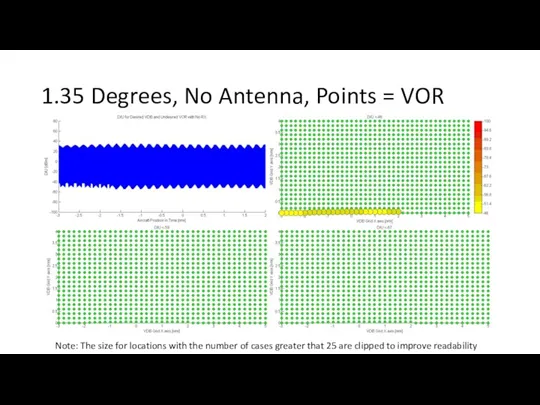
1.35 Degrees, No Antenna, Points = VOR
Note: The size for locations
1.35 Degrees, No Antenna, Points = VOR
Note: The size for locations
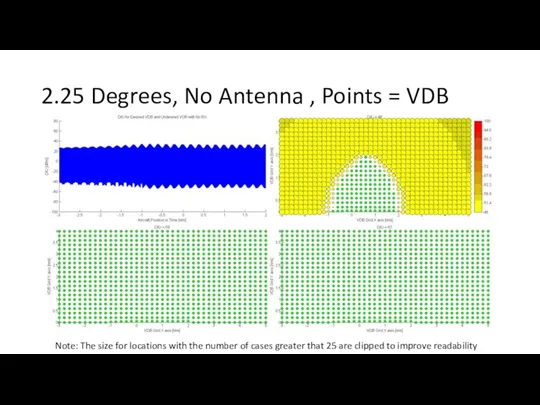
2.25 Degrees, No Antenna , Points = VDB
Note: The size for
2.25 Degrees, No Antenna , Points = VDB
Note: The size for
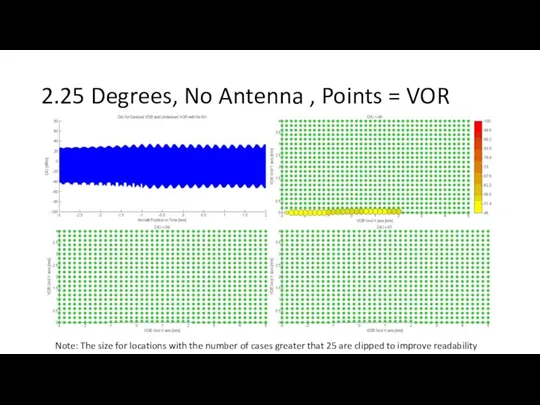
2.25 Degrees, No Antenna , Points = VOR
Note: The size
2.25 Degrees, No Antenna , Points = VOR
Note: The size
3 Degrees, No Antenna , Points = VDB
Note: The size for
3 Degrees, No Antenna , Points = VDB
Note: The size for
3 Degrees, No Antenna , Points = VOR
Note: The size for
3 Degrees, No Antenna , Points = VOR
Note: The size for

A/C Flight Path to 200 ft
A/C Flight Path to 200 ft
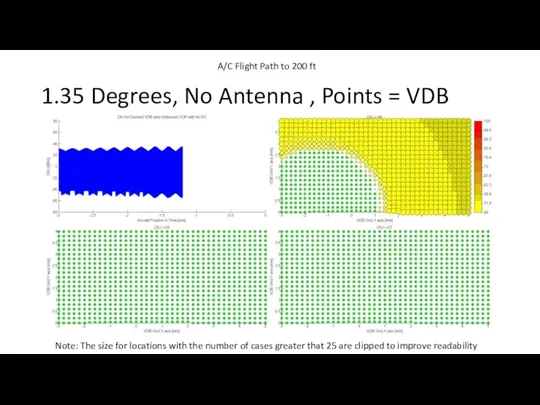
1.35 Degrees, No Antenna , Points = VDB
Note: The size for
1.35 Degrees, No Antenna , Points = VDB
Note: The size for
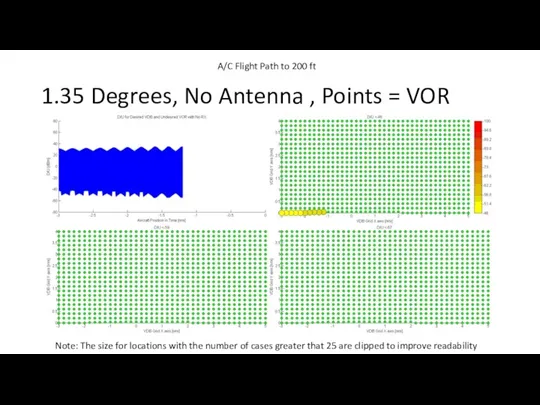
1.35 Degrees, No Antenna , Points = VOR
Note: The size for
1.35 Degrees, No Antenna , Points = VOR
Note: The size for
2.25 Degrees, No Antenna , Points = VDB
Note: The size for
2.25 Degrees, No Antenna , Points = VDB
Note: The size for
2.25 Degrees, No Antenna , Points = VOR
Note: The size for
2.25 Degrees, No Antenna , Points = VOR
Note: The size for
3 Degrees, No Antenna , Points = VDB
Note: The size for
3 Degrees, No Antenna , Points = VDB
Note: The size for
3 Degrees, No Antenna , Points = VOR
Note: The size for
3 Degrees, No Antenna , Points = VOR
Note: The size for
 Мировые религии. Ислам
 Презентация Портфолио педагога дошкольного образования
 Устройство формирования импульсных сигналов управления с регулируемыми коэффициентом заполнения и частотой модуляции
 Тайны географических названий
 Профилактика детских неврозов
 Наркозные средства. Спирт этиловый
 Постсекреторная динамика сигнальных соединений. Специфические транспортные белки
 Земляки-герои Великой отечественной войны
 Цікаві факти про акул
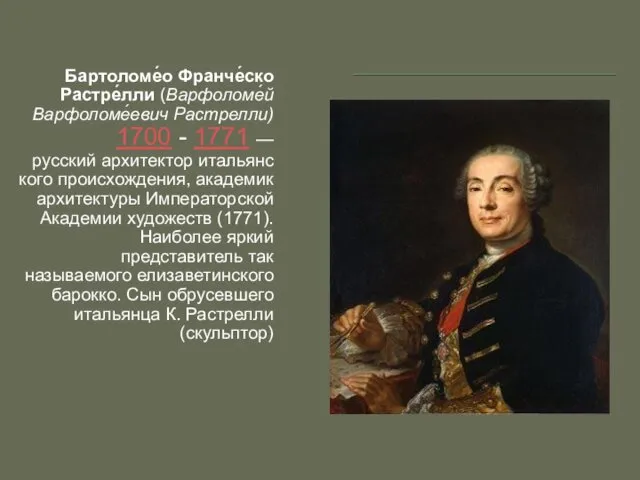 Бартоломео Франческо Растрелли (Варфоломей Варфоломеевич Растрелли) 1700 - 1771
 Нервная система человека.
 Термообработка стали
 20231105_prezentatsiya1._zvezdnyy_chas
 Ярмарка профессий рабочего города
 Мы - из красной книги.
 Презентация опасности в горах
 Сестринский уход при ожирении
 ГОСТ 23161-2012 Грунты. Метод лабораторного определения характеристик просадочности
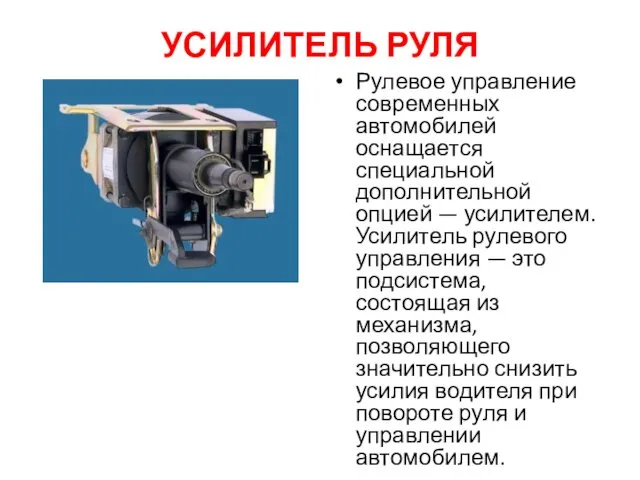 Рулевое управление современных автомобилей
 Выбор профессии.
 Различение звуков Ы-И.
 Рекомендации от составителей КИМ по обществознанию
 Воспитание детей в царских семьях как фактор формирования самодержавной власти в России
 Функции, строение, свойства, режимы и использование почв
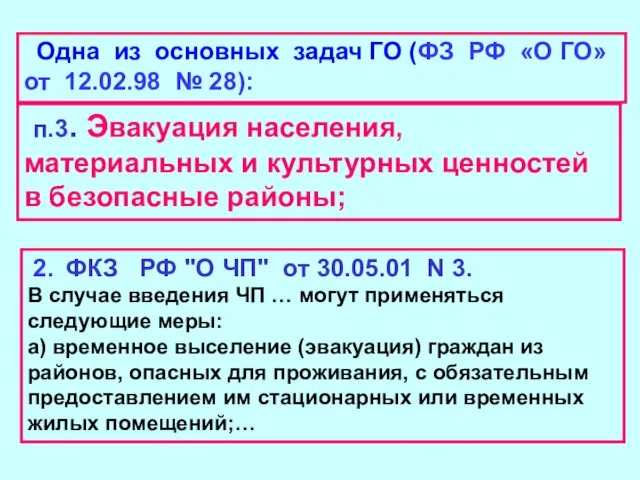 Эвакуация населения, материальных и культурных ценностей в безопасные районы
 Система управления и связи ГО и РСЧС. УМП Тема 5
 Понятие и виды специальных налоговых режимов
 Цифровые образовательные ресурсы на уроках химии.