- Total quality management. (Chapter 4)

Содержание
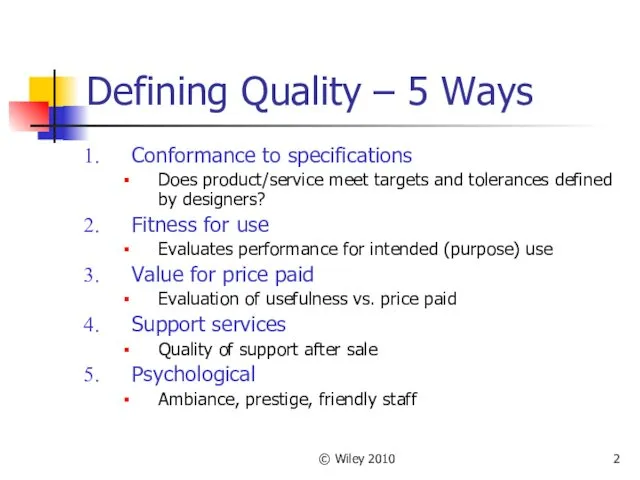
- 2. © Wiley 2010 Defining Quality – 5 Ways Conformance to specifications Does product/service meet targets and
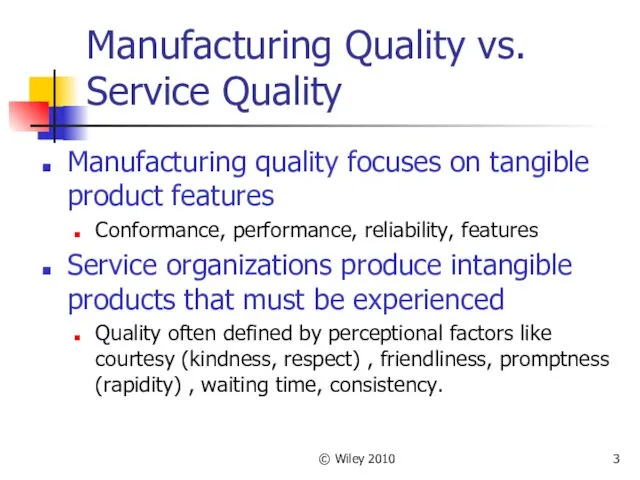
- 3. © Wiley 2010 Manufacturing Quality vs. Service Quality Manufacturing quality focuses on tangible product features Conformance,
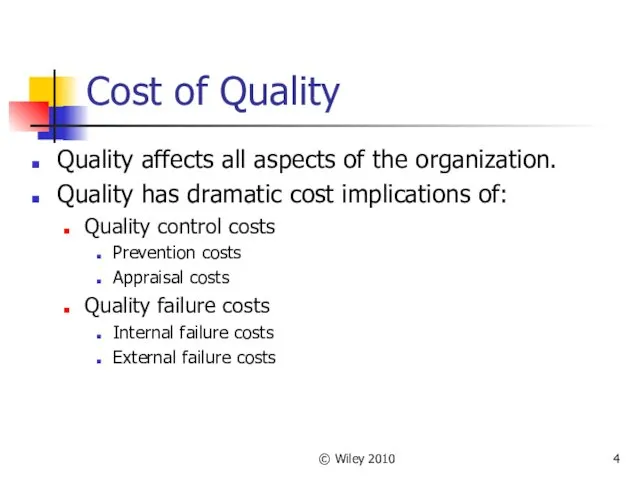
- 4. © Wiley 2010 Cost of Quality Quality affects all aspects of the organization. Quality has dramatic
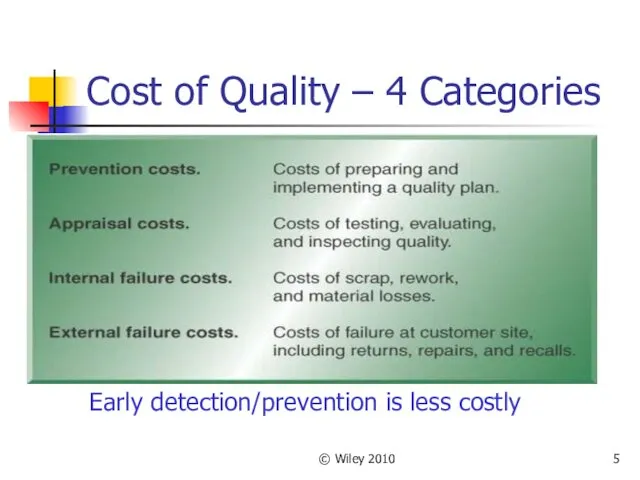
- 5. © Wiley 2010 Cost of Quality – 4 Categories Early detection/prevention is less costly
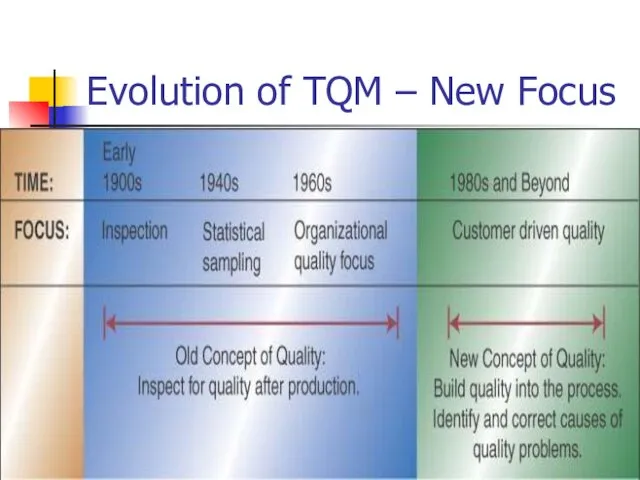
- 6. © Wiley 2010 Evolution of TQM – New Focus
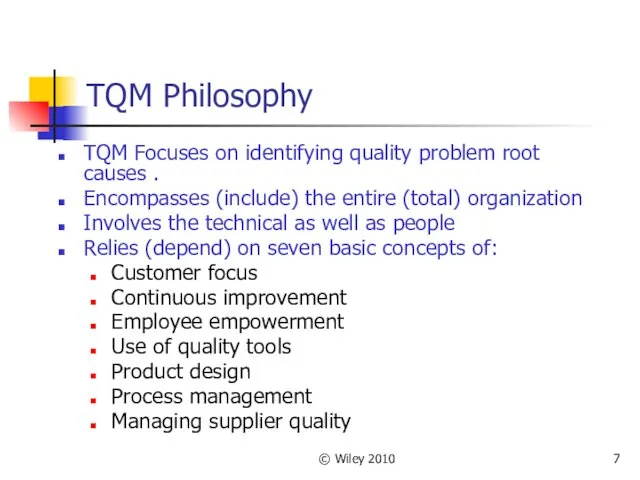
- 7. © Wiley 2010 TQM Philosophy TQM Focuses on identifying quality problem root causes . Encompasses (include)
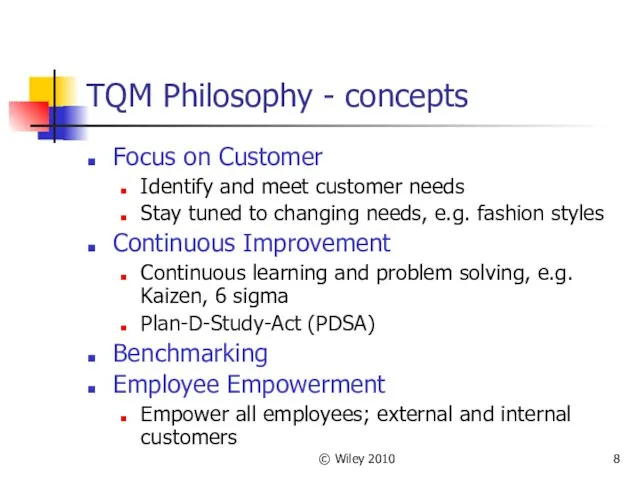
- 8. © Wiley 2010 TQM Philosophy - concepts Focus on Customer Identify and meet customer needs Stay
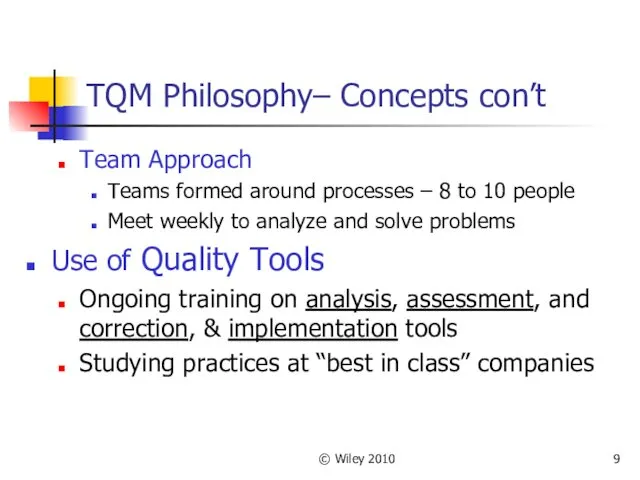
- 9. © Wiley 2010 TQM Philosophy– Concepts con’t Team Approach Teams formed around processes – 8 to
- 10. © Wiley 2010 Ways of Improving Quality Plan-Do-Study-Act Cycle (PDSA) Also called the Deming Wheel after
- 11. © Wiley 2010 PDSA Details Plan Evaluate current process Collect procedures, data, identify problems Develop an
- 12. © Wiley 2010 PDSA con’t Cycle is repeated After act phase, start planning and repeat process
- 13. © Wiley 2010 Seven Tools of Quality Control Cause-and-Effect Diagrams Flowcharts Checklists Control Charts Scatter Diagrams
- 14. © Wiley 2010 Cause-and-Effect Diagrams Called Fishbone Diagram Focused on solving identified quality problem
- 15. © Wiley 2010 Flowcharts Used to document the detailed steps in a process Often the first
- 16. © Wiley 2010 Checklist Simple data check-off sheet designed to identify type of quality problems at
- 17. © Wiley 2010 Control Charts Important tool used in Statistical Process Control – The UCL and
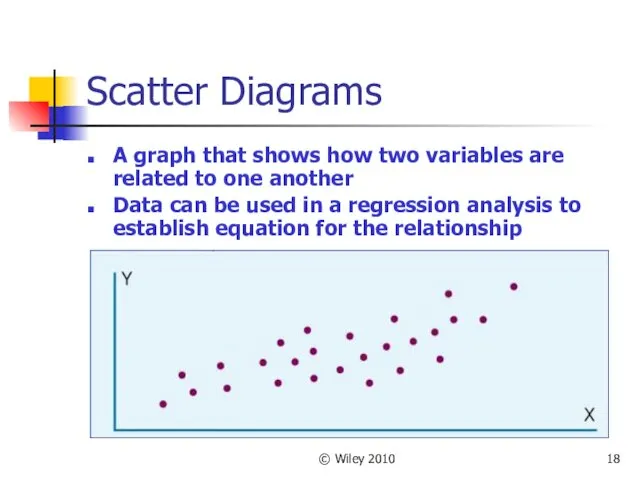
- 18. © Wiley 2010 Scatter Diagrams A graph that shows how two variables are related to one
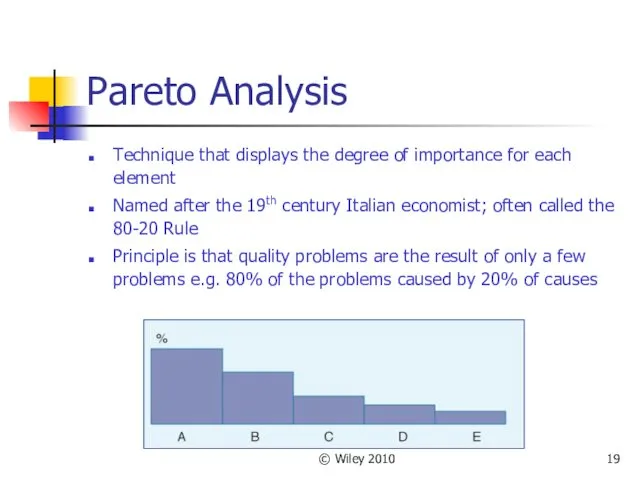
- 19. © Wiley 2010 Pareto Analysis Technique that displays the degree of importance for each element Named
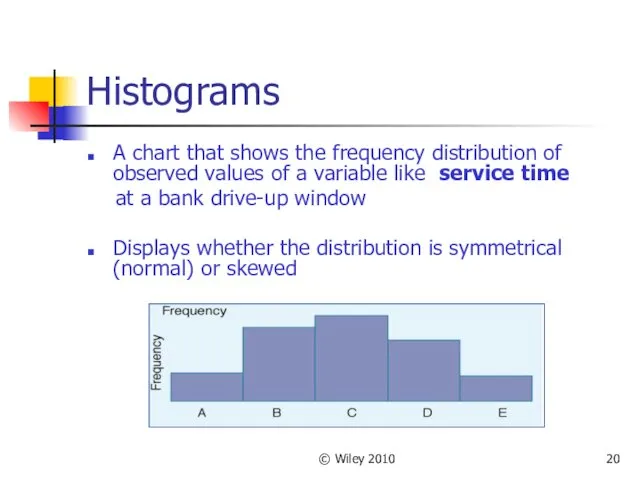
- 20. © Wiley 2010 Histograms A chart that shows the frequency distribution of observed values of a
- 21. © Wiley 2010 Product Design - Quality Function Deployment Critical to ensure product design meets customer
- 22. © Wiley 2010 Process Management & Managing Supplier Quality Quality products come from quality sources Quality
- 23. © Wiley 2010 Quality Awards and Standards Malcolm Baldrige National Quality Award (MBNQA) The Deming Prize
- 24. © Wiley 2010 MBNQA- What Is It? Award named after the former Secretary of Commerce –
- 25. © Wiley 2010 The Deming Prize Given by the Union of Japanese Scientists and Engineers since
- 26. © Wiley 2010 ISO Standards ISO 9000 Standards: Certification developed by International Organization for Standardization Set
- 27. © Wiley 2010 Why TQM Efforts Fail Lack of a genuine (really) quality culture Lack of
- 29. Скачать презентацию
© Wiley 2010
Defining Quality – 5 Ways
Conformance to specifications
Does product/service meet
© Wiley 2010
Defining Quality – 5 Ways
Conformance to specifications
Does product/service meet
© Wiley 2010
Manufacturing Quality vs. Service Quality
Manufacturing quality focuses on tangible
© Wiley 2010
Manufacturing Quality vs. Service Quality
Manufacturing quality focuses on tangible
© Wiley 2010
Cost of Quality
Quality affects all aspects of the organization.
Quality
© Wiley 2010
Cost of Quality
Quality affects all aspects of the organization.
Quality
© Wiley 2010
Cost of Quality – 4 Categories
Early detection/prevention is less
© Wiley 2010
Cost of Quality – 4 Categories
Early detection/prevention is less
© Wiley 2010
Evolution of TQM – New Focus
© Wiley 2010
Evolution of TQM – New Focus
© Wiley 2010
TQM Philosophy
TQM Focuses on identifying quality problem root causes
© Wiley 2010
TQM Philosophy
TQM Focuses on identifying quality problem root causes
© Wiley 2010
TQM Philosophy - concepts
Focus on Customer
Identify and meet customer
© Wiley 2010
TQM Philosophy - concepts
Focus on Customer
Identify and meet customer
© Wiley 2010
TQM Philosophy– Concepts con’t
Team Approach
Teams formed around processes –
© Wiley 2010
TQM Philosophy– Concepts con’t
Team Approach
Teams formed around processes –
© Wiley 2010
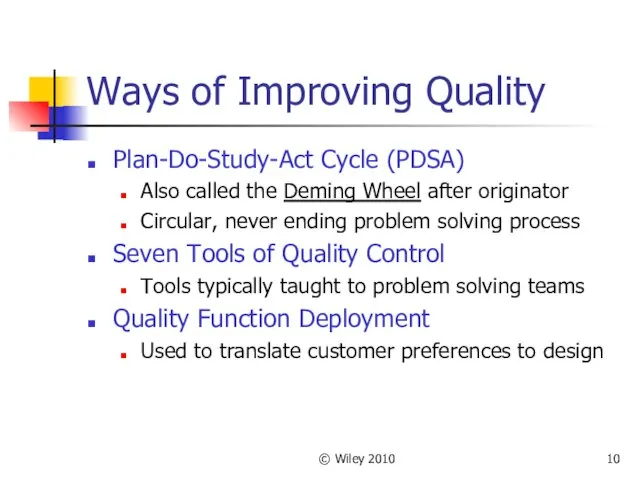
Ways of Improving Quality
Plan-Do-Study-Act Cycle (PDSA)
Also called the Deming
© Wiley 2010
Ways of Improving Quality
Plan-Do-Study-Act Cycle (PDSA)
Also called the Deming
© Wiley 2010
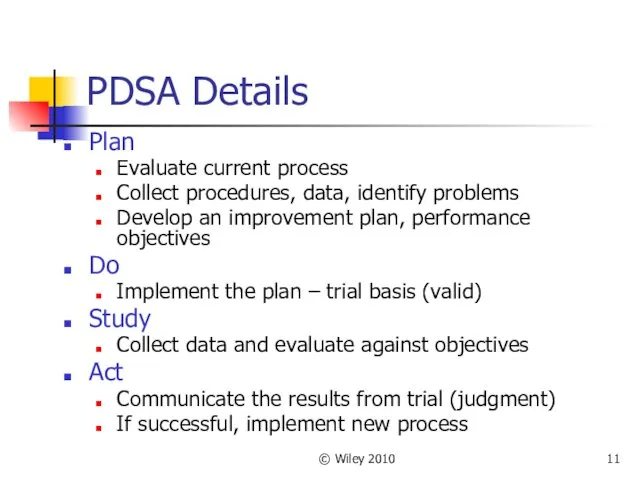
PDSA Details
Plan
Evaluate current process
Collect procedures, data, identify problems
Develop an
© Wiley 2010
PDSA Details
Plan
Evaluate current process
Collect procedures, data, identify problems
Develop an
© Wiley 2010
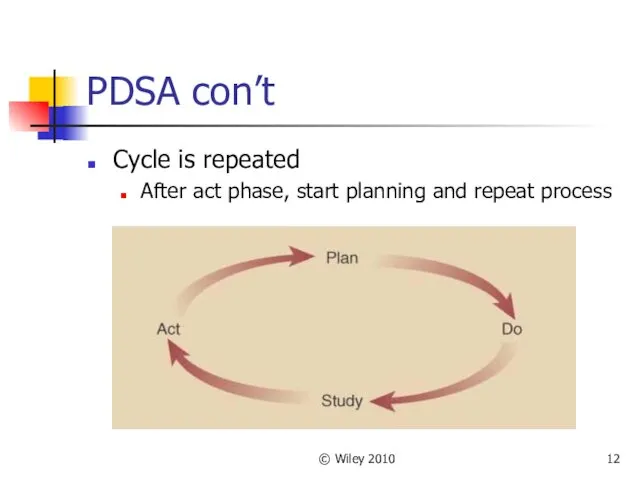
PDSA con’t
Cycle is repeated
After act phase, start planning
© Wiley 2010
PDSA con’t
Cycle is repeated
After act phase, start planning
© Wiley 2010
Seven Tools of Quality Control
Cause-and-Effect Diagrams
Flowcharts
Checklists
Control Charts
Scatter Diagrams
Pareto Analysis
Histograms
© Wiley 2010
Seven Tools of Quality Control
Cause-and-Effect Diagrams
Flowcharts
Checklists
Control Charts
Scatter Diagrams
Pareto Analysis
Histograms
© Wiley 2010
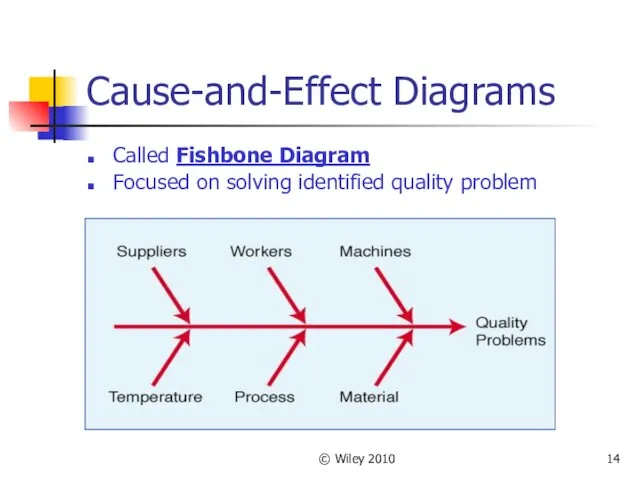
Cause-and-Effect Diagrams
Called Fishbone Diagram
Focused on solving identified quality problem
© Wiley 2010
Cause-and-Effect Diagrams
Called Fishbone Diagram
Focused on solving identified quality problem
© Wiley 2010
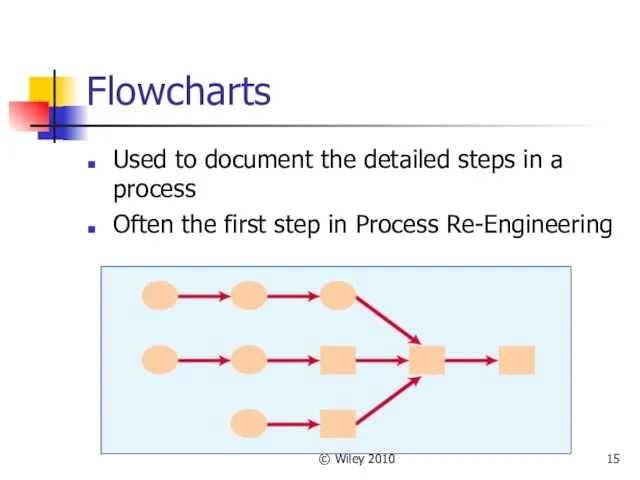
Flowcharts
Used to document the detailed steps in a process
Often
© Wiley 2010
Flowcharts
Used to document the detailed steps in a process
Often
© Wiley 2010
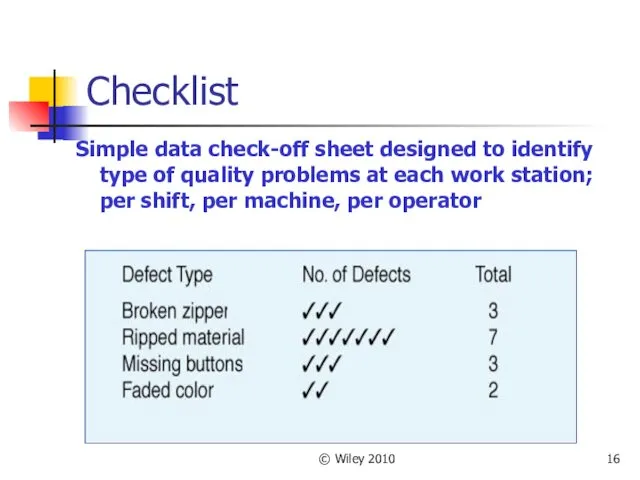
Checklist
Simple data check-off sheet designed to identify type of
© Wiley 2010
Checklist
Simple data check-off sheet designed to identify type of
© Wiley 2010
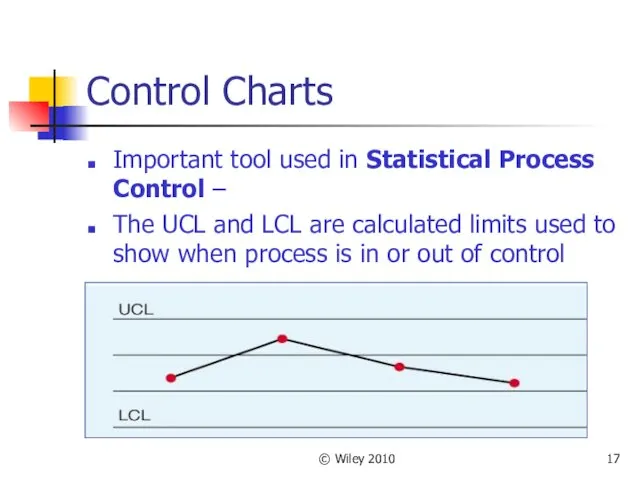
Control Charts
Important tool used in Statistical Process Control –
© Wiley 2010
Control Charts
Important tool used in Statistical Process Control –
© Wiley 2010
Scatter Diagrams
A graph that shows how two variables are
© Wiley 2010
Scatter Diagrams
A graph that shows how two variables are
© Wiley 2010
Pareto Analysis
Technique that displays the degree of importance for
© Wiley 2010
Pareto Analysis
Technique that displays the degree of importance for
© Wiley 2010
Histograms
A chart that shows the frequency distribution of observed
© Wiley 2010
Histograms
A chart that shows the frequency distribution of observed
© Wiley 2010
Product Design - Quality Function Deployment
Critical to ensure
© Wiley 2010
Product Design - Quality Function Deployment
Critical to ensure
© Wiley 2010
Process Management & Managing Supplier Quality
Quality products come from
© Wiley 2010
Process Management & Managing Supplier Quality
Quality products come from
© Wiley 2010
Quality Awards and Standards
Malcolm Baldrige National Quality Award
© Wiley 2010
Quality Awards and Standards
Malcolm Baldrige National Quality Award
© Wiley 2010
MBNQA- What Is It?
Award named after the former Secretary
© Wiley 2010
MBNQA- What Is It?
Award named after the former Secretary
© Wiley 2010
The Deming Prize
Given by the Union of Japanese Scientists
© Wiley 2010
The Deming Prize
Given by the Union of Japanese Scientists
© Wiley 2010
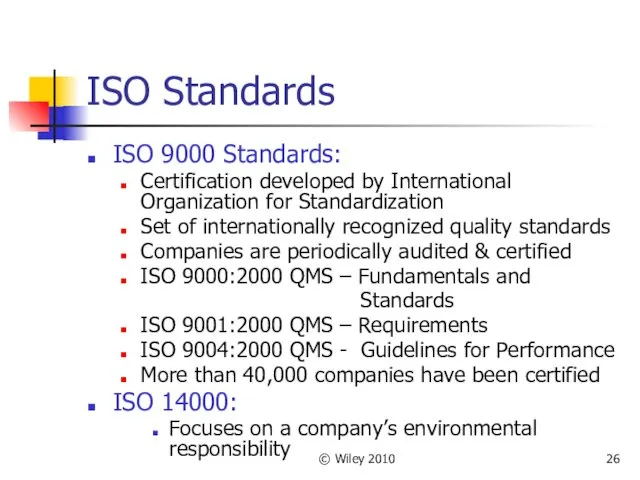
ISO Standards
ISO 9000 Standards:
Certification developed by International Organization
© Wiley 2010
ISO Standards
ISO 9000 Standards:
Certification developed by International Organization
© Wiley 2010
Why TQM Efforts Fail
Lack of a genuine (really) quality
© Wiley 2010
Why TQM Efforts Fail
Lack of a genuine (really) quality
 Отношения между людьми
 Фонд развития Омской области имени С. И. Манякина
 Xit test. Spotlight 4
 Животные Красной книги Нижегородской области
 Банковская система
 Экономико-географическая характеристика Италии
 Классный час Мы - за здоровый образ жизни!
 Жерасты газ, мұнай және мұнай сақтау қоймаларын салу
 Сюмсинский дом детского творчества
 Героический эпос народов мира. Понятие о героическом эпосе
 Мастер-класс ученика: Гиацинт.
 Седативные средства
 Грыжи. Классификация грыж
 Городская экологическая акция: Заповедные места родного края. г. Липецк
 Мега галактический театр. Игровой урок-повторение для 1 класса по школьной программе
 Средства художественной выразительности речи
 Презентация проекта Семь нот ведут нас за собой
 Внимание младших школьников. Приемы привлечения и удержания внимания
 Нормы оценок
 Презентация научно-исследовательской работы Зубные пасты
 Принцип організації каналів передачі даних за допомогою супутникових засобів зв’язку
 Двоичное кодирование чисел в компьютере
 20231124_vis_7_urok1
 Comparisons. Adjectives
 Плавление и кристаллизация
 Наше радио
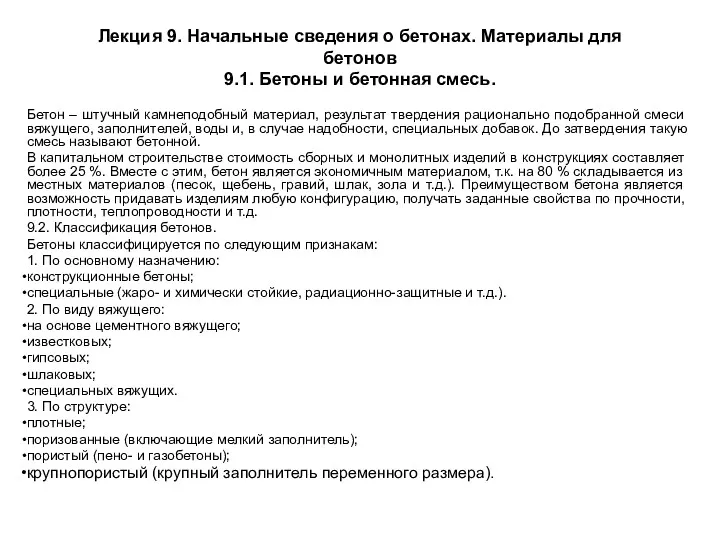 Начальные сведения о бетонах. Материалы для бетонов
 Эпштейна-Барр вирусная инфекция. Алгоритм врача-педиатра