- Supply, Demand,

Содержание
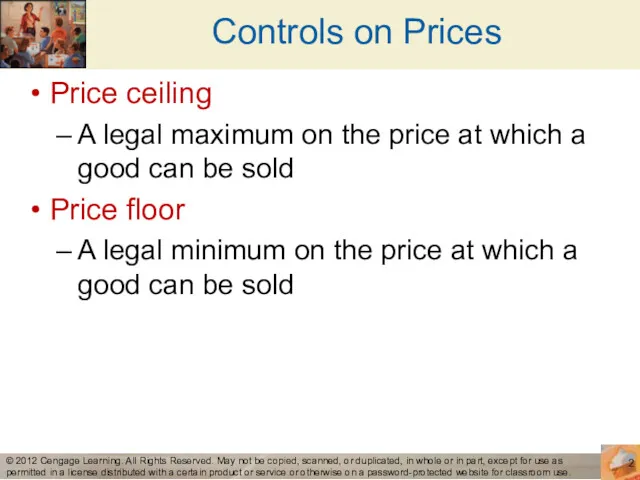
- 2. Controls on Prices Price ceiling A legal maximum on the price at which a good can
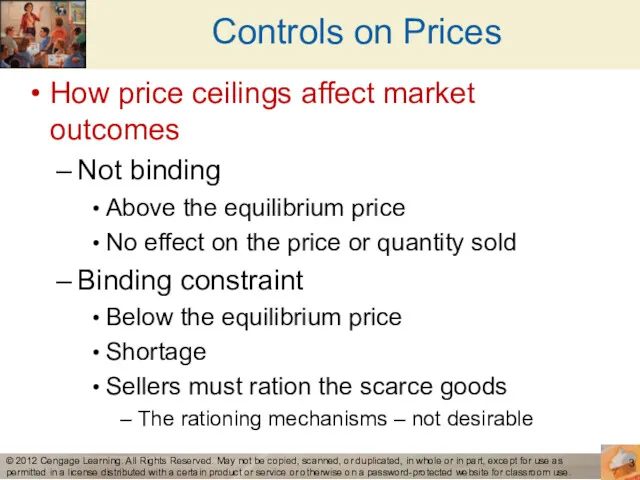
- 3. Controls on Prices How price ceilings affect market outcomes Not binding Above the equilibrium price No
- 4. Figure 1 © 2012 Cengage Learning. All Rights Reserved. May not be copied, scanned, or duplicated,
- 5. Lines at the gas pump 1973, OPEC raised the price of crude oil Reduced the supply
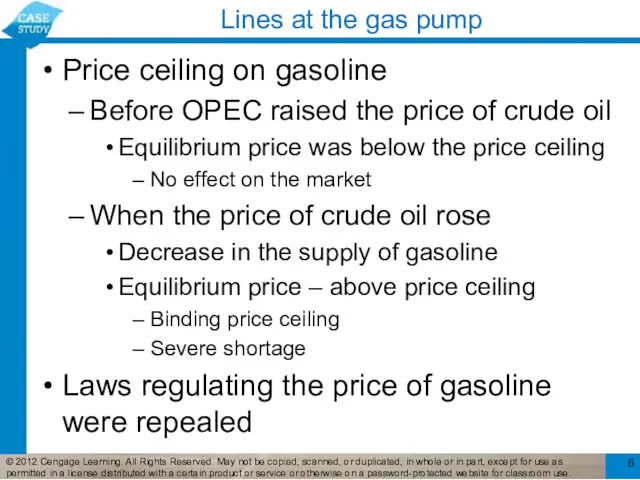
- 6. Lines at the gas pump Price ceiling on gasoline Before OPEC raised the price of crude
- 7. Figure 2 © 2012 Cengage Learning. All Rights Reserved. May not be copied, scanned, or duplicated,
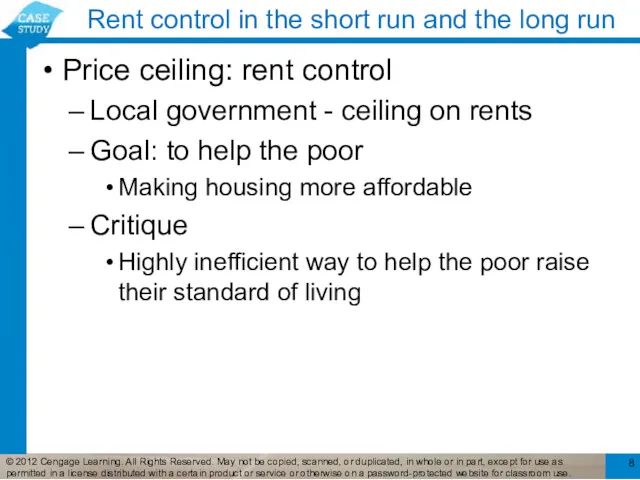
- 8. Rent control in the short run and the long run Price ceiling: rent control Local government
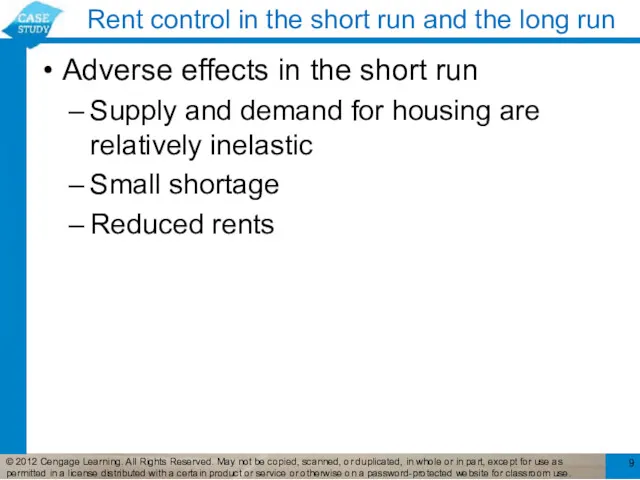
- 9. Rent control in the short run and the long run Adverse effects in the short run
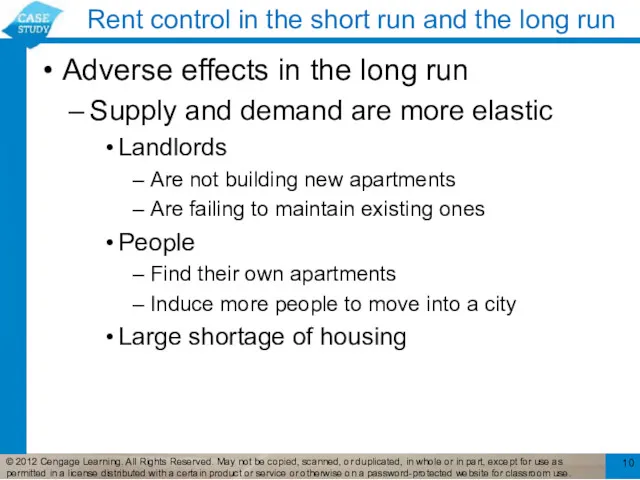
- 10. Rent control in the short run and the long run Adverse effects in the long run
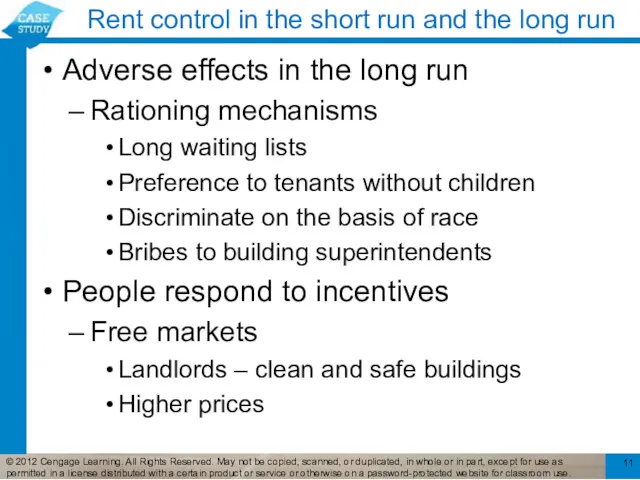
- 11. Rent control in the short run and the long run Adverse effects in the long run
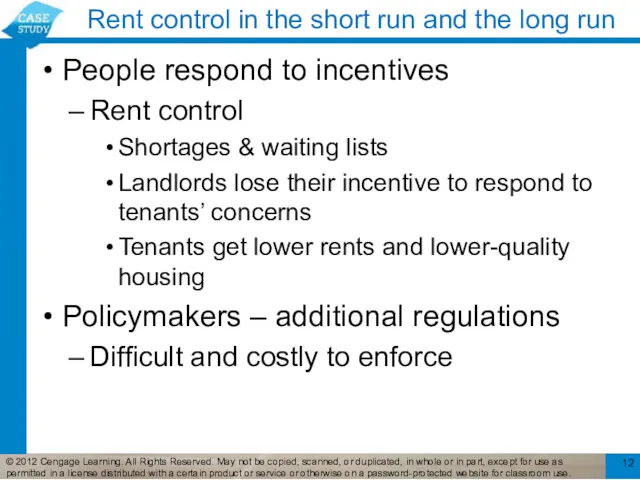
- 12. Rent control in the short run and the long run People respond to incentives Rent control
- 13. Figure 3 © 2012 Cengage Learning. All Rights Reserved. May not be copied, scanned, or duplicated,
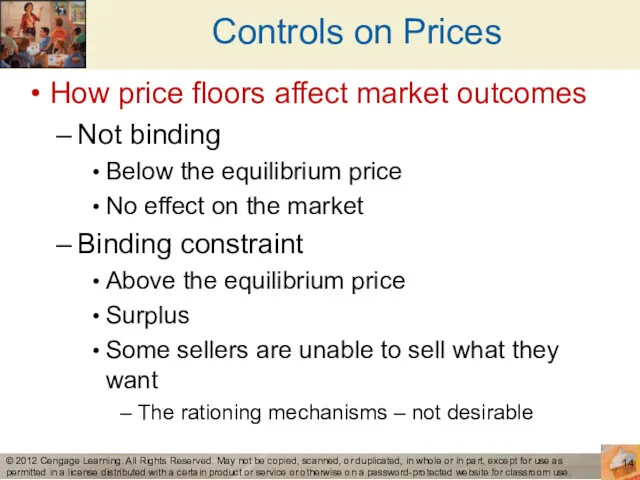
- 14. Controls on Prices How price floors affect market outcomes Not binding Below the equilibrium price No
- 15. Figure 4 © 2012 Cengage Learning. All Rights Reserved. May not be copied, scanned, or duplicated,
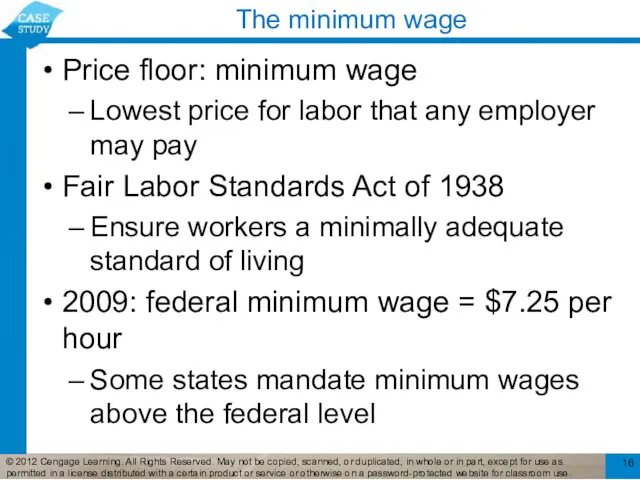
- 16. The minimum wage Price floor: minimum wage Lowest price for labor that any employer may pay
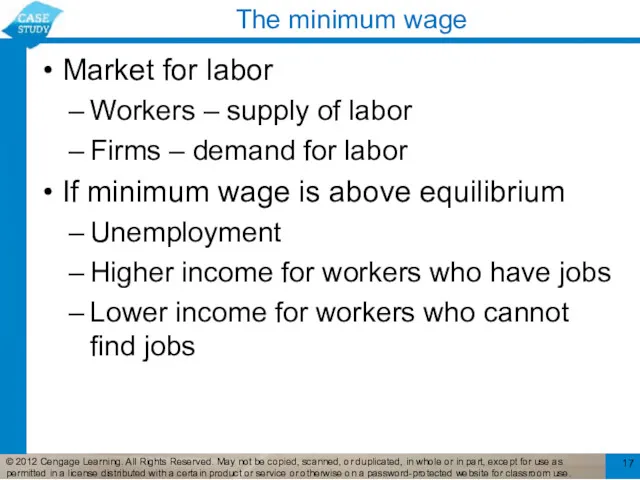
- 17. The minimum wage Market for labor Workers – supply of labor Firms – demand for labor
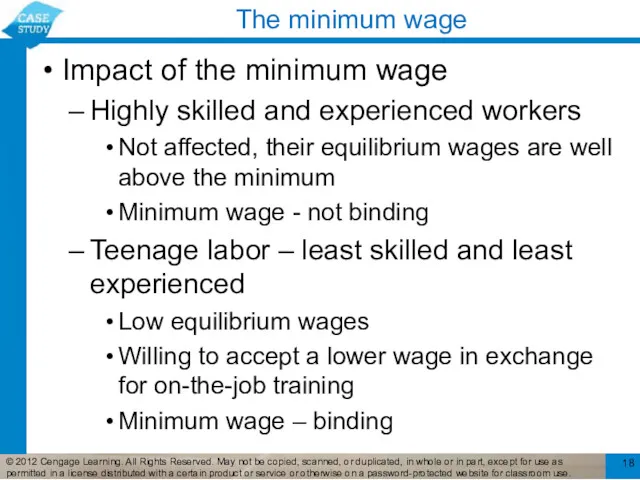
- 18. The minimum wage Impact of the minimum wage Highly skilled and experienced workers Not affected, their
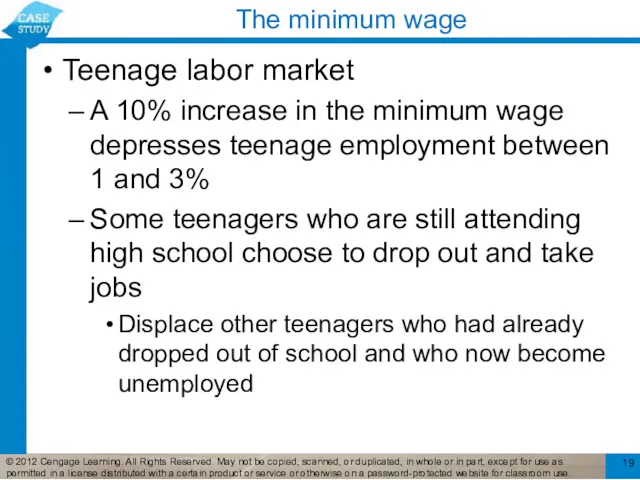
- 19. The minimum wage Teenage labor market A 10% increase in the minimum wage depresses teenage employment
- 20. Figure 5 © 2012 Cengage Learning. All Rights Reserved. May not be copied, scanned, or duplicated,
- 21. Controls on Prices Evaluating price controls Markets are usually a good way to organize economic activity
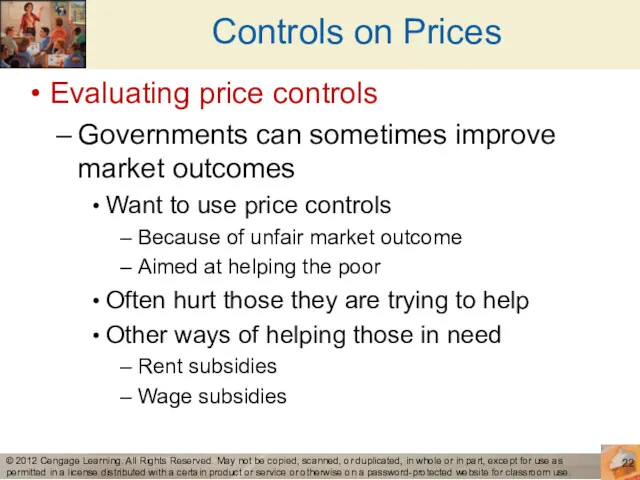
- 22. Controls on Prices Evaluating price controls Governments can sometimes improve market outcomes Want to use price
- 23. Taxes Governments use taxes To raise revenue for public projects Tax incidence Manner in which the
- 24. Taxes Tax levied on sellers of a good Immediate impact on sellers - shift in supply
- 25. Figure 6 © 2012 Cengage Learning. All Rights Reserved. May not be copied, scanned, or duplicated,
- 26. Taxes Tax levied on sellers of a good Taxes discourage market activity Buyers and sellers share
- 27. Taxes Tax levied on buyers of a good Initial impact on the demand Demand curve shifts
- 28. Figure 7 © 2012 Cengage Learning. All Rights Reserved. May not be copied, scanned, or duplicated,
- 29. Taxes Tax levied on buyers of a good Buyers and sellers share the burden of tax
- 30. Taxes Taxes levied on sellers and taxes levied on buyers are equivalent Wedge between the price
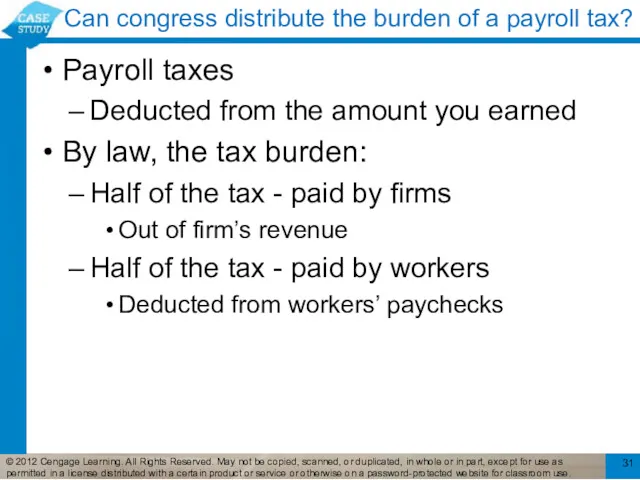
- 31. Can congress distribute the burden of a payroll tax? Payroll taxes Deducted from the amount you
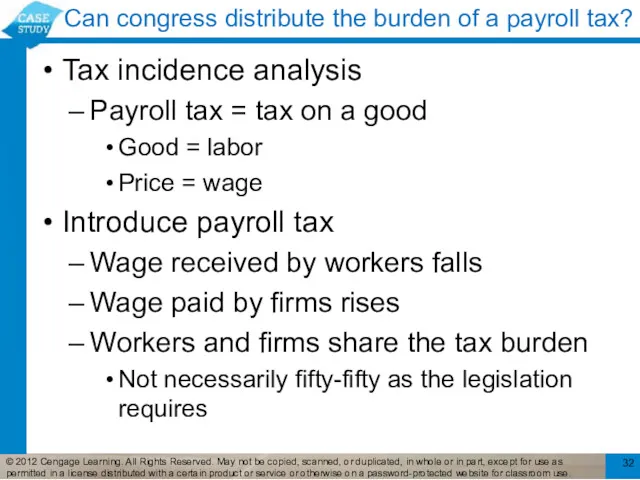
- 32. Can congress distribute the burden of a payroll tax? Tax incidence analysis Payroll tax = tax
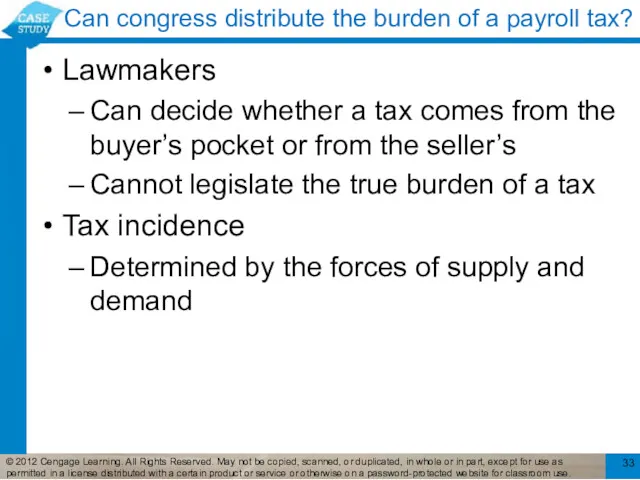
- 33. Can congress distribute the burden of a payroll tax? Lawmakers Can decide whether a tax comes
- 34. Figure 8 © 2012 Cengage Learning. All Rights Reserved. May not be copied, scanned, or duplicated,
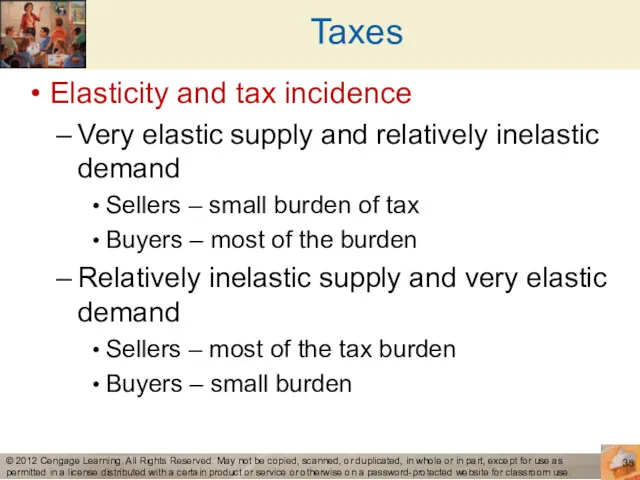
- 35. Taxes Elasticity and tax incidence Very elastic supply and relatively inelastic demand Sellers – small burden
- 36. Figure 9 © 2012 Cengage Learning. All Rights Reserved. May not be copied, scanned, or duplicated,
- 37. Figure 9 © 2012 Cengage Learning. All Rights Reserved. May not be copied, scanned, or duplicated,
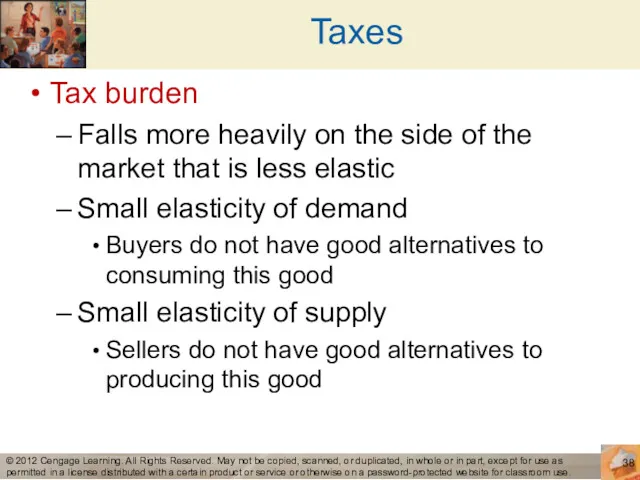
- 38. Taxes Tax burden Falls more heavily on the side of the market that is less elastic
- 39. Who pays the luxury tax? 1990 - new luxury tax On yachts, private airplanes, furs, jewelry,
- 41. Скачать презентацию
Controls on Prices
Price ceiling
A legal maximum on the price at which
Controls on Prices
Price ceiling
A legal maximum on the price at which
Controls on Prices
How price ceilings affect market outcomes
Not binding
Above the equilibrium
Controls on Prices
How price ceilings affect market outcomes
Not binding
Above the equilibrium
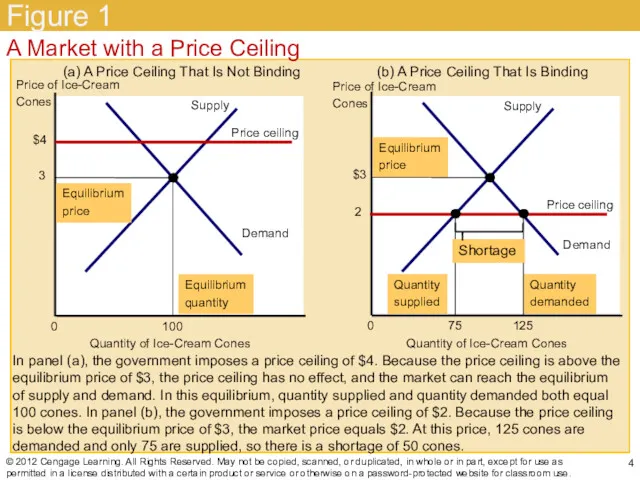
Figure 1
© 2012 Cengage Learning. All Rights Reserved. May not be
Figure 1
© 2012 Cengage Learning. All Rights Reserved. May not be
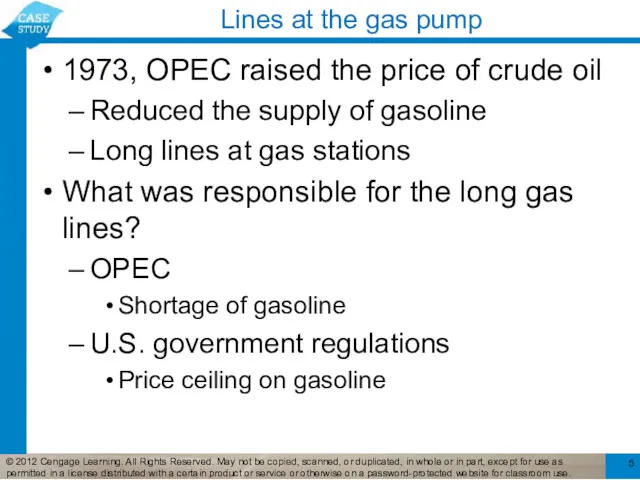
Lines at the gas pump
1973, OPEC raised the price of crude
Lines at the gas pump
1973, OPEC raised the price of crude
Lines at the gas pump
Price ceiling on gasoline
Before OPEC raised the
Lines at the gas pump
Price ceiling on gasoline
Before OPEC raised the
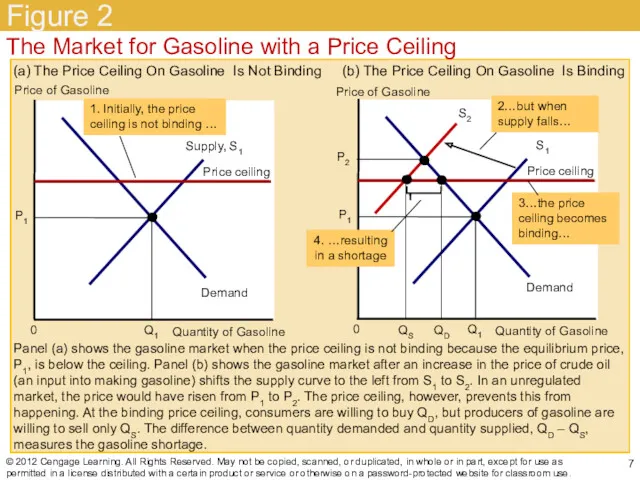
Figure 2
© 2012 Cengage Learning. All Rights Reserved. May not be
Figure 2
© 2012 Cengage Learning. All Rights Reserved. May not be
Rent control in the short run and the long run
Price ceiling:
Rent control in the short run and the long run
Price ceiling:
Rent control in the short run and the long run
Adverse effects
Rent control in the short run and the long run
Adverse effects
Rent control in the short run and the long run
Adverse effects
Rent control in the short run and the long run
Adverse effects
Rent control in the short run and the long run
Adverse effects
Rent control in the short run and the long run
Adverse effects
Rent control in the short run and the long run
People respond
Rent control in the short run and the long run
People respond
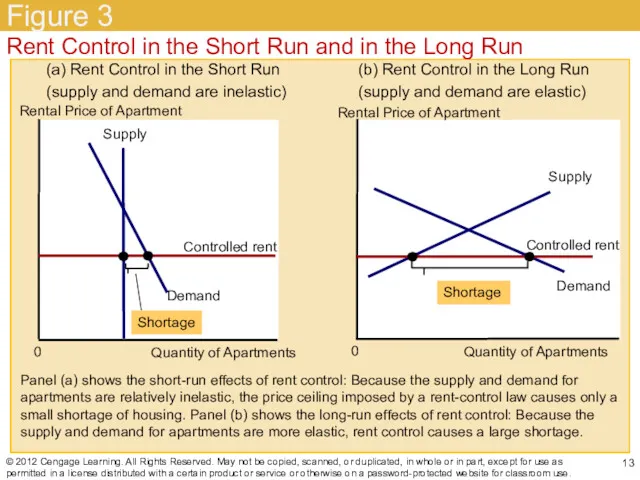
Figure 3
© 2012 Cengage Learning. All Rights Reserved. May not be
Figure 3
© 2012 Cengage Learning. All Rights Reserved. May not be
Controls on Prices
How price floors affect market outcomes
Not binding
Below the equilibrium
Controls on Prices
How price floors affect market outcomes
Not binding
Below the equilibrium
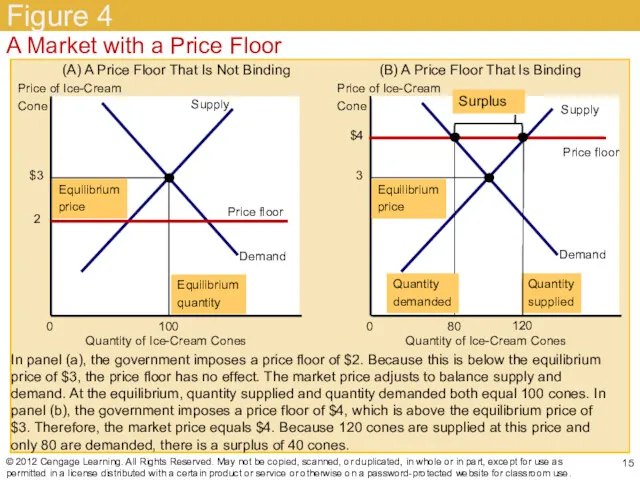
Figure 4
© 2012 Cengage Learning. All Rights Reserved. May not be
Figure 4
© 2012 Cengage Learning. All Rights Reserved. May not be
The minimum wage
Price floor: minimum wage
Lowest price for labor that any
The minimum wage
Price floor: minimum wage
Lowest price for labor that any
The minimum wage
Market for labor
Workers – supply of labor
Firms – demand
The minimum wage
Market for labor
Workers – supply of labor
Firms – demand
The minimum wage
Impact of the minimum wage
Highly skilled and experienced workers
Not
The minimum wage
Impact of the minimum wage
Highly skilled and experienced workers
Not
The minimum wage
Teenage labor market
A 10% increase in the minimum wage
The minimum wage
Teenage labor market
A 10% increase in the minimum wage
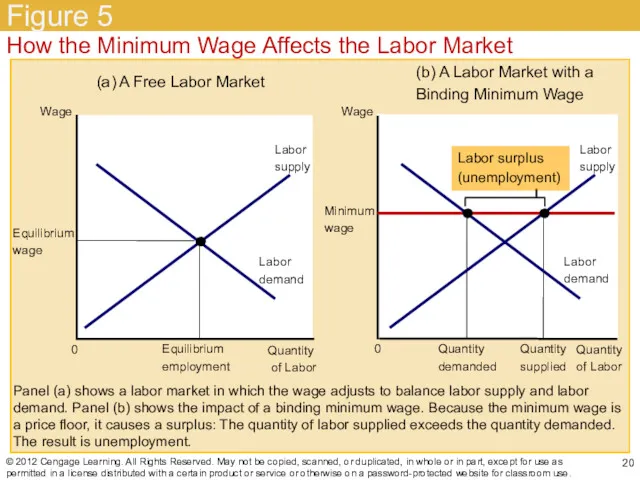
Figure 5
© 2012 Cengage Learning. All Rights Reserved. May not be
Figure 5
© 2012 Cengage Learning. All Rights Reserved. May not be
Controls on Prices
Evaluating price controls
Markets are usually a good way to
Controls on Prices
Evaluating price controls
Markets are usually a good way to
Controls on Prices
Evaluating price controls
Governments can sometimes improve market outcomes
Want to
Controls on Prices
Evaluating price controls
Governments can sometimes improve market outcomes
Want to
Taxes
Governments use taxes
To raise revenue for public projects
Tax incidence
Manner in
Taxes
Governments use taxes
To raise revenue for public projects
Tax incidence
Manner in

Taxes
Tax levied on sellers of a good
Immediate impact on sellers
Taxes
Tax levied on sellers of a good
Immediate impact on sellers
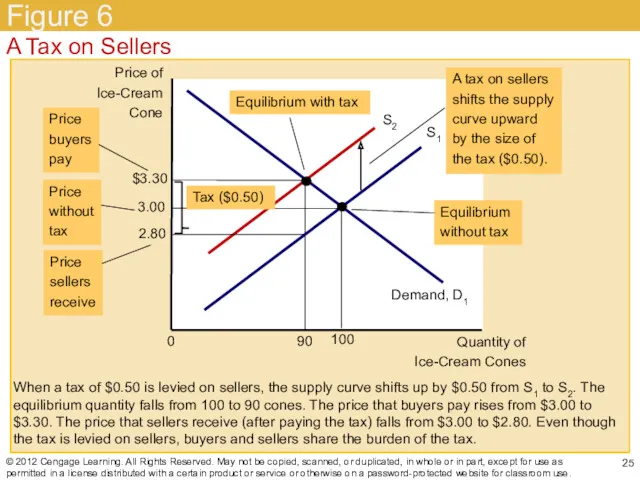
Figure 6
© 2012 Cengage Learning. All Rights Reserved. May not be
Figure 6
© 2012 Cengage Learning. All Rights Reserved. May not be
Taxes
Tax levied on sellers of a good
Taxes discourage market activity
Buyers
Taxes
Tax levied on sellers of a good
Taxes discourage market activity
Buyers
Taxes
Tax levied on buyers of a good
Initial impact on the
Taxes
Tax levied on buyers of a good
Initial impact on the
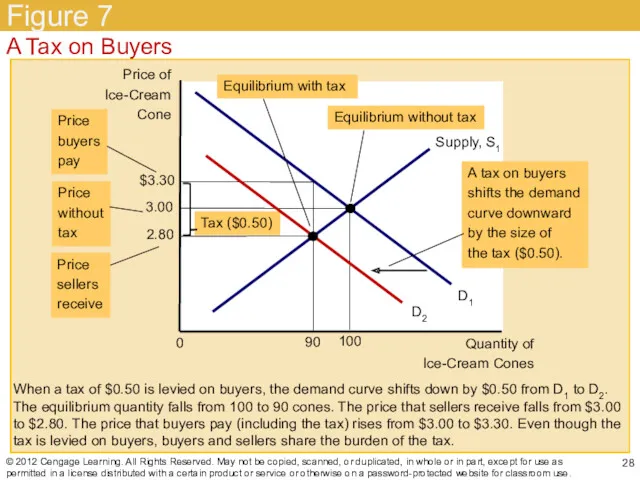
Figure 7
© 2012 Cengage Learning. All Rights Reserved. May not be
Figure 7
© 2012 Cengage Learning. All Rights Reserved. May not be
Taxes
Tax levied on buyers of a good
Buyers and sellers share
Taxes
Tax levied on buyers of a good
Buyers and sellers share
Taxes
Taxes levied on sellers and taxes levied on buyers are
Taxes
Taxes levied on sellers and taxes levied on buyers are
Can congress distribute the burden of a payroll tax?
Payroll taxes
Deducted from
Can congress distribute the burden of a payroll tax?
Payroll taxes
Deducted from
Can congress distribute the burden of a payroll tax?
Tax incidence analysis
Payroll
Can congress distribute the burden of a payroll tax?
Tax incidence analysis
Payroll
Can congress distribute the burden of a payroll tax?
Lawmakers
Can decide whether
Can congress distribute the burden of a payroll tax?
Lawmakers
Can decide whether
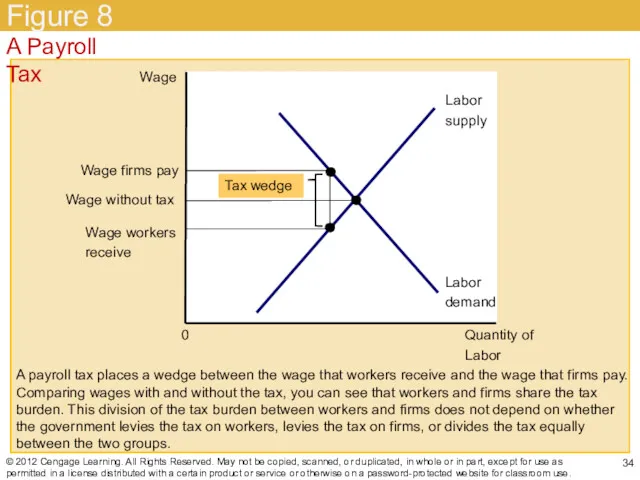
Figure 8
© 2012 Cengage Learning. All Rights Reserved. May not be
Figure 8
© 2012 Cengage Learning. All Rights Reserved. May not be
Taxes
Elasticity and tax incidence
Very elastic supply and relatively inelastic demand
Sellers
Taxes
Elasticity and tax incidence
Very elastic supply and relatively inelastic demand
Sellers

Figure 9
© 2012 Cengage Learning. All Rights Reserved. May not be
Figure 9
© 2012 Cengage Learning. All Rights Reserved. May not be
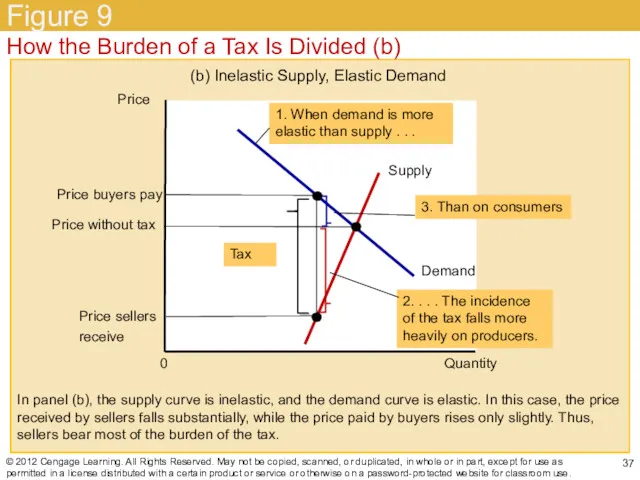
Figure 9
© 2012 Cengage Learning. All Rights Reserved. May not be
Figure 9
© 2012 Cengage Learning. All Rights Reserved. May not be
Taxes
Tax burden
Falls more heavily on the side of the market
Taxes
Tax burden
Falls more heavily on the side of the market

Who pays the luxury tax?
1990 - new luxury tax
On yachts, private
Who pays the luxury tax?
1990 - new luxury tax
On yachts, private
 Круг лиц, обеспечиваемых страховыми выплатами в порядке обязательного социального страхования от несчастных случаев
 Международное право
 Межевой план
 Нормативно-правовая база деятельности старшего вожатого
 Сущность, понятие, задачи и организация прокурорского надзора за исполнением законов при рассмотрении гражданских дел в судах
 ТР ТС
ТР ТС Методика расследования поджогов и нарушения правил пожарной безопасности
 Социология права
 Порядок действий при переводе жилого помещения в нежилое, а нежилого в жилое в случае перепланировки
 Засоби оперативно-розшукової діяльності
 Действие международных договоров
 Коммерческие помещения в жилом комплексе Барская усадьба
 Организация управления в области градостроительства
 Новые правила начисления коммунальных ресурсов в целях содержания общего имущества (ОДН)
 Предпринимательская деятельность и её виды
 Нарушения законодательства Российской Федерации о налогах и сборах и ответственность за их совершения
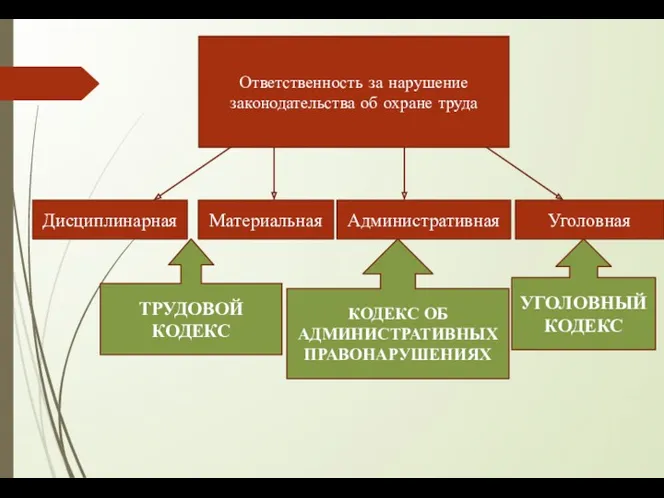 Ответственность за нарушение законодательства об охране труда
 Федеральные министерства, федеральные службы и федеральные агентства в управлении земельными ресурсами
 Предпосылки правомерного поведения
 Преступность среди подростков
 Стипендии и материальная помощь
 Защита прав ребёнка на международном уровне
 Законодательство РФ о контрактной системе в сфере закупок товаров, услуг для обеспечения государственных и муниципальных нужд
 Державна митна служба України. Положення про діяльність
 Президент РФ. (Тема 11)
 Основы функционирования накопительно-ипотечной системы жилищного обеспечения военнослужащих
 Преступность и её основные показатели
 Технико-юридические средства подготовки нормативного правового акта