- Definition capacity

Содержание
- 2. The only way to win significantly higher profits is through new capacity – but it is
- 3. JAP Definition of Capacity Capacity is the limiting capability of a productive unit to produce within
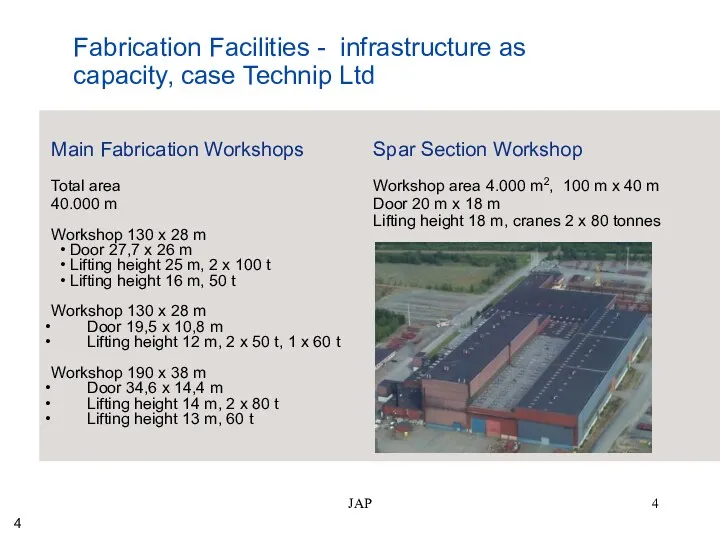
- 4. JAP Main Fabrication Workshops Total area 40.000 m Workshop 130 x 28 m Door 27,7 x
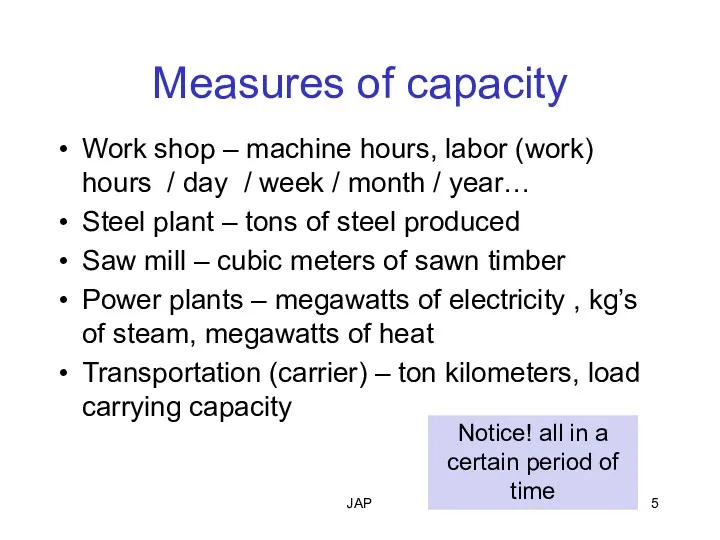
- 5. JAP Measures of capacity Work shop – machine hours, labor (work) hours / day / week
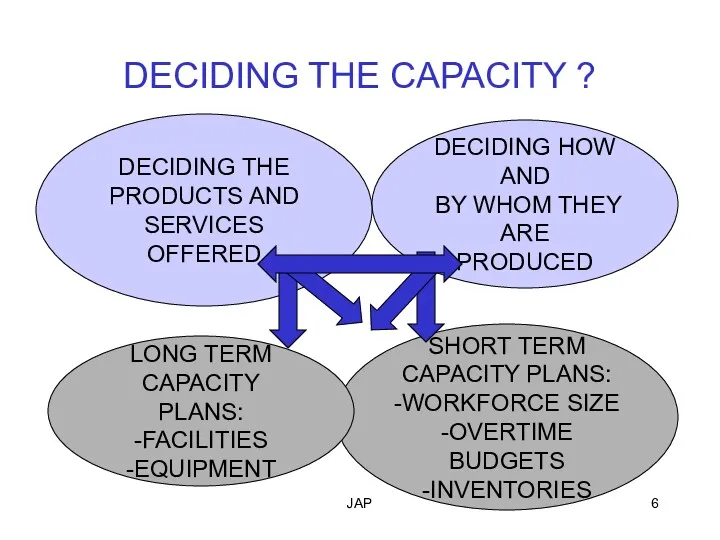
- 6. JAP SHORT TERM CAPACITY PLANS: -WORKFORCE SIZE -OVERTIME BUDGETS -INVENTORIES LONG TERM CAPACITY PLANS: -FACILITIES -EQUIPMENT
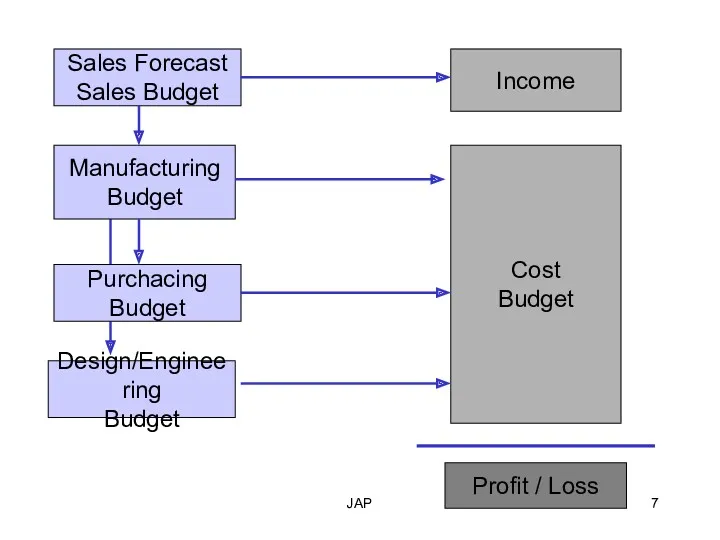
- 7. JAP Sales Forecast Sales Budget Income Manufacturing Budget Purchacing Budget Design/Engineering Budget Cost Budget Profit /
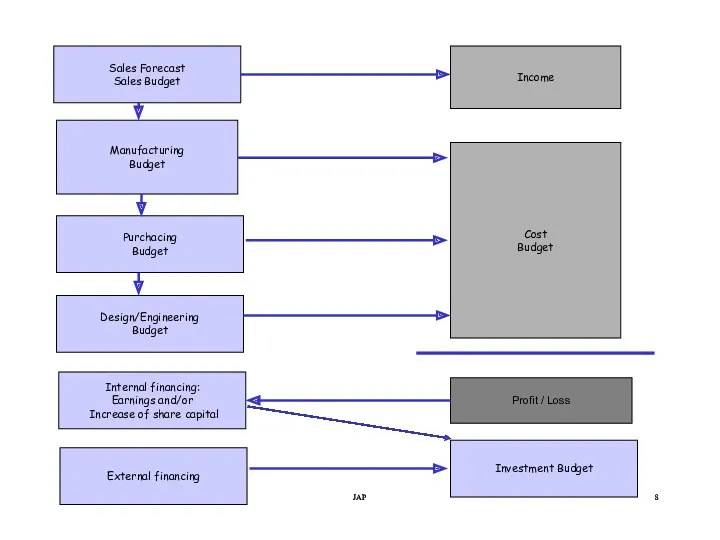
- 8. JAP JAP Sales Forecast Sales Budget Income Manufacturing Budget Purchacing Budget Design/Engineering Budget Cost Budget Profit
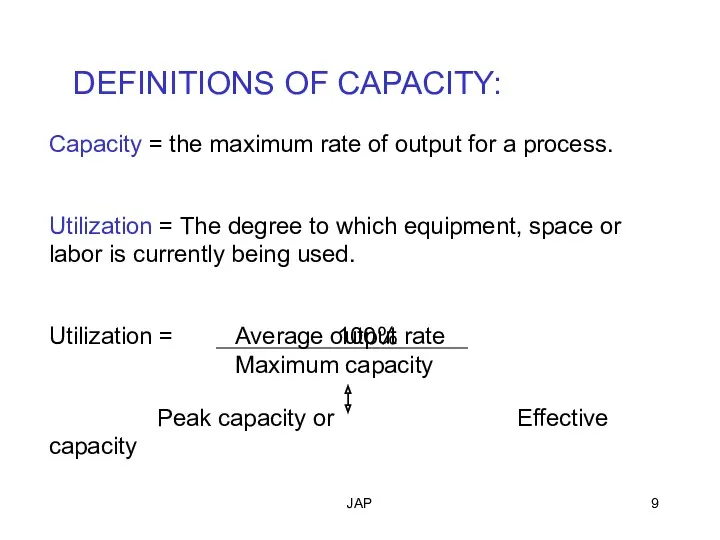
- 9. JAP DEFINITIONS OF CAPACITY: Capacity = the maximum rate of output for a process. Utilization =
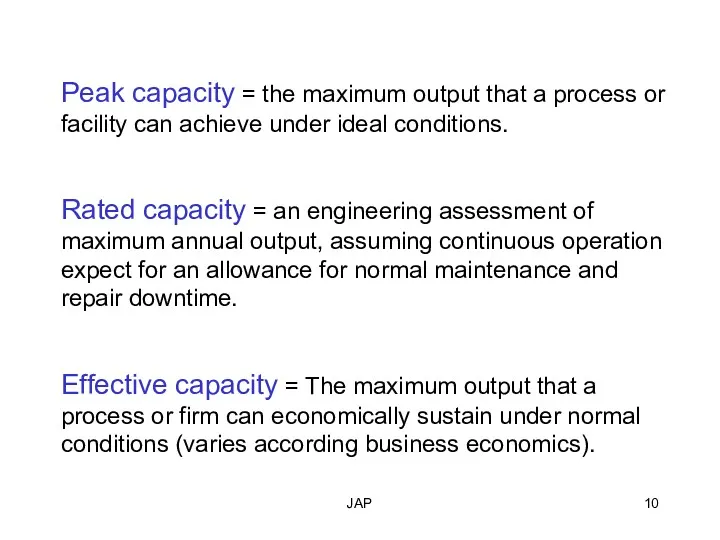
- 10. JAP Peak capacity = the maximum output that a process or facility can achieve under ideal
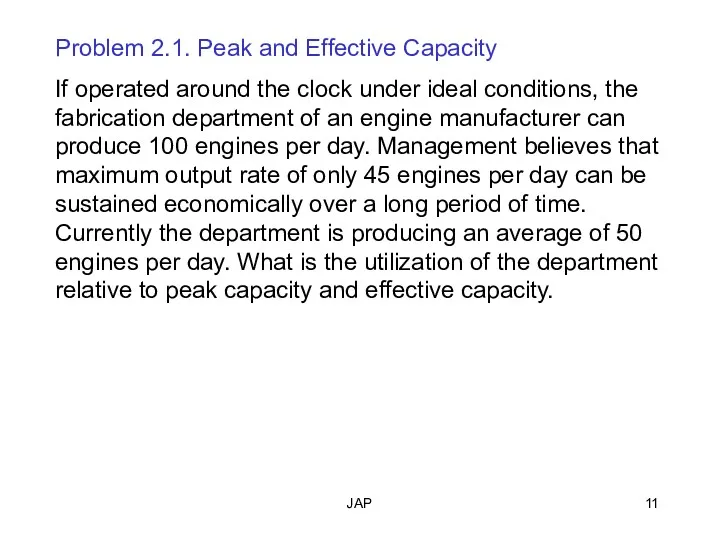
- 11. JAP Problem 2.1. Peak and Effective Capacity If operated around the clock under ideal conditions, the
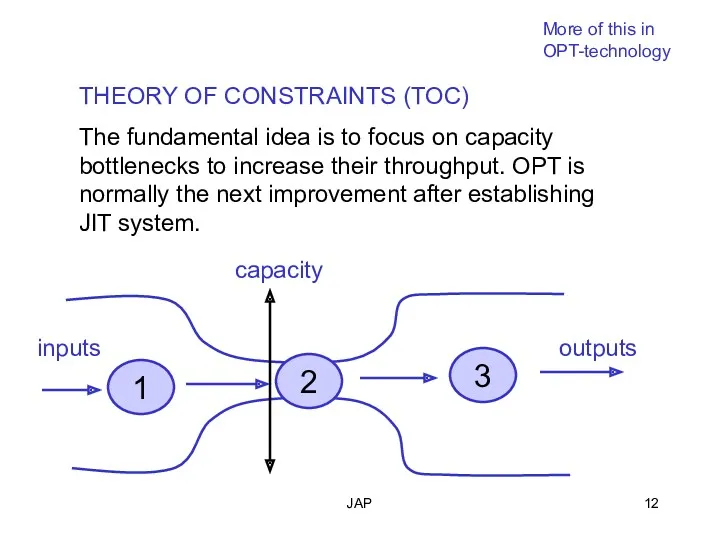
- 12. JAP THEORY OF CONSTRAINTS (TOC) The fundamental idea is to focus on capacity bottlenecks to increase
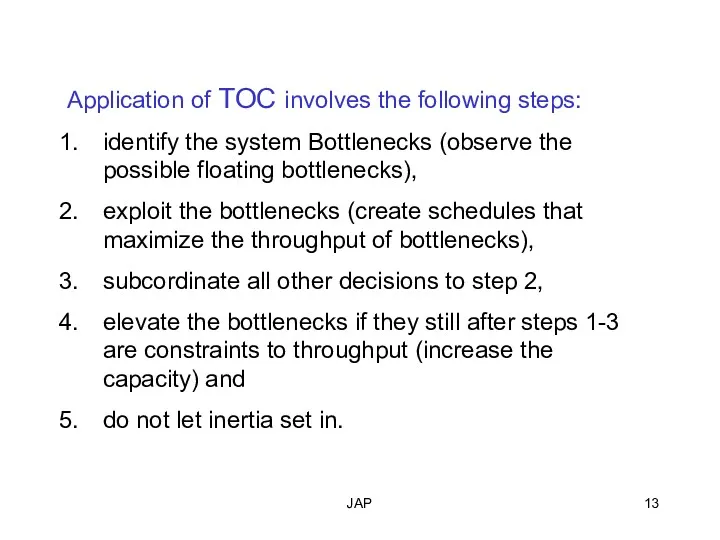
- 13. JAP Application of TOC involves the following steps: identify the system Bottlenecks (observe the possible floating
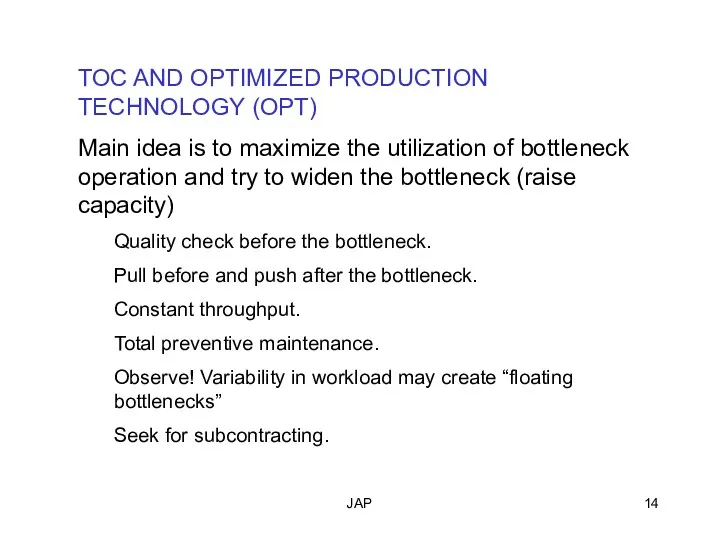
- 14. JAP TOC AND OPTIMIZED PRODUCTION TECHNOLOGY (OPT) Main idea is to maximize the utilization of bottleneck
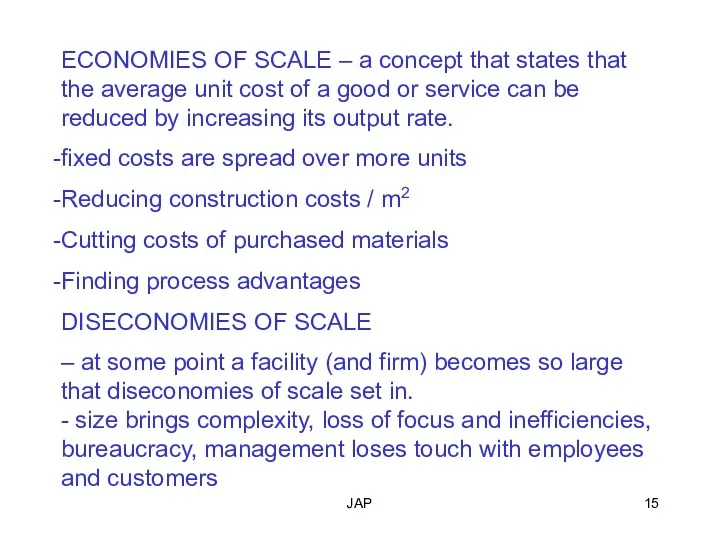
- 15. JAP ECONOMIES OF SCALE – a concept that states that the average unit cost of a
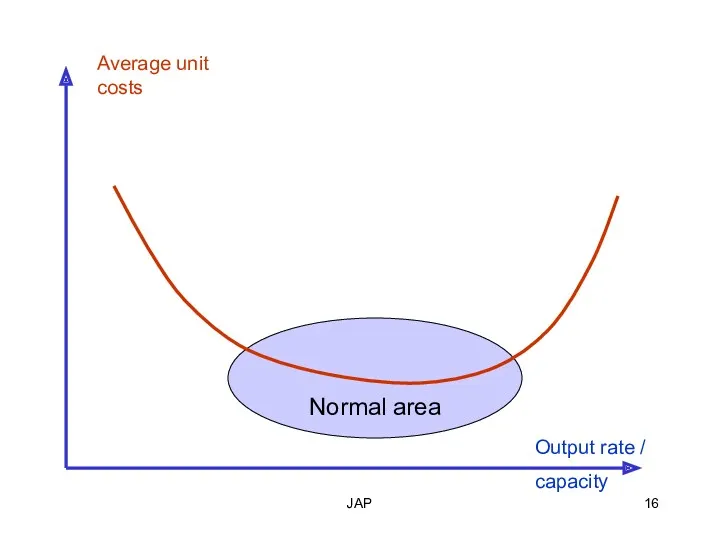
- 16. JAP Normal area Output rate / capacity Average unit costs
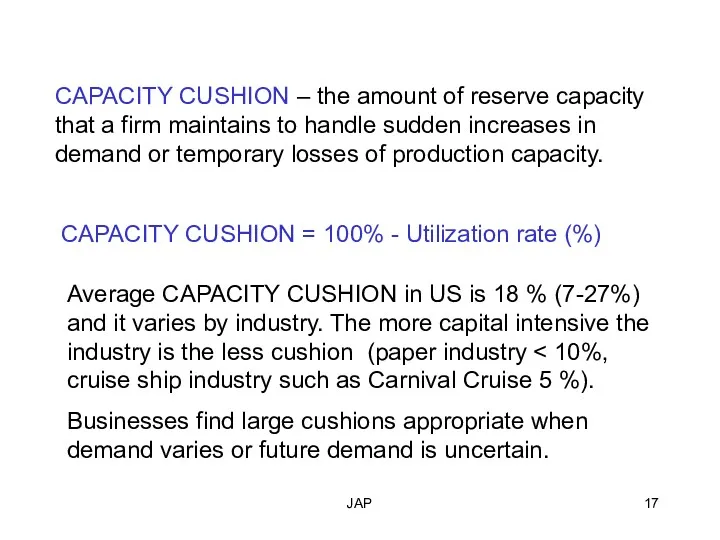
- 17. JAP CAPACITY CUSHION – the amount of reserve capacity that a firm maintains to handle sudden
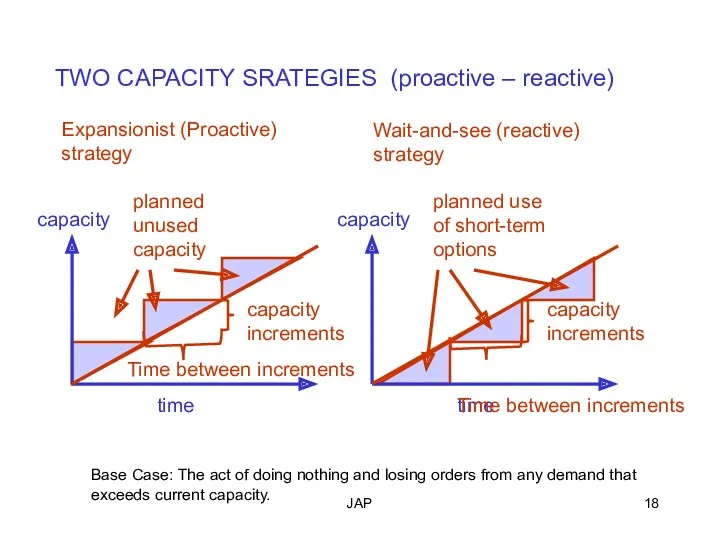
- 18. JAP TWO CAPACITY SRATEGIES (proactive – reactive) time capacity planned unused capacity Time between increments capacity
- 19. JAP Although each situation is somewhat different, a four-step procedure can help managers make sound capacity
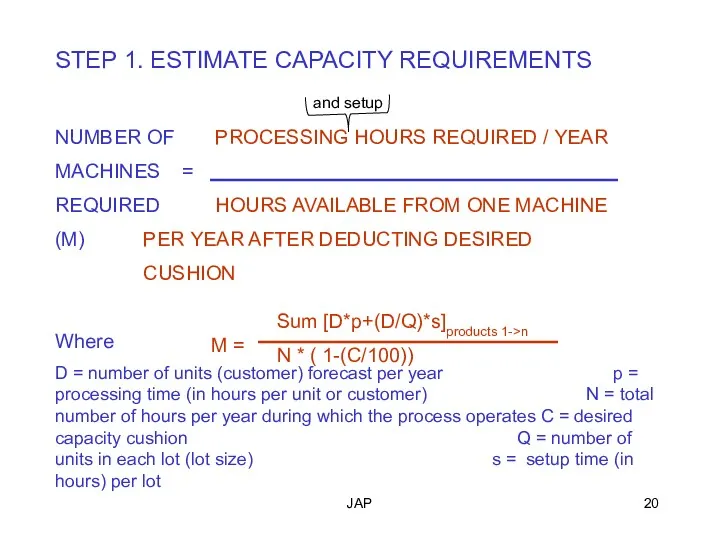
- 20. JAP STEP 1. ESTIMATE CAPACITY REQUIREMENTS NUMBER OF PROCESSING HOURS REQUIRED / YEAR MACHINES = REQUIRED
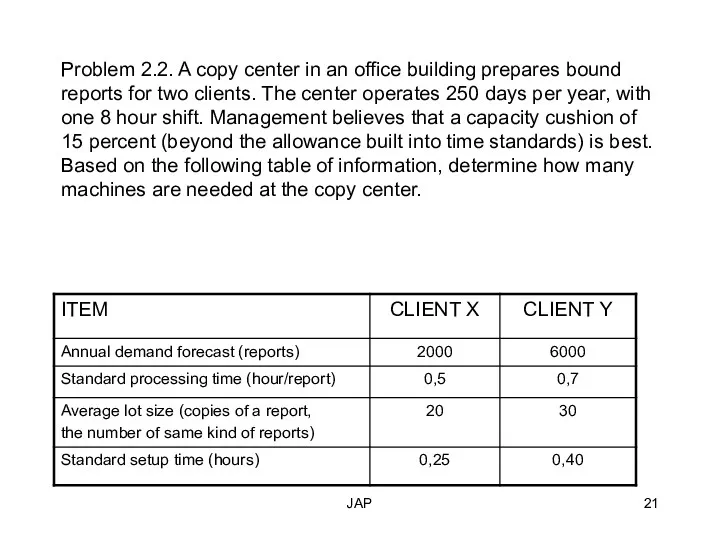
- 21. JAP Problem 2.2. A copy center in an office building prepares bound reports for two clients.
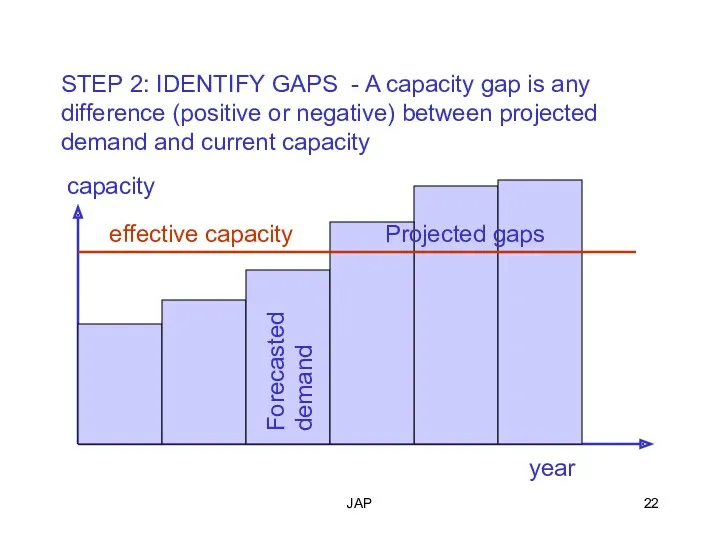
- 22. JAP STEP 2: IDENTIFY GAPS - A capacity gap is any difference (positive or negative) between
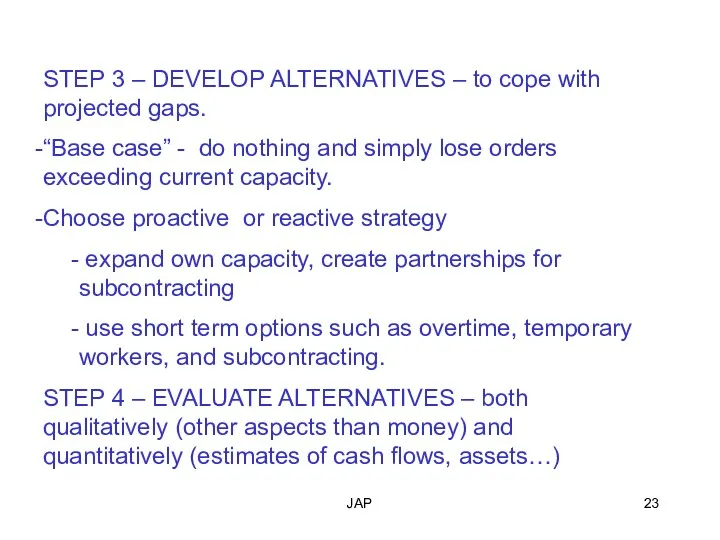
- 23. JAP STEP 3 – DEVELOP ALTERNATIVES – to cope with projected gaps. “Base case” - do
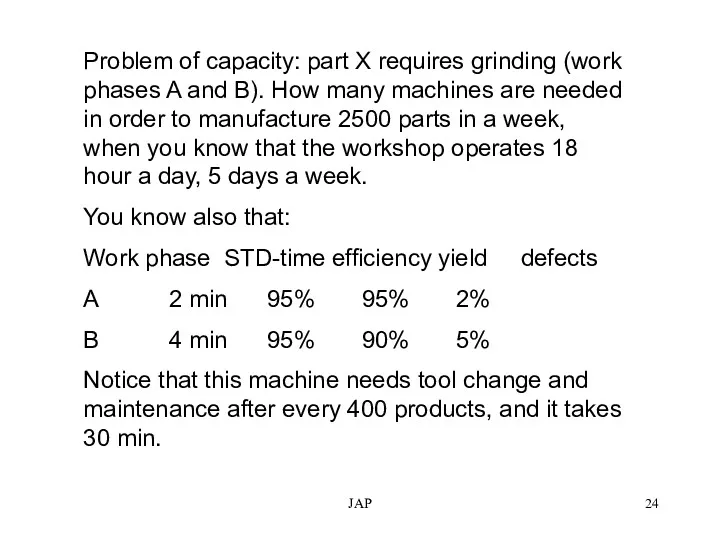
- 24. JAP Problem of capacity: part X requires grinding (work phases A and B). How many machines
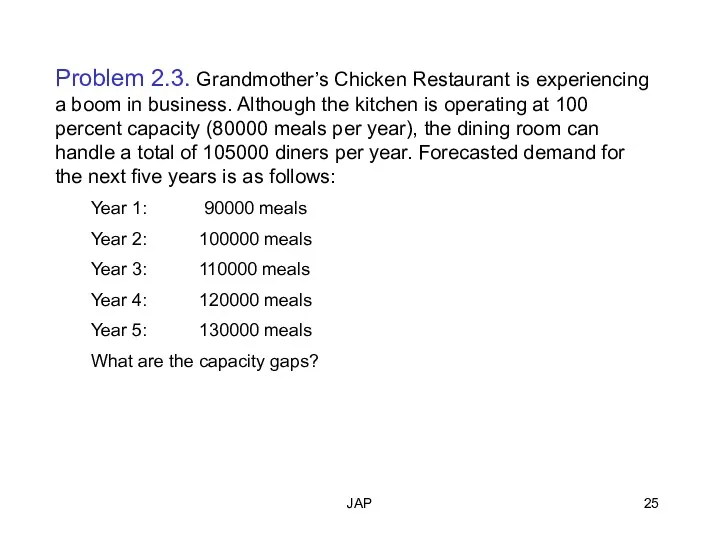
- 25. JAP Problem 2.3. Grandmother’s Chicken Restaurant is experiencing a boom in business. Although the kitchen is
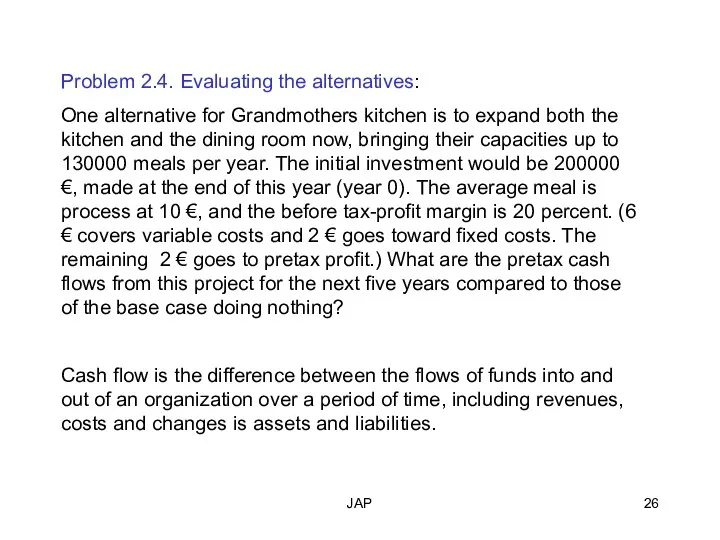
- 26. JAP Problem 2.4. Evaluating the alternatives: One alternative for Grandmothers kitchen is to expand both the
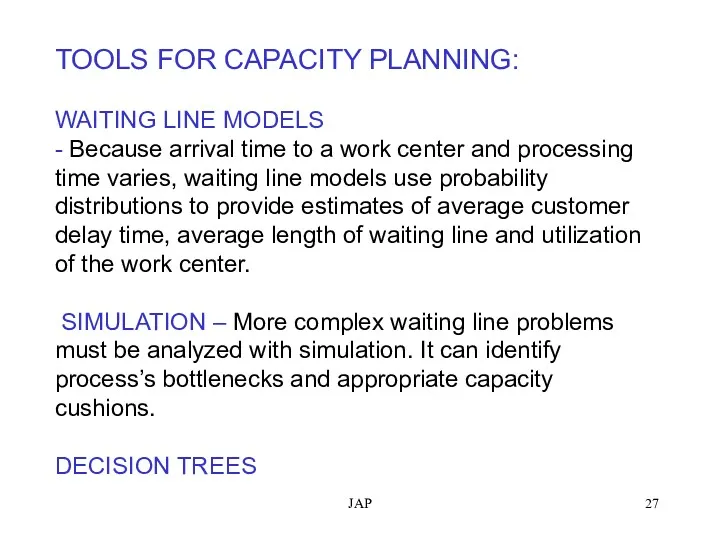
- 27. JAP TOOLS FOR CAPACITY PLANNING: WAITING LINE MODELS - Because arrival time to a work center
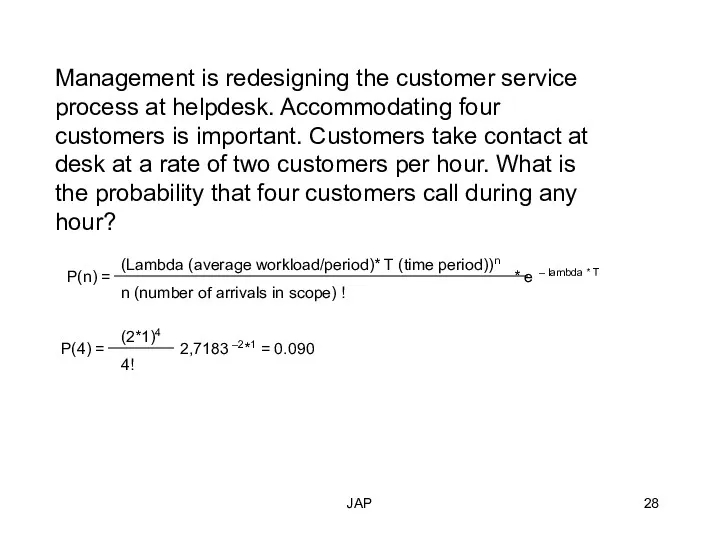
- 28. JAP Management is redesigning the customer service process at helpdesk. Accommodating four customers is important. Customers
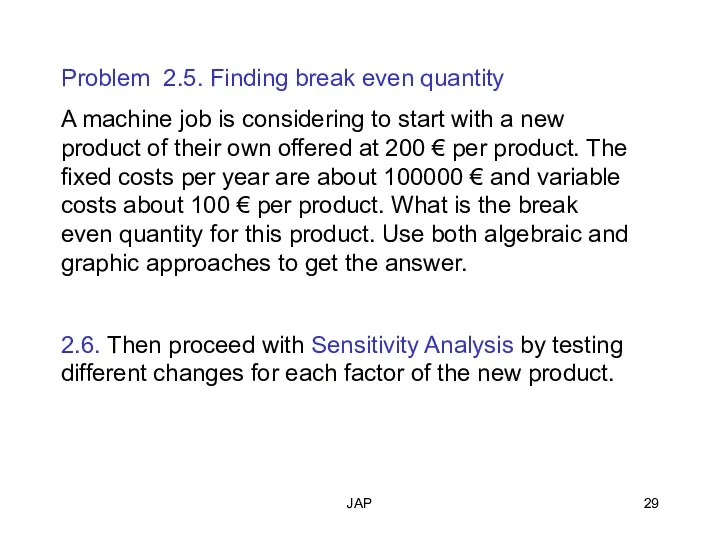
- 29. JAP Problem 2.5. Finding break even quantity A machine job is considering to start with a
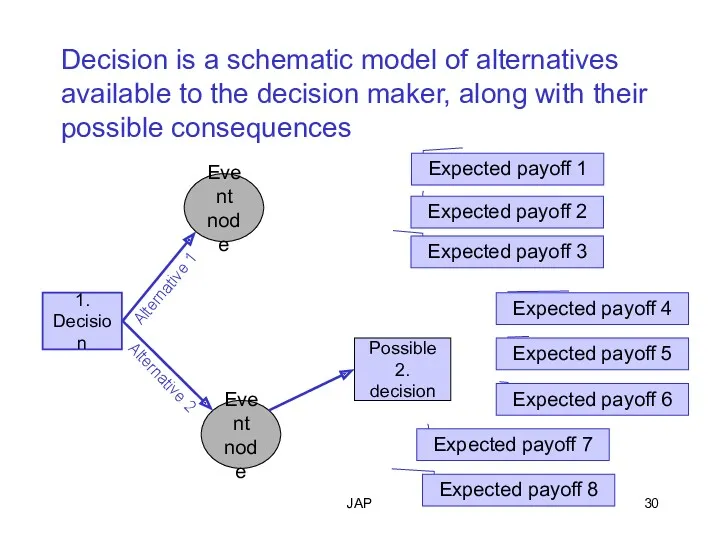
- 30. JAP Decision is a schematic model of alternatives available to the decision maker, along with their
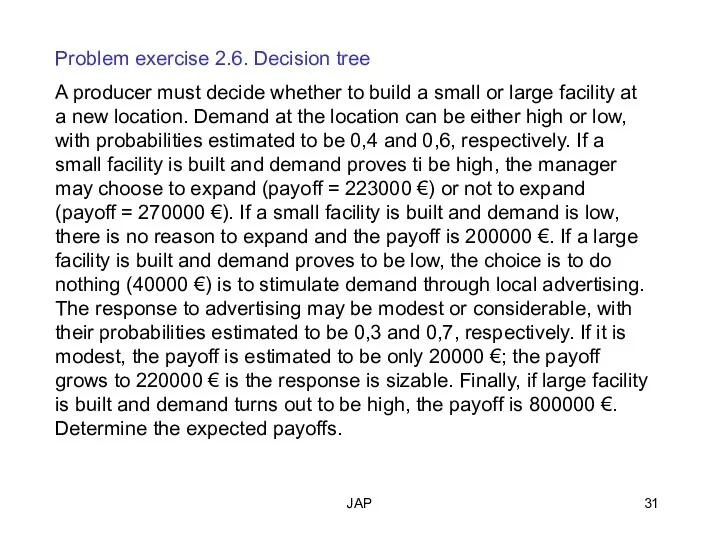
- 31. JAP Problem exercise 2.6. Decision tree A producer must decide whether to build a small or
- 33. Скачать презентацию
The only way to win significantly higher profits is through new
The only way to win significantly higher profits is through new
JAP
Definition of Capacity
Capacity is the limiting capability of a productive unit
JAP
Definition of Capacity
Capacity is the limiting capability of a productive unit
JAP
Main Fabrication Workshops
Total area
40.000 m
Workshop 130 x 28 m
Door
JAP
Main Fabrication Workshops
Total area
40.000 m
Workshop 130 x 28 m
Door
JAP
Measures of capacity
Work shop – machine hours, labor (work) hours /
JAP
Measures of capacity
Work shop – machine hours, labor (work) hours /
JAP
SHORT TERM
CAPACITY PLANS:
-WORKFORCE SIZE
-OVERTIME BUDGETS
-INVENTORIES
LONG TERM
CAPACITY PLANS:
-FACILITIES
-EQUIPMENT
DECIDING HOW AND
JAP
SHORT TERM
CAPACITY PLANS:
-WORKFORCE SIZE
-OVERTIME BUDGETS
-INVENTORIES
LONG TERM
CAPACITY PLANS:
-FACILITIES
-EQUIPMENT
DECIDING HOW AND
JAP
Sales Forecast
Sales Budget
Income
Manufacturing
Budget
Purchacing
Budget
Design/Engineering
Budget
Cost
Budget
Profit / Loss
JAP
Sales Forecast
Sales Budget
Income
Manufacturing
Budget
Purchacing
Budget
Design/Engineering
Budget
Cost
Budget
Profit / Loss
JAP
JAP
Sales Forecast
Sales Budget
Income
Manufacturing
Budget
Purchacing
Budget
Design/Engineering
Budget
Cost
Budget
Profit / Loss
Investment Budget
External financing
Internal financing:
Earnings and/or
JAP
JAP
Sales Forecast
Sales Budget
Income
Manufacturing
Budget
Purchacing
Budget
Design/Engineering
Budget
Cost
Budget
Profit / Loss
Investment Budget
External financing
Internal financing:
Earnings and/or
JAP
DEFINITIONS OF CAPACITY:
Capacity = the maximum rate of output for a
JAP
DEFINITIONS OF CAPACITY:
Capacity = the maximum rate of output for a
JAP
Peak capacity = the maximum output that a process or facility
JAP
Peak capacity = the maximum output that a process or facility
JAP
Problem 2.1. Peak and Effective Capacity
If operated around the clock under
JAP
Problem 2.1. Peak and Effective Capacity
If operated around the clock under
JAP
THEORY OF CONSTRAINTS (TOC)
The fundamental idea is to focus on capacity
JAP
THEORY OF CONSTRAINTS (TOC)
The fundamental idea is to focus on capacity
JAP
Application of TOC involves the following steps:
identify the system Bottlenecks (observe
JAP
Application of TOC involves the following steps:
identify the system Bottlenecks (observe
JAP
TOC AND OPTIMIZED PRODUCTION TECHNOLOGY (OPT)
Main idea is to maximize the
JAP
TOC AND OPTIMIZED PRODUCTION TECHNOLOGY (OPT)
Main idea is to maximize the
JAP
ECONOMIES OF SCALE – a concept that states that the average
JAP
ECONOMIES OF SCALE – a concept that states that the average
JAP
Normal area
Output rate /
capacity
Average unit costs
JAP
Normal area
Output rate /
capacity
Average unit costs
JAP
CAPACITY CUSHION – the amount of reserve capacity that a firm
JAP
CAPACITY CUSHION – the amount of reserve capacity that a firm
JAP
TWO CAPACITY SRATEGIES (proactive – reactive)
time
capacity
planned unused capacity
Time between increments
capacity increments
Expansionist
JAP
TWO CAPACITY SRATEGIES (proactive – reactive)
time
capacity
planned unused capacity
Time between increments
capacity increments
Expansionist
JAP
Although each situation is somewhat different, a four-step procedure can help
JAP
Although each situation is somewhat different, a four-step procedure can help
JAP
STEP 1. ESTIMATE CAPACITY REQUIREMENTS
NUMBER OF PROCESSING HOURS REQUIRED / YEAR
MACHINES
JAP
STEP 1. ESTIMATE CAPACITY REQUIREMENTS
NUMBER OF PROCESSING HOURS REQUIRED / YEAR
MACHINES
JAP
Problem 2.2. A copy center in an office building prepares bound
JAP
Problem 2.2. A copy center in an office building prepares bound
JAP
STEP 2: IDENTIFY GAPS - A capacity gap is any difference
JAP
STEP 2: IDENTIFY GAPS - A capacity gap is any difference
JAP
STEP 3 – DEVELOP ALTERNATIVES – to cope with projected gaps.
“Base
JAP
STEP 3 – DEVELOP ALTERNATIVES – to cope with projected gaps.
“Base
JAP
Problem of capacity: part X requires grinding (work phases A and
JAP
Problem of capacity: part X requires grinding (work phases A and
JAP
Problem 2.3. Grandmother’s Chicken Restaurant is experiencing a boom in business.
JAP
Problem 2.3. Grandmother’s Chicken Restaurant is experiencing a boom in business.
JAP
Problem 2.4. Evaluating the alternatives:
One alternative for Grandmothers kitchen is
JAP
Problem 2.4. Evaluating the alternatives:
One alternative for Grandmothers kitchen is
JAP
TOOLS FOR CAPACITY PLANNING:
WAITING LINE MODELS
- Because arrival time to a
JAP
TOOLS FOR CAPACITY PLANNING: WAITING LINE MODELS - Because arrival time to a
JAP
Management is redesigning the customer service process at helpdesk. Accommodating four
JAP
Management is redesigning the customer service process at helpdesk. Accommodating four
JAP
Problem 2.5. Finding break even quantity
A machine job is considering to
JAP
Problem 2.5. Finding break even quantity
A machine job is considering to
JAP
Decision is a schematic model of alternatives available to the decision
JAP
Decision is a schematic model of alternatives available to the decision
JAP
Problem exercise 2.6. Decision tree
A producer must decide whether to build
JAP
Problem exercise 2.6. Decision tree
A producer must decide whether to build
 Рынок труда и социальная политика регионов
 Элементы методики экономического анализа
 Міжнародний ринок товарів, послуг та інновацій
 Субъекты и объекты международных экономических отношений
 Институционализм
 Исследование перехода к хаосу в экономических системах
 Дискриминация на рынке труда
 Macroeconomic Indicators: What They Are & How to Use Them
 Основные этапы развития экономической теории
 Экономикалық теорияның пәні және зерттеу әдістері
 Противоречия размещения производительных сил и регионального развития
 Гравитационная модель и социально-экономическое развитие Курской области и Черноземья
 Италия. Миграция рабочей силы
 Безработица: причины и последствия
 Лекция № 5. Вмешательство государства и общественное благосостояние
 Український ринок M&A: злиття і поглинання українських компаній
 Прямое действие международных договоров системы ВТО (всемирная торговая организация) в России
 Макроэкономическое равновесие в открытой экономике
 Анализ экономической деятельности автотранспортных предприятий. Краткий курс МДК
 Введение в микроэкономику
 Анализ эффективности работы исследуемого предприятия
 Управление товарными запасами в фармацевтической организации
 Экономические институты и собственность в рыночной экономике
 Планування і аналіз трудових показників
 Расчет показателей использования трудовых ресурсов предприятия
 Статистика затрат и промежуточного потребления
 Причины безработицы
 Тема 7. Рынок труда. Заработная плата