- Demand and supply

Содержание
- 2. DEMAND AND SUPPLY 3
- 3. After studying this chapter, you will be able to: Describe a competitive market and think about
- 4. Markets and Prices A market is any arrangement that enables buyers and sellers to get information
- 5. Demand If you demand something, then you 1. Want it, 2. Can afford it, and 3.
- 6. Demand The Law of Demand The law of demand states: Other things remaining the same, the
- 7. Demand Substitution Effect When the relative price (opportunity cost) of a good or service rises, people
- 8. Demand Demand Curve and Demand Schedule The term demand refers to the entire relationship between the
- 9. Demand Figure 3.1 shows a demand curve for energy bars.
- 11. Demand A rise in the price, other things remaining the same, brings a decrease in the
- 12. Demand Willingness and Ability to Pay A demand curve is also a willingness-and-ability-to-pay curve. The smaller
- 13. Demand A Change in Demand When some influence on buying plans other than the price of
- 14. Demand Six main factors that change demand are: The prices of related goods Expected future prices
- 15. Demand Prices of Related Goods A substitute is a good that can be used in place
- 16. Demand Expected Future Prices If the price of a good is expected to rise in the
- 17. Demand Expected Future Income and Credit When income is expected to increase in the future or
- 18. Demand Figure 3.2 shows an increase in demand. An increase in income increases the demand for
- 20. Demand A Change in the Quantity Demanded Versus a Change in Demand Figure 3.3 illustrates the
- 22. Demand Movement Along the Demand Curve When the price of the good changes and other things
- 23. Demand A Shift of the Demand Curve If the price remains the same but one of
- 24. Supply If a firm supplies a good or service, then the firm 1. Has the resources
- 25. Supply The Law of Supply The law of supply states: Other things remaining the same, the
- 26. Supply Supply Curve and Supply Schedule The term supply refers to the entire relationship between the
- 27. Supply Figure 3.4 shows a supply curve of energy bars. A rise in the price, other
- 29. Minimum Supply Price A supply curve is also a minimum-supply-price curve. As the quantity produced increases,
- 30. Supply A Change in Supply When some influence on selling plans other than the price of
- 31. Supply The six main factors that change supply of a good are The prices of factors
- 32. Supply Prices of Factors of Production If the price of a factor of production used to
- 33. Supply Prices of Related Goods Produced A substitute in production for a good is another good
- 34. Supply Expected Future Prices If the price of a good is expected to rise in the
- 35. Supply Technology Advances in technology create new products and lower the cost of producing existing products.
- 36. Supply Figure 3.5 shows an increase in supply. An advance in the technology increases the supply
- 38. Supply A Change in the Quantity Supplied Versus a Change in Supply Figure 3.6 illustrates the
- 40. Movement Along the Supply Curve When the price of the good changes and other influences on
- 41. A Shift of the Supply Curve If the price remains the same but some other influence
- 42. Market Equilibrium Equilibrium is a situation in which opposing forces balance each other. Equilibrium in a
- 43. Market Equilibrium Figure 3.7 illustrates the market equilibrium—the price at which quantity demanded equals quantity supplied.
- 44. Market Equilibrium Price as a Regulator If the price is $2.00 a bar, the quantity supplied
- 46. Market Equilibrium If the price is $1.00 a bar, the quantity demanded exceeds the quantity supplied.
- 47. Market Equilibrium If the price is $1.50 a bar, the quantity supplied equals the quantity demanded.
- 48. Price Adjustments At prices above the equilibrium price, a surplus forces the price down. At prices
- 49. Predicting Changes in Price and Quantity An Increase in Demand Figure 3.8 shows that when demand
- 51. A Decrease in Demand The figure shows that when demand decreases the demand curve shifts leftward.
- 52. Predicting Changes in Price and Quantity An Increase in Supply Figure 3.9 shows that when supply
- 54. A Decrease in Supply The figure shows that when supply decreases the supply curve shifts leftward.
- 55. Changes in Both Demand and Supply A change in both demand and supply changes the equilibrium
- 56. Predicting Changes in Price and Quantity Both Demand and Supply Change in the Same Direction An
- 58. Predicting Changes in Price and Quantity A decrease in both demand and supply decreases the equilibrium
- 60. Predicting Changes in Price and Quantity Both Demand and Supply Change in Opposite Directions A decrease
- 62. Predicting Changes in Price and Quantity An increase in demand and a decrease in supply raises
- 64. Скачать презентацию
 Урок по экономике Устройство рынка капитала
 Учет инфляции и оценка инвестиционных рисков и ликвидности инвестиций
 Государственный финансовый контроль за расходами федерального бюджета на поддержку сельского хозяйства
 Анализ производства и реализации продукции
 Совершенствование кадрового обеспечения АПК Костромской области
 Сущность и виды рынков
 Бәсекелестік қурес стратегиясы
 Preţurile în cadrul comerţului internaţional
 Предпринимательство. Тренинг
 Основные фонды предприятия
 Инновационная политика как фактор повышения антикризисной устойчивости торговых предприятий
 Теории международной торговли
 Мировые рынки нефти и газа
 Взаимодействие спроса и предложения
 Медиасреда современного общества. Экономический дискурс современных медиа. Конкуренция в российской медиасреде
 Инновационные ресуры в современном развитии экономики предприятия
 Государственное регулирование каналов распределения
 Повышение регулирующей роли государства в экономике ведущих стран мира в межвоенный период
 Неопределенность и риски логистической деятельности. Опыт хеджирования рисков
 Информационные технологии в экономике. Управление эффективностью бизнеса. Лекция 12
 Разработка урока по экономике 8 класс на тему Зачем нужна биржа
 Маржинализм мектебі
 Снижение использования ископаемых энергоресурсов с применением возобновляемых источников энергии
 Анализ формирования и исполнения бюджета пенсионного фонда РФ
 Chartered Financial Analyst® exam (level 1). Study Session 5. Economics
 Системы, их строение и функционирование
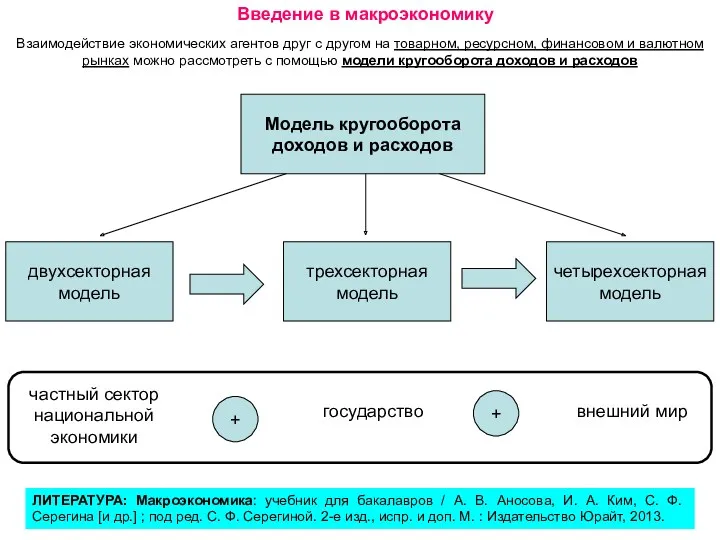 Модель кругооборота доходов и расходов
 Объединение капитала. Интеграционные формы предпринимательства