Слайд 2
Introduction
How adding international capital flows amends the way macroeconomic policy operates?
In
1980s trade deficit in the USA widened, due to international flows of capital (caused by the US monetary and fiscal policy)
What drives international capital flows?
Rate of return offered by various countries on their assets
Investors’ awarennes of future changes to the FX rate, etc.
In this capter, we stick to the rate of return, as the single important determinant
What determines the interest rate (rate of return to assets) in one country?
In autarky: supply and demand for money in that country
In open economy: international arbitrage would enter into motion (capital will move towards its most productive use)
i (home country interest rate); i* (foreign country interest rate)
KA is positive (i>i*), when investors from abroad buy assets in a domestic country, or when residents borrow abroad to acquire assets in domestic country
Слайд 3
Outline
The Model
Fiscal Policy and Degree of Capital Mobility under Fixed Exchange
Rate
Monetary Policy and Degree of Capital Mobility under Fixed Exchange Rate
Nonsterilization and Capital Mobility
Other Automatic Mechanisms of Adjustment
The Pursuit of Internal and External Balance
Слайд 4
The Model
LM curve:
LM curve: relationship between the income Y, and the
interest rate i, that gives equilibrium at the money market (real money supply M/P, equals real money demand)
LM curve: real money supply, sloped upwards as income and interest rate have opposite effects on real money demand: increase in income raises money demand – without accommodating transactions, this will drive interest rates up, thus reducing money demand, as capital will be invested now in other assets
If prices are fixed, expansionary monetary policy will raise real money supply, shifting LM curve to the right (rise in income)
Слайд 5
The Model
IS curve:
IS curve: relationship between output Y and interest rate
i, giving equilibrium at the goods market (amount of goods produced equals the amount of goods demanded)
Downward sloped, because interest rate has a second role: rise in interest rate discourages investments and expenditures (consumer loans become more expensive), thus discouraging output
IS curve is drawn contingent on the given level of government expenditure: increase in any components of G, shifts IS curve to the right, by the amount of Keynesian multiplier
multiplier 1/(s+m) is smaller than under the closed economy assumption (1/s)
The effects on income in complete IS-LM model is smaller, as the higher transaction demand for money drives interest rate up and discourages investments (investment crowded out)
IS curve can be shifted to the right also due to increase in demand for domestic goods by residents or increase in demand for domestic goods by nonresidents (devaluation)
Слайд 6
The Model
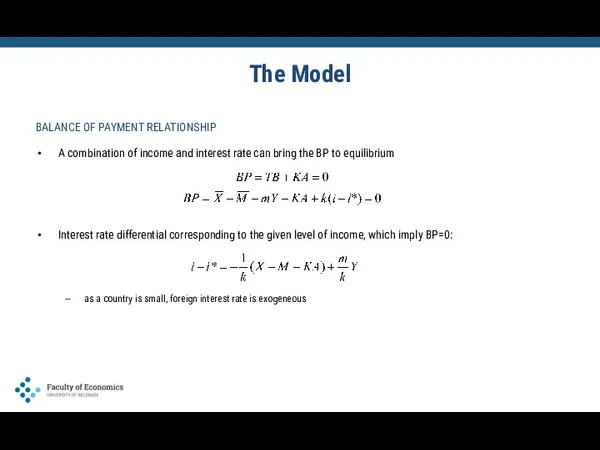
BALANCE OF PAYMENT RELATIONSHIP
A combination of income and interest rate
can bring the BP to equilibrium
Interest rate differential corresponding to the given level of income, which imply BP=0:
as a country is small, foreign interest rate is exogeneous
Слайд 7
The Model
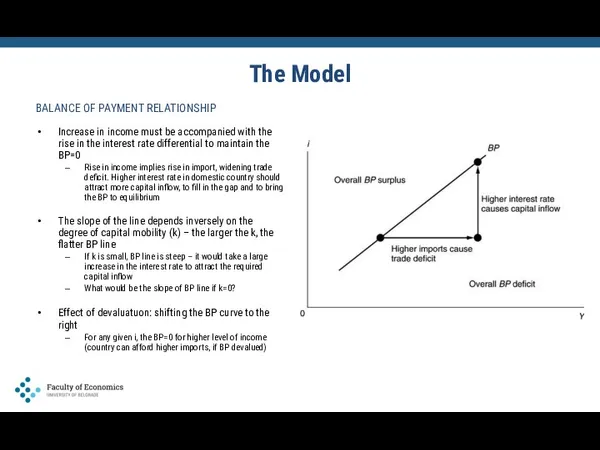
BALANCE OF PAYMENT RELATIONSHIP
Increase in income must be accompanied with
the rise in the interest rate differential to maintain the BP=0
Rise in income implies rise in import, widening trade deficit. Higher interest rate in domestic country should attract more capital inflow, to fill in the gap and to bring the BP to equilibrium
The slope of the line depends inversely on the degree of capital mobility (k) – the larger the k, the flatter BP line
If k is small, BP line is steep – it would take a large increase in the interest rate to attract the required capital inflow
What would be the slope of BP line if k=0?
Effect of devaluatuon: shifting the BP curve to the right
For any given i, the BP=0 for higher level of income (country can afford higher imports, if BP devalued)
Слайд 8
Fiscal Policy and the Degree of Capital Mobility
Under Fixed Rates
IMPACT
OF FISCAL EXPANSION ON BALANCE OF PAYMENT
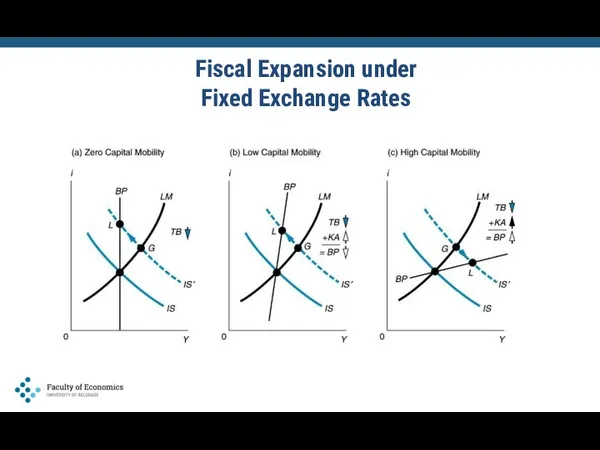
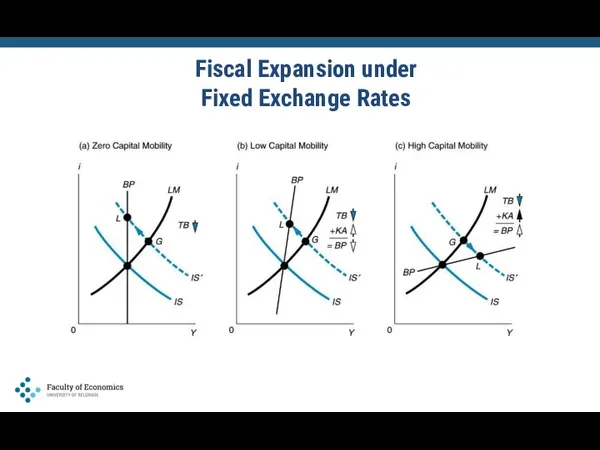
No capital mobility assumption: fiscal expansion, shifts IS curve to the right – rise in income increases transaction demand for money, thus lifting up the interest rates
BP deteriorates due to rise in imports, caused by higher incomes, while the central bank is selling foreign currency reserves
Capital mobility assumption: rise in interest rates attracts capital, thus improving the BP
Inflow of capital may cause rise in imports
The net effect (inflow of capital – rise in imports) on the BP will depend on the degree of capital mobility (if capital flows are sensitive to interest rates, BP shall improve and vice versa)
Low mobility - point G (after fiscal expansion) is below the BP line: deficit (but still smaller than under k=0)
a central bank is selling international reserves
High mobility - point G (after fiscal expansion) is above the BP line: surplus (inflow of capital outweights increase in imports)
a central bank adding on its international reserves
Слайд 9
Fiscal Expansion under
Fixed Exchange Rates
Слайд 10
Fiscal Policy and the Degree of Capital Mobility
Under Fixed Rates
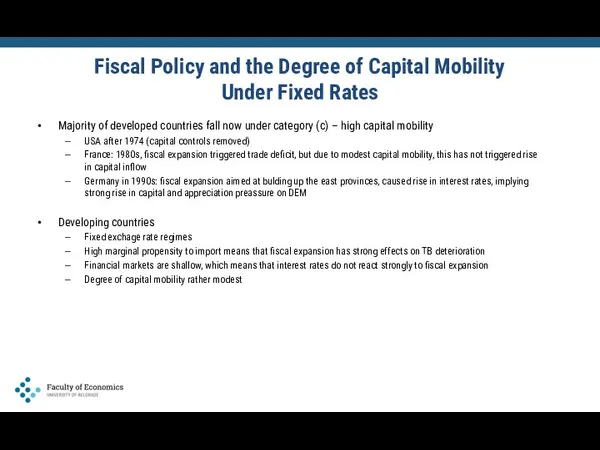
Majority
of developed countries fall now under category (c) – high capital mobility
USA after 1974 (capital controls removed)
France: 1980s, fiscal expansion triggered trade deficit, but due to modest capital mobility, this has not triggered rise in capital inflow
Germany in 1990s: fiscal expansion aimed at bulding up the east provinces, caused rise in interest rates, implying strong rise in capital and appreciation preassure on DEM
Developing countries
Fixed exchage rate regimes
High marginal propensity to import means that fiscal expansion has strong effects on TB deterioration
Financial markets are shallow, which means that interest rates do not react strongly to fiscal expansion
Degree of capital mobility rather modest
Слайд 11
Monetary Policy and the Degree of Capital Mobility
Under Fixed Rates
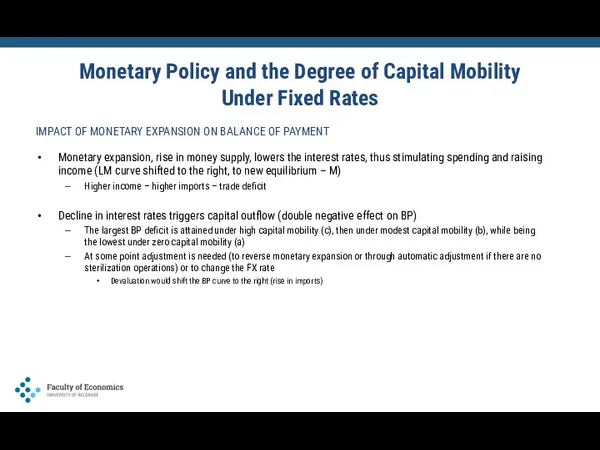
IMPACT
OF MONETARY EXPANSION ON BALANCE OF PAYMENT
Monetary expansion, rise in money supply, lowers the interest rates, thus stimulating spending and raising income (LM curve shifted to the right, to new equilibrium – M)
Higher income – higher imports – trade deficit
Decline in interest rates triggers capital outflow (double negative effect on BP)
The largest BP deficit is attained under high capital mobility (c), then under modest capital mobility (b), while being the lowest under zero capital mobility (a)
At some point adjustment is needed (to reverse monetary expansion or through automatic adjustment if there are no sterilization operations) or to change the FX rate
Devaluation would shift the BP curve to the right (rise in imports)
Слайд 12
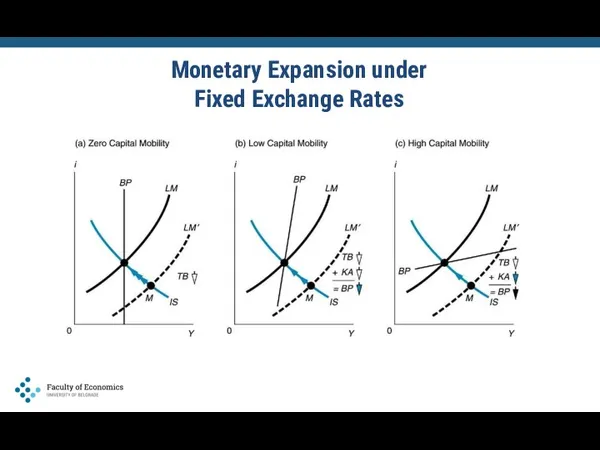
Monetary Expansion under
Fixed Exchange Rates
Слайд 13
When Money Flows Are Not Sterilized
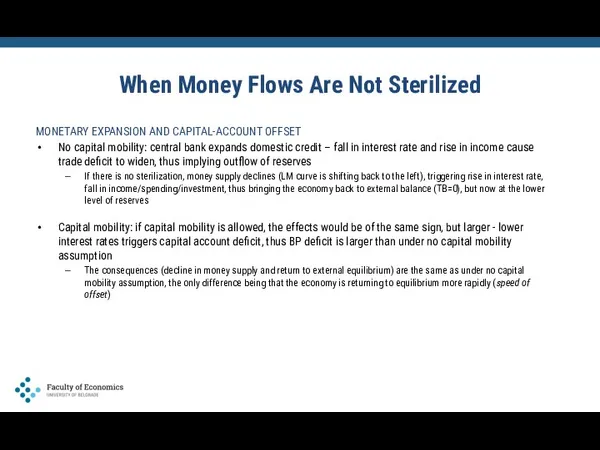
MONETARY EXPANSION AND CAPITAL-ACCOUNT OFFSET
No capital
mobility: central bank expands domestic credit – fall in interest rate and rise in income cause trade deficit to widen, thus implying outflow of reserves
If there is no sterilization, money supply declines (LM curve is shifting back to the left), triggering rise in interest rate, fall in income/spending/investment, thus bringing the economy back to external balance (TB=0), but now at the lower level of reserves
Capital mobility: if capital mobility is allowed, the effects would be of the same sign, but larger - lower interest rates triggers capital account deficit, thus BP deficit is larger than under no capital mobility assumption
The consequences (decline in money supply and return to external equilibrium) are the same as under no capital mobility assumption, the only difference being that the economy is returning to equilibrium more rapidly (speed of offset)
Слайд 14

When Money Flows Are Not Sterilized
FISCAL EXPANSION AND CAPITAL MOBILITY
No capital
mobility: government imposes fiscal expansion (shifting IS curve to the right), triggering rise in income and widening of trade deficit
Trade deficit – decline in money supply (no sterilization), shift of LM curve to the left – increase in interest rates – decrease in expenditures – decline in trade deficit – gradual return to BP equilibrium (no effect on the long run output)
Modest capital mobility: nonsterilized decline of reserves due to trade deficit – decline in money supply and level of income
However, new level of income is still somewhat higher than before the expansion
High capital mobility: point G implies BP surplus (due to large inflow of capital), building up international reserves
without sterilization money supply rises
LM curve shifts to the right
decline in interest rate and rise in spending
the new equilibrium is at point L, where the capital inflow equals to the trade deficit
output is higher than before fiscal expansion as well compared to the short run level
Слайд 15
Fiscal Expansion under
Fixed Exchange Rates
Слайд 16
When Money Flows Are Not Sterilized
Are Capital Flows and Money Flows
the Same Thing?
Money flows in/out through the capital account, but also through the trade balance
Money is truly flowing-in only if there is a BP surplus
But it does not mean that money supply rises (it might me sterilized)
Instead the term „inflow of money“, capital flows may be more properly described using other terms: borrowing from abroad, foreign financing, foreign investment position, etc.
Under monetary approach, the overall BP in the long run is zero, although money is flowing through the capital account at the same rate it flows out through trade balance (due to higher interest rates)
In the long run all three curves intersect (not just the IS and LM)
Слайд 17
Other Automatic Mechanisms of Adjustment
Under capital mobility assumption, fiscal policy may
have long run impact on output, due to several reasons ommited by the model
Inflationary preassure
Due to inflationary preassure caused by excess demand, real money supply declines, with discouraging effects on spending
Change in stock of bonds
In equilibrium (L), government still runs budget deficit which means that the stock of government bonds held by private sector is rising. At the same time, there is a current account deficit, which means that the supply of foreign bonds held by public is decreasing
Decline in holding of bonds by HHs is equivalent to deterioration of its wealth position, shifting the IS curve to the left (decline in spending) – the process may be in motion until the current account is brought back to balance and stock of bonds is brought back to initial position
Слайд 18
The Pursuit of Internal and External Balance
Recall two policy goals –
two instruments principle
Instruments: spending and exchange rate or spending and money supply (fiscal and monetary policy)
Can fiscal and monetary policy instruments together help attaining internal and external balance, under capital mobility assumption?
Слайд 19
The Pursuit of Internal and
External Balance
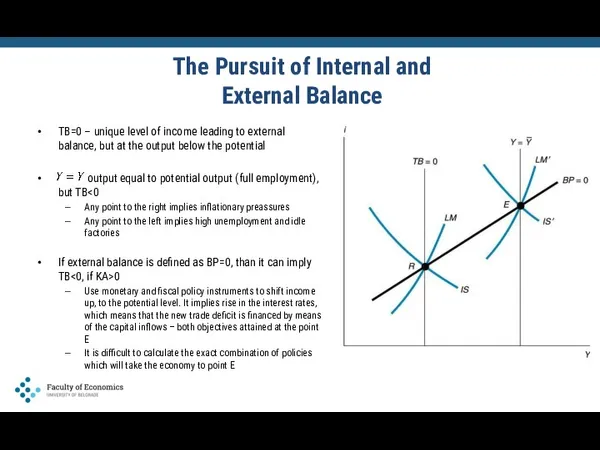
TB=0 – unique level of
income leading to external balance, but at the output below the potential
output equal to potential output (full employment), but TB<0
Any point to the right implies inflationary preassures
Any point to the left implies high unemployment and idle factories
If external balance is defined as BP=0, than it can imply TB<0, if KA>0
Use monetary and fiscal policy instruments to shift income up, to the potential level. It implies rise in the interest rates, which means that the new trade deficit is financed by means of the capital inflows – both objectives attained at the point E
It is difficult to calculate the exact combination of policies which will take the economy to point E

 Экономика промышленности
 Бюджетная политика Российской Федерации
 Транснациональная компания и регионы современного мира
 Методология неоклассической школы
 Трансакционные издержки. Понятие и классификация. Проблема измерения трансакционных издержек
 Экономическая основа социального государства
 Выталкивающая и вытягивающая системы планирования
 Организация стран - экспортеров нефти (ОПЕК)
 Индикаторы выхода из кризиса
 Қазақстанның экономикалық даму стратегиясы
 Денежно-кредитная политика государства
 Экономика. Предмет и метод
 Введение. Что такое экономика
 Халықаралық экономикалық интеграция
 Способ создания экономики любого масштаба в сообществе или в группе по месту жительства
 Механизм функционирования рынка труда
 Тест по обществознанию. Экономика
 Введение в курс предпринимательство
 Тренды цифровой экономики
 Факторы размещения производства
 Экономика фирмы. Фирма на рынке. Рыночные структуры
 Measuring a nation’s income. What is Gross Domestic Product (GDP)
 Ұлы дала еліндегі жаңа тарихи сананы және дүниетанымды қалыптастыру саясаты
 Международная трудовая миграция
 Обзор страхового рынка России за 2015 год
 Безработица. Занятие 10
 Формирование доходов. Причины неравенства в заработках
 Экономикалық талдау әдістері. Негізгі экономикалық көрсеткіштерді болжау әдістері