- Supply and demand. Factors of production

Содержание
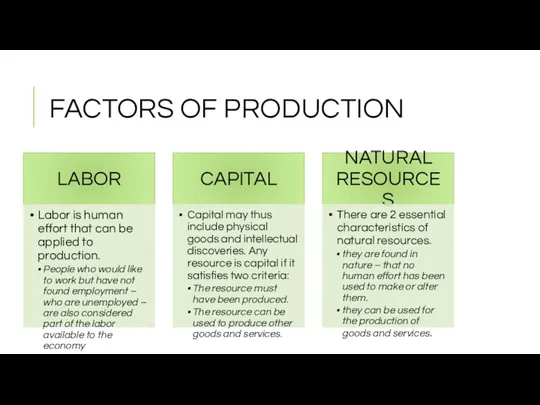
- 2. FACTORS OF PRODUCTION
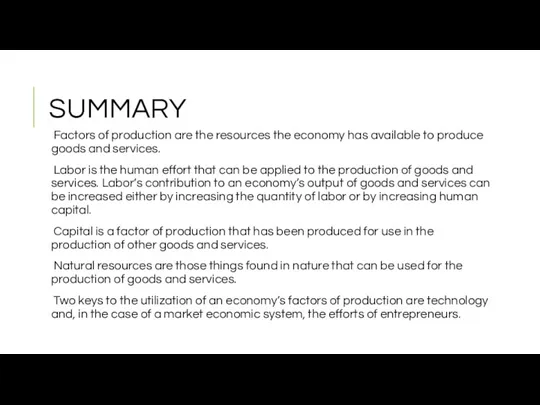
- 3. SUMMARY Factors of production are the resources the economy has available to produce goods and services.
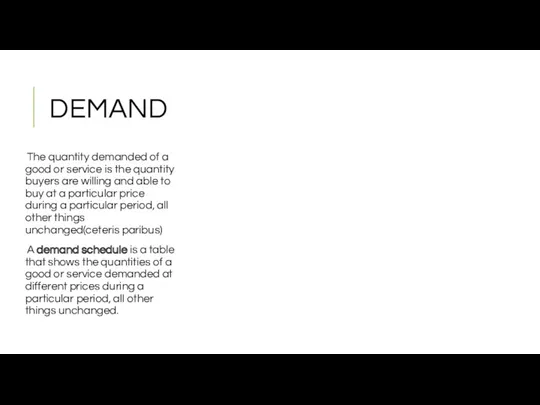
- 4. DEMAND The quantity demanded of a good or service is the quantity buyers are willing and
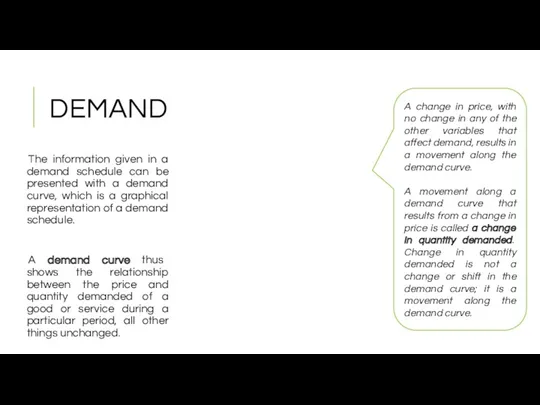
- 5. DEMAND The information given in a demand schedule can be presented with a demand curve, which
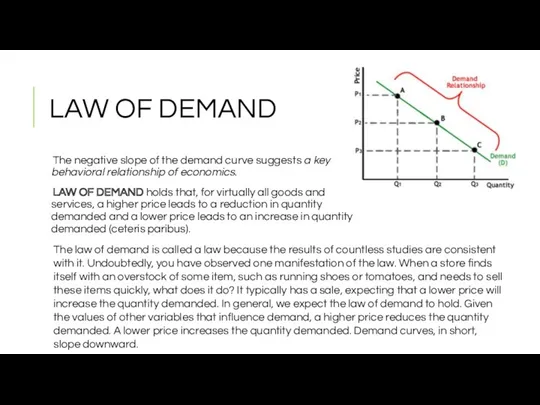
- 6. LAW OF DEMAND The negative slope of the demand curve suggests a key behavioral relationship of
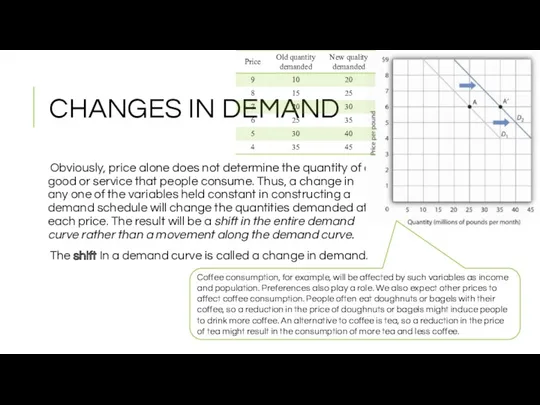
- 7. CHANGES IN DEMAND Obviously, price alone does not determine the quantity of a good or service
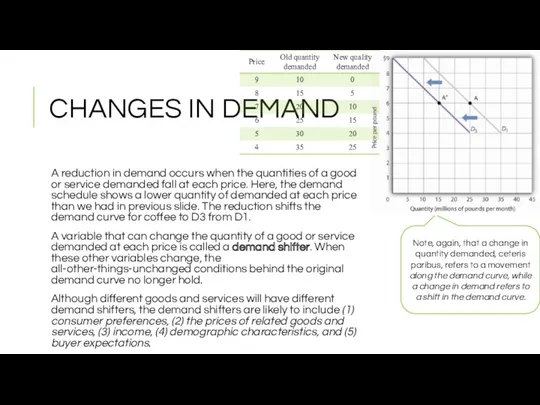
- 8. CHANGES IN DEMAND A reduction in demand occurs when the quantities of a good or service
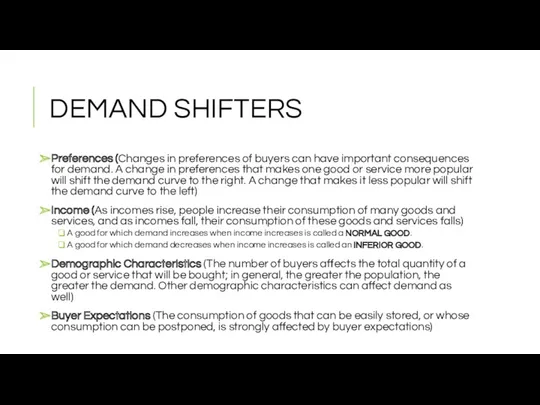
- 9. DEMAND SHIFTERS Preferences (Changes in preferences of buyers can have important consequences for demand. A change
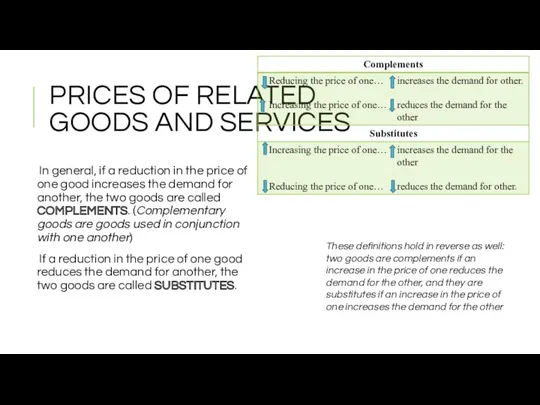
- 10. PRICES OF RELATED GOODS AND SERVICES In general, if a reduction in the price of one
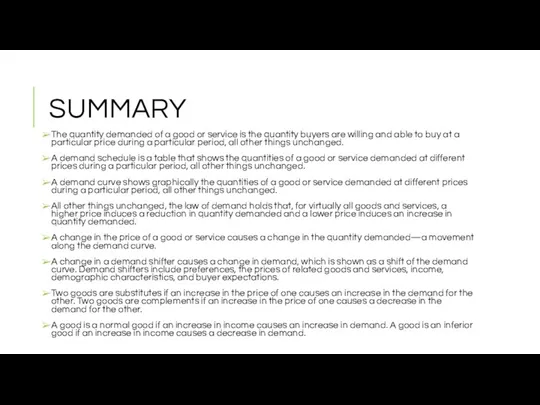
- 11. SUMMARY The quantity demanded of a good or service is the quantity buyers are willing and
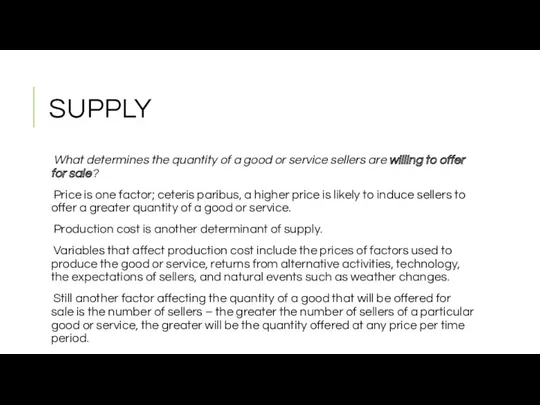
- 12. SUPPLY What determines the quantity of a good or service sellers are willing to offer for
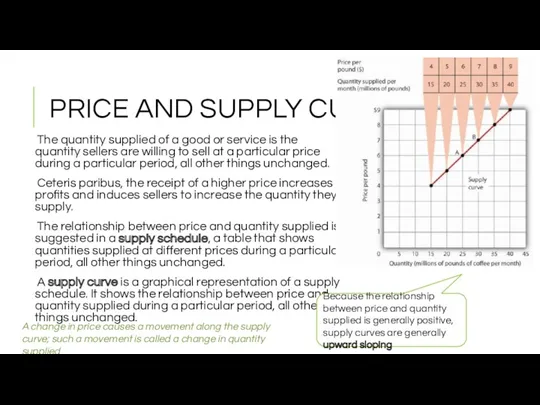
- 13. PRICE AND SUPPLY CURVE The quantity supplied of a good or service is the quantity sellers
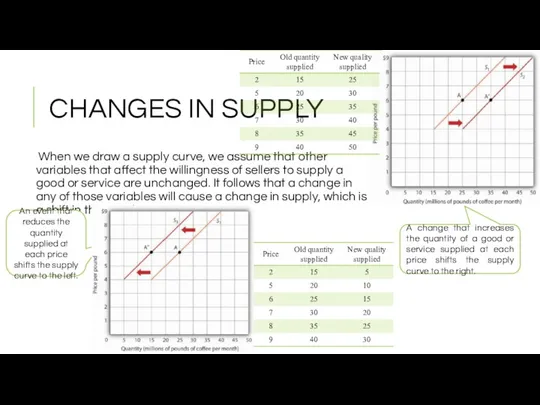
- 14. CHANGES IN SUPPLY When we draw a supply curve, we assume that other variables that affect
- 15. SHIFTS IN SUPPLY A variable that can change the quantity of a good or service supplied
- 16. SUMMARY The quantity supplied of a good or service is the quantity sellers are willing to
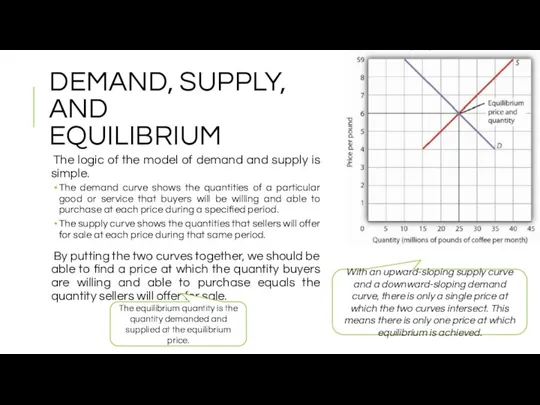
- 17. DEMAND, SUPPLY, AND EQUILIBRIUM The logic of the model of demand and supply is simple. The
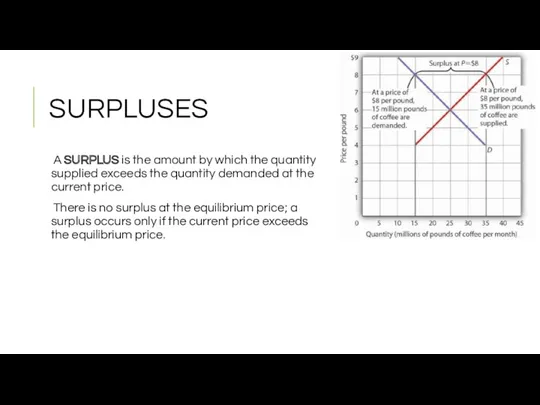
- 18. SURPLUSES A SURPLUS is the amount by which the quantity supplied exceeds the quantity demanded at
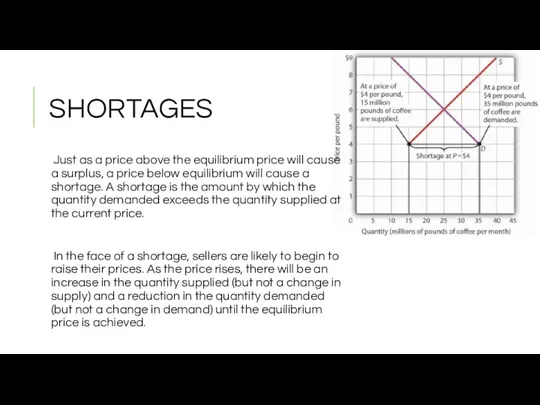
- 19. SHORTAGES Just as a price above the equilibrium price will cause a surplus, a price below
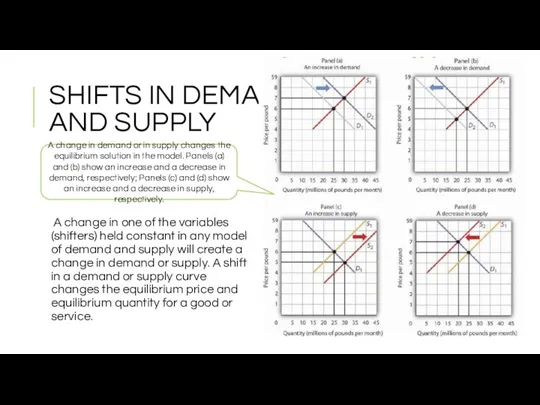
- 20. SHIFTS IN DEMAND AND SUPPLY A change in one of the variables (shifters) held constant in
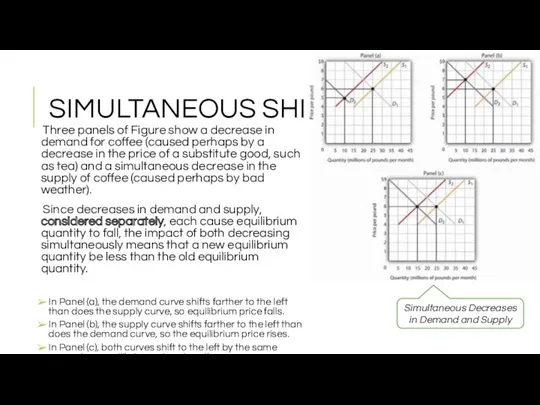
- 21. SIMULTANEOUS SHIFTS Three panels of Figure show a decrease in demand for coffee (caused perhaps by
- 23. Скачать презентацию
FACTORS OF PRODUCTION
FACTORS OF PRODUCTION
SUMMARY
Factors of production are the resources the economy has available to
SUMMARY
Factors of production are the resources the economy has available to
DEMAND
The quantity demanded of a good or service is the quantity
DEMAND
The quantity demanded of a good or service is the quantity
DEMAND
The information given in a demand schedule can be presented with
DEMAND
The information given in a demand schedule can be presented with
LAW OF DEMAND
The negative slope of the demand curve suggests a
LAW OF DEMAND
The negative slope of the demand curve suggests a
CHANGES IN DEMAND
Obviously, price alone does not determine the quantity
CHANGES IN DEMAND
Obviously, price alone does not determine the quantity
CHANGES IN DEMAND
A reduction in demand occurs when the quantities of
CHANGES IN DEMAND
A reduction in demand occurs when the quantities of
DEMAND SHIFTERS
Preferences (Changes in preferences of buyers can have important consequences
DEMAND SHIFTERS
Preferences (Changes in preferences of buyers can have important consequences
PRICES OF RELATED
GOODS AND SERVICES
In general, if a reduction in
PRICES OF RELATED
GOODS AND SERVICES
In general, if a reduction in
SUMMARY
The quantity demanded of a good or service is the quantity
SUMMARY
The quantity demanded of a good or service is the quantity
SUPPLY
What determines the quantity of a good or service sellers are
SUPPLY
What determines the quantity of a good or service sellers are
PRICE AND SUPPLY CURVE
The quantity supplied of a good or service
PRICE AND SUPPLY CURVE
The quantity supplied of a good or service
CHANGES IN SUPPLY
When we draw a supply curve, we assume that
CHANGES IN SUPPLY
When we draw a supply curve, we assume that
SHIFTS IN SUPPLY
A variable that can change the quantity of a
SHIFTS IN SUPPLY
A variable that can change the quantity of a
SUMMARY
The quantity supplied of a good or service is the quantity
SUMMARY
The quantity supplied of a good or service is the quantity
DEMAND, SUPPLY, AND
EQUILIBRIUM
The logic of the model of demand
DEMAND, SUPPLY, AND
EQUILIBRIUM
The logic of the model of demand
SURPLUSES
A SURPLUS is the amount by which the quantity supplied
SURPLUSES
A SURPLUS is the amount by which the quantity supplied
SHORTAGES
Just as a price above the equilibrium price will cause
SHORTAGES
Just as a price above the equilibrium price will cause
SHIFTS IN DEMAND AND SUPPLY
A change in one of the variables
SHIFTS IN DEMAND AND SUPPLY
A change in one of the variables
SIMULTANEOUS SHIFTS
Three panels of Figure show a decrease in demand
SIMULTANEOUS SHIFTS
Three panels of Figure show a decrease in demand
 Қазақстан-2030
 Особенности организации финансирования инновационной деятельности. (Тема 5)
 Функции, виды и методы государственного управления
 Содержание, предмет, принципы экономического анализа. Роль экономического анализа в условиях рыночной экономики
 Реформирование электроэнергетики России. Лекция 2
 История развития экономической мысли
 Семейное хозяйство (5 класс)
 Рыночная экономика. Обществознание. 8 класс
 Module structure
 Тьюринг машинасы және Пост машинасы
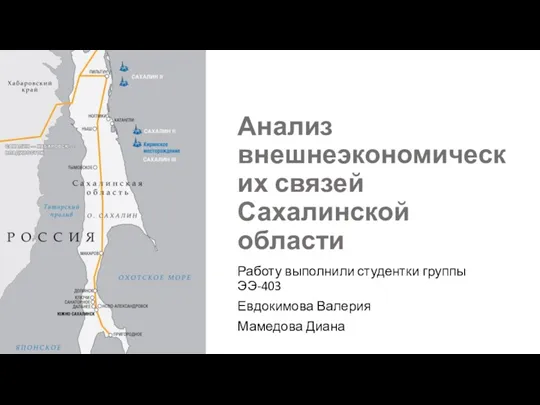 Анализ внешнеэкономических связей Сахалинской области
 Показатели эффективного использования основного капитала
 Сбалансированная система показателей
 Экономические агенты. Собственность и хозяйствование
 Проблема ограниченности экономических ресурсов и ее последствия
 Экономическая теория К. Маркса
 Главные вопросы экономики. (8 класс)
 Роль КНР в Юго-Восточной Азии
 Цивилизационный подход: понятия государство-нация и государство-цивилизация, взаимодействие цивилизаций. Лекция 2.1
 Введение в макроэкономический анализ
 Экономические циклы развития стран
 Издержки производства в краткосрочном и долгосрочном периодах. Тема 9
 Основні види безробіття та їх зміст
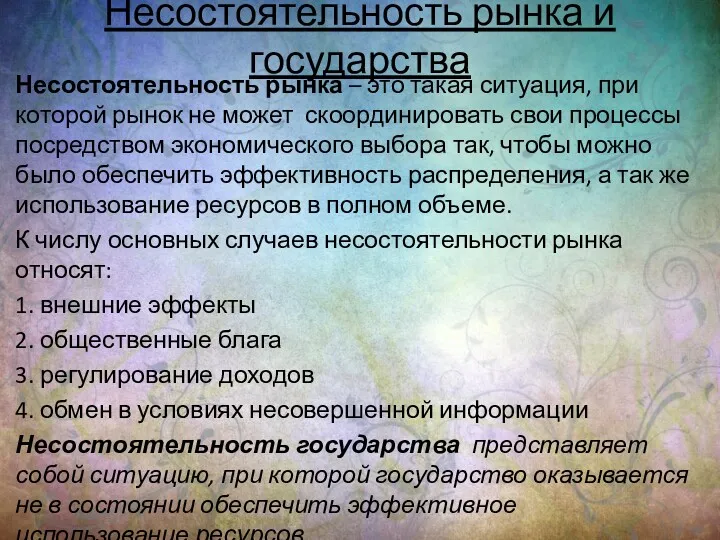 Несостоятельность рынка и государства
 Солнечные коллекторы
 Структура экономической системы Сингапура
 Основы общественного производства. Воспроизводство и его фазы
 Конкуренция и монополия