- Capital Budgeting and Estimating Cash Flows

Содержание
- 2. After studying Chapter 12, you should be able to: Define “capital budgeting” and identify the steps
- 3. Capital Budgeting and Estimating Cash Flows The Capital Budgeting Process Generating Investment Project Proposals Estimating Project
- 4. What is Capital Budgeting? The process of identifying, analyzing, and selecting investment projects whose returns (cash
- 5. The Capital Budgeting Process Generate investment proposals consistent with the firm’s strategic objectives. Estimate after-tax incremental
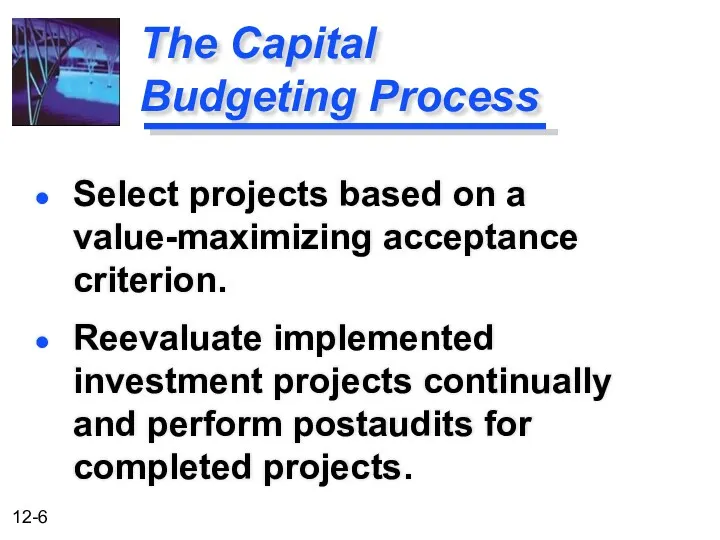
- 6. The Capital Budgeting Process Select projects based on a value-maximizing acceptance criterion. Reevaluate implemented investment projects
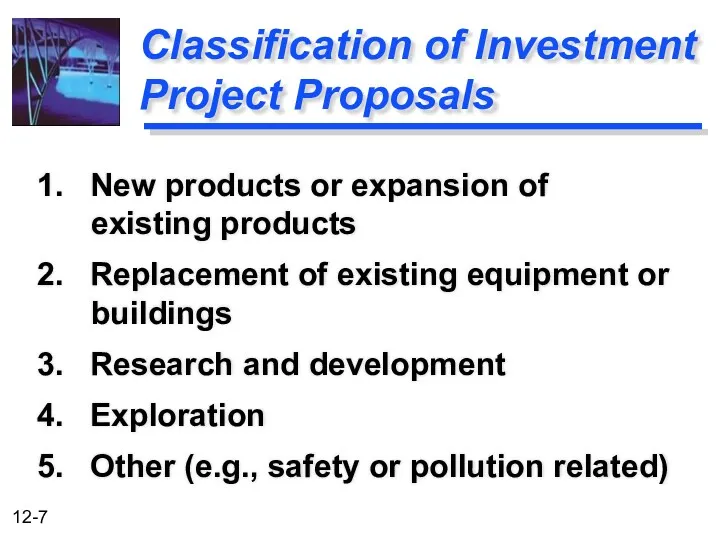
- 7. Classification of Investment Project Proposals 1. New products or expansion of existing products 2. Replacement of
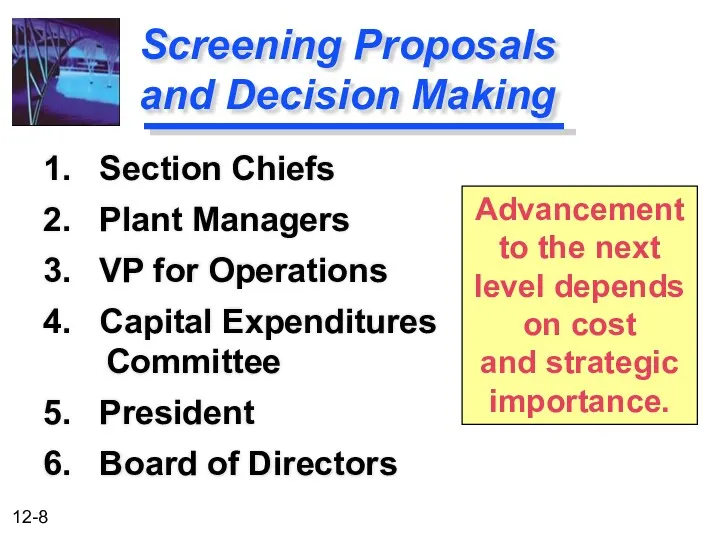
- 8. Screening Proposals and Decision Making 1. Section Chiefs 2. Plant Managers 3. VP for Operations 4.
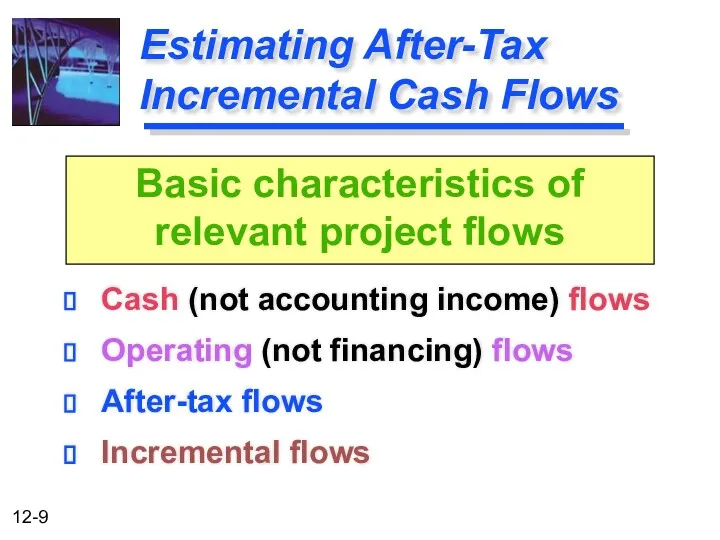
- 9. Estimating After-Tax Incremental Cash Flows Cash (not accounting income) flows Operating (not financing) flows After-tax flows
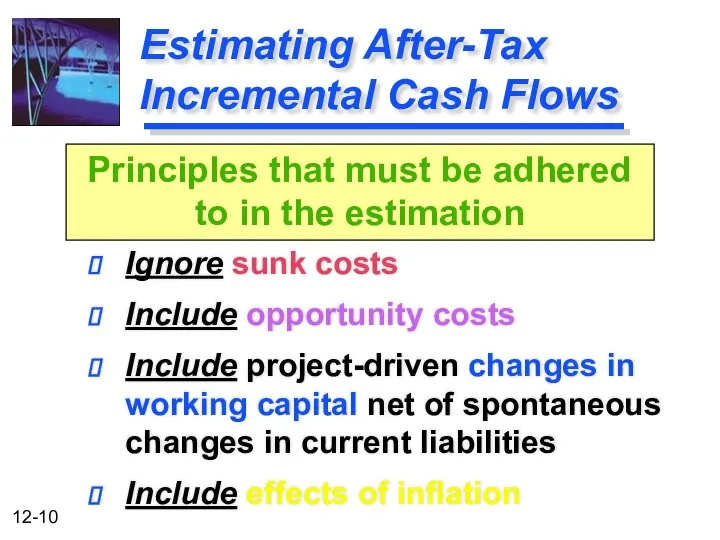
- 10. Estimating After-Tax Incremental Cash Flows Ignore sunk costs Include opportunity costs Include project-driven changes in working
- 11. Tax Considerations and Depreciation Generally, profitable firms prefer to use an accelerated method for tax reporting
- 12. Depreciation and the MACRS Method Everything else equal, the greater the depreciation charges, the lower the
- 13. MACRS Sample Schedule
- 14. Depreciable Basis In tax accounting, the fully installed cost of an asset. This is the amount
- 15. Capitalized Expenditures Capitalized Expenditures are expenditures that may provide benefits into the future and therefore are
- 16. Sale or Disposal of a Depreciable Asset Often historically, capital gains income has received more favorable
- 17. Corporate Capital Gains / Losses Capital losses are deductible only against capital gains. Currently, capital gains
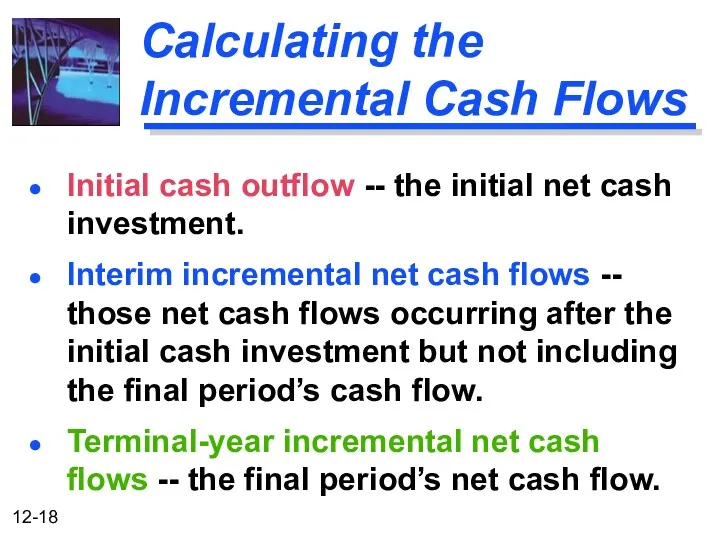
- 18. Calculating the Incremental Cash Flows Initial cash outflow -- the initial net cash investment. Interim incremental
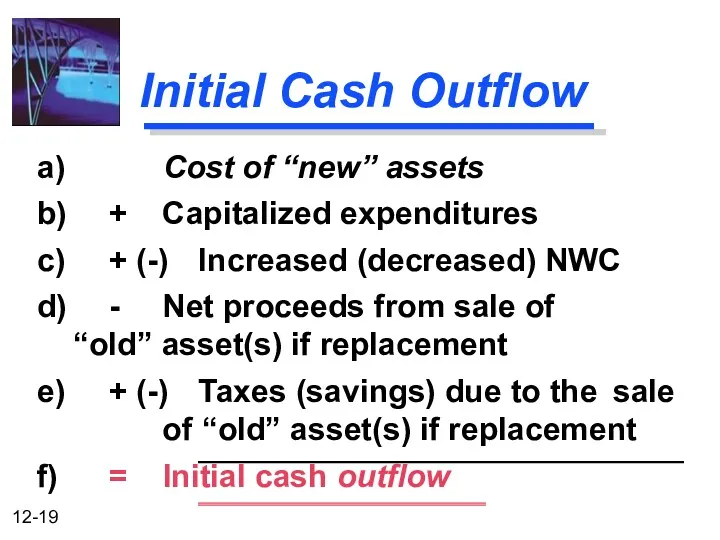
- 19. Initial Cash Outflow a) Cost of “new” assets b) + Capitalized expenditures c) + (-) Increased
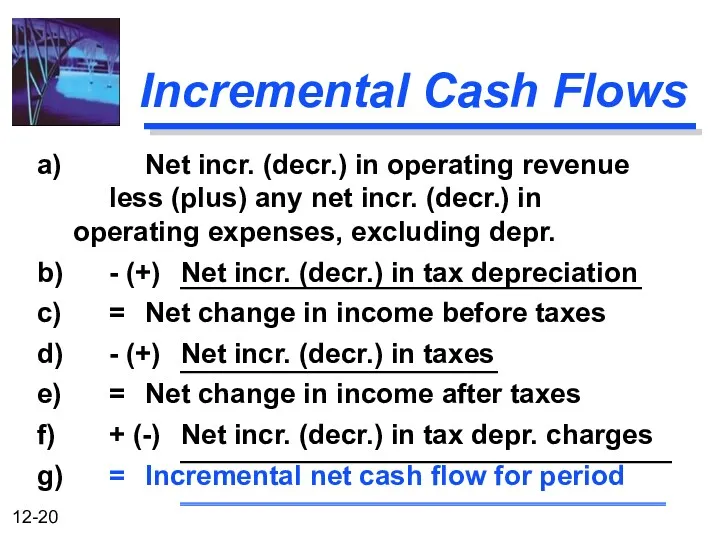
- 20. Incremental Cash Flows a) Net incr. (decr.) in operating revenue less (plus) any net incr. (decr.)
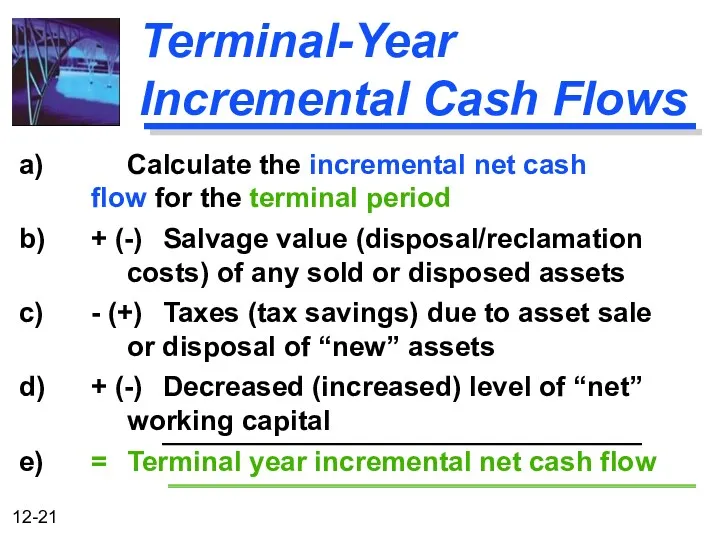
- 21. Terminal-Year Incremental Cash Flows a) Calculate the incremental net cash flow for the terminal period b)
- 22. Example of an Asset Expansion Project Basket Wonders (BW) is considering the purchase of a new
- 23. Initial Cash Outflow a) $50,000 b) + 20,000 c) + 5,000 d) - 0 (not a
- 24. Incremental Cash Flows Year 1 Year 2 Year 3 Year 4 a) $40,000 $40,000 $40,000 $40,000
- 25. Terminal-Year Incremental Cash Flows a) $26,075 The incremental cash flow from the previous slide in Year
- 26. Summary of Project Net Cash Flows Asset Expansion Year 0 Year 1 Year 2 Year 3
- 27. Example of an Asset Replacement Project Let us assume that previous asset expansion project is actually
- 28. Initial Cash Outflow a) $50,000 b) + 20,000 c) + 5,000 d) - 6,000 (sale of
- 29. Calculation of the Change in Depreciation Year 1 Year 2 Year 3 Year 4 a) $23,331
- 30. Incremental Cash Flows Year 1 Year 2 Year 3 Year 4 a) $10,000 $10,000 $10,000 $10,000
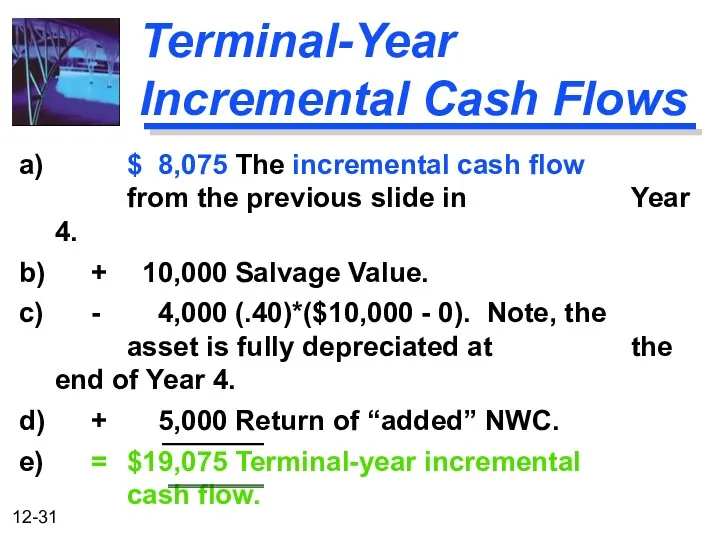
- 31. Terminal-Year Incremental Cash Flows a) $ 8,075 The incremental cash flow from the previous slide in
- 33. Скачать презентацию
After studying Chapter 12, you should be able to:
Define “capital budgeting”
After studying Chapter 12, you should be able to:
Define “capital budgeting”
Capital Budgeting and Estimating Cash Flows
The Capital Budgeting Process
Generating Investment Project
Capital Budgeting and Estimating Cash Flows
The Capital Budgeting Process
Generating Investment Project
What is
Capital Budgeting?
The process of identifying, analyzing, and selecting
What is
Capital Budgeting?
The process of identifying, analyzing, and selecting
The Capital Budgeting Process
Generate investment proposals consistent with the firm’s strategic
The Capital Budgeting Process
Generate investment proposals consistent with the firm’s strategic
The Capital Budgeting Process
Select projects based on a value-maximizing acceptance criterion.
Reevaluate
The Capital Budgeting Process
Select projects based on a value-maximizing acceptance criterion.
Reevaluate
Classification of Investment Project Proposals
1. New products or expansion of existing
Classification of Investment Project Proposals
1. New products or expansion of existing
Screening Proposals
and Decision Making
1. Section Chiefs
2. Plant Managers
3. VP for
Screening Proposals
and Decision Making
1. Section Chiefs
2. Plant Managers
3. VP for
Estimating After-Tax Incremental Cash Flows
Cash (not accounting income) flows
Operating (not financing)
Estimating After-Tax Incremental Cash Flows
Cash (not accounting income) flows
Operating (not financing)
Estimating After-Tax Incremental Cash Flows
Ignore sunk costs
Include opportunity costs
Include project-driven changes
Estimating After-Tax Incremental Cash Flows
Ignore sunk costs
Include opportunity costs
Include project-driven changes
Tax Considerations and Depreciation
Generally, profitable firms prefer to use an accelerated
Tax Considerations and Depreciation
Generally, profitable firms prefer to use an accelerated
Depreciation and the MACRS Method
Everything else equal, the greater the depreciation
Depreciation and the MACRS Method
Everything else equal, the greater the depreciation
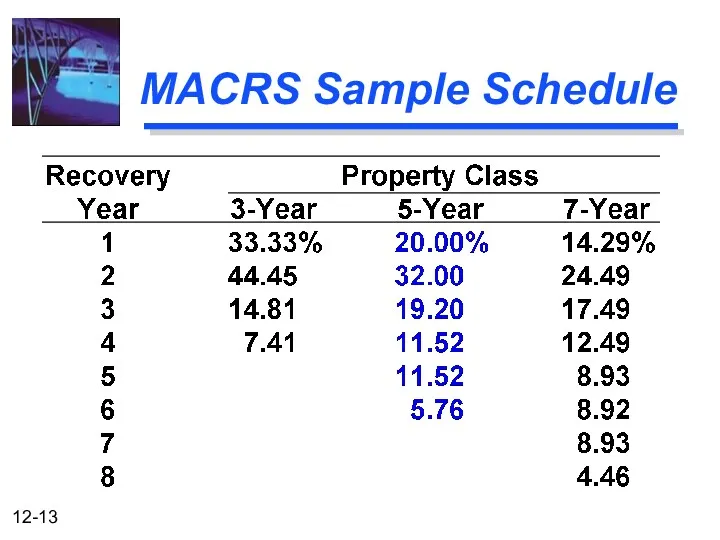
MACRS Sample Schedule
MACRS Sample Schedule
Depreciable Basis
In tax accounting, the fully installed cost of an asset.
Depreciable Basis
In tax accounting, the fully installed cost of an asset.
Capitalized Expenditures
Capitalized Expenditures are expenditures that may provide benefits into the
Capitalized Expenditures
Capitalized Expenditures are expenditures that may provide benefits into the
Sale or Disposal of a Depreciable Asset
Often historically, capital gains income
Sale or Disposal of a Depreciable Asset
Often historically, capital gains income
Corporate Capital Gains / Losses
Capital losses are deductible only against capital
Corporate Capital Gains / Losses
Capital losses are deductible only against capital
Calculating the Incremental Cash Flows
Initial cash outflow -- the initial net
Calculating the Incremental Cash Flows
Initial cash outflow -- the initial net
Initial Cash Outflow
a) Cost of “new” assets
b) + Capitalized expenditures
c) + (-) Increased
Initial Cash Outflow
a) Cost of “new” assets
b) + Capitalized expenditures
c) + (-) Increased
Incremental Cash Flows
a) Net incr. (decr.) in operating revenue less (plus) any
Incremental Cash Flows
a) Net incr. (decr.) in operating revenue less (plus) any
Terminal-Year Incremental Cash Flows
a) Calculate the incremental net cash flow for
Terminal-Year Incremental Cash Flows
a) Calculate the incremental net cash flow for
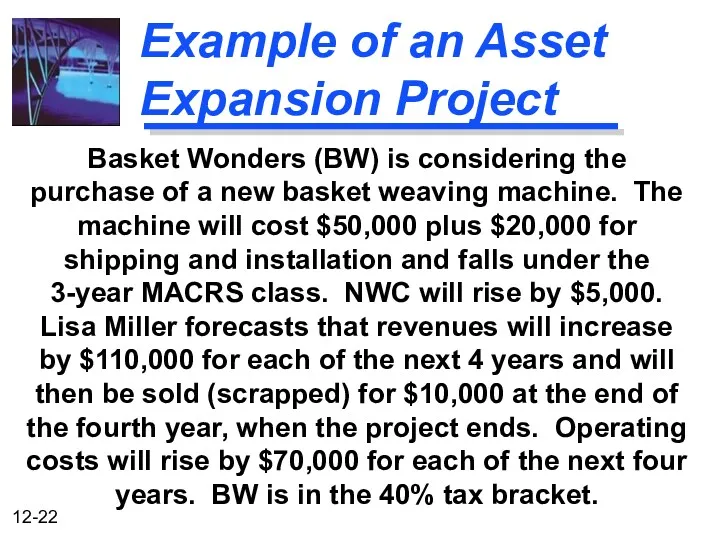
Example of an Asset Expansion Project
Basket Wonders (BW) is considering the
Example of an Asset Expansion Project
Basket Wonders (BW) is considering the
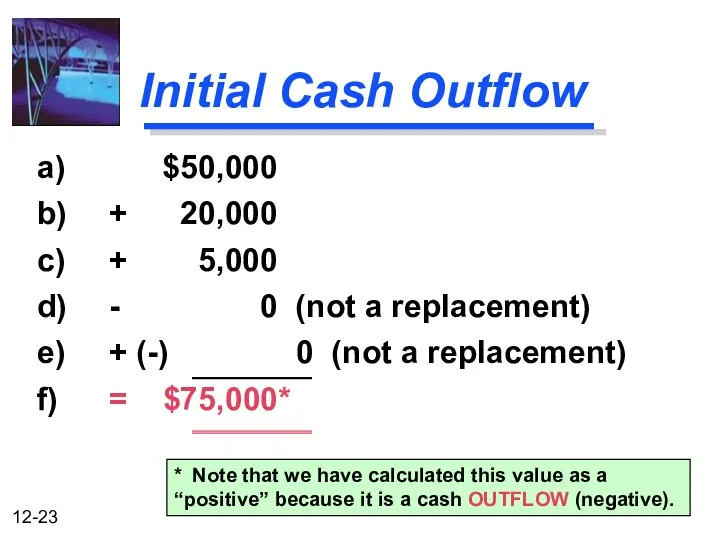
Initial Cash Outflow
a) $50,000
b) + 20,000
c) + 5,000
d) - 0 (not a replacement)
e) + (-)
Initial Cash Outflow
a) $50,000
b) + 20,000
c) + 5,000
d) - 0 (not a replacement)
e) + (-)
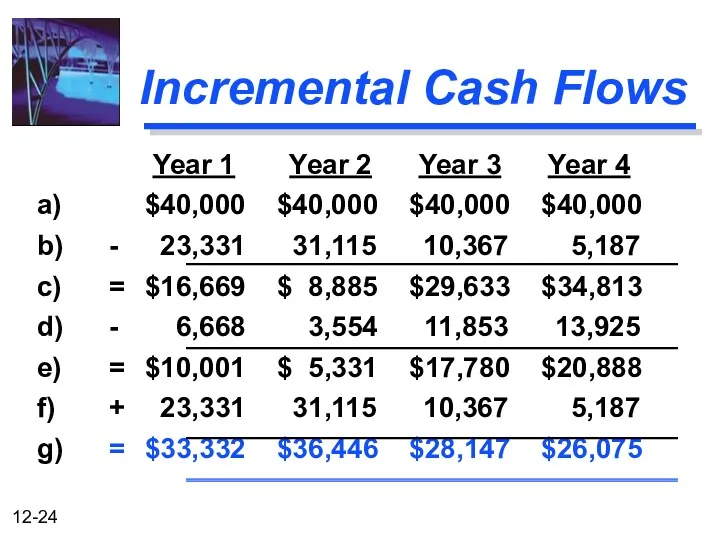
Incremental Cash Flows
Year 1 Year 2 Year 3 Year 4
a)
Incremental Cash Flows
Year 1 Year 2 Year 3 Year 4
a)
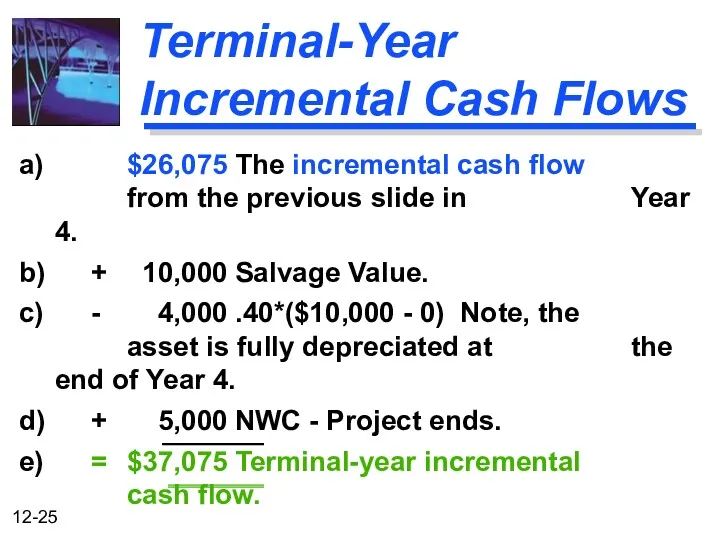
Terminal-Year Incremental Cash Flows
a) $26,075 The incremental cash flow from the previous
Terminal-Year Incremental Cash Flows
a) $26,075 The incremental cash flow from the previous
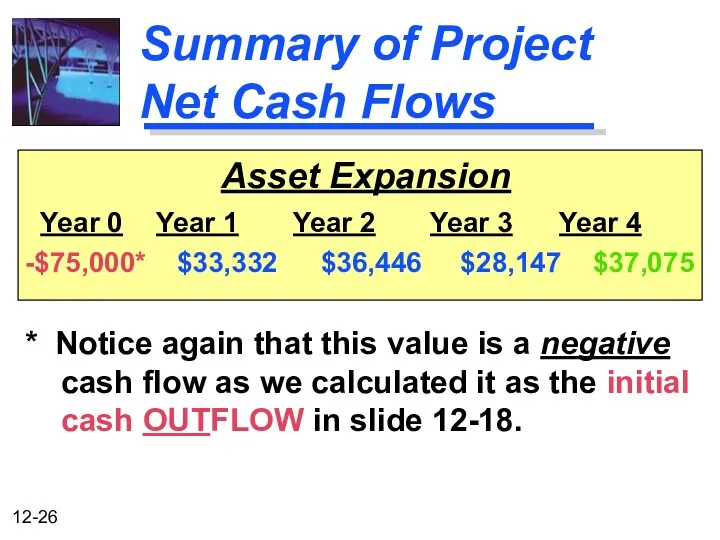
Summary of Project Net Cash Flows
Asset Expansion
Year 0 Year 1
Summary of Project Net Cash Flows
Asset Expansion
Year 0 Year 1
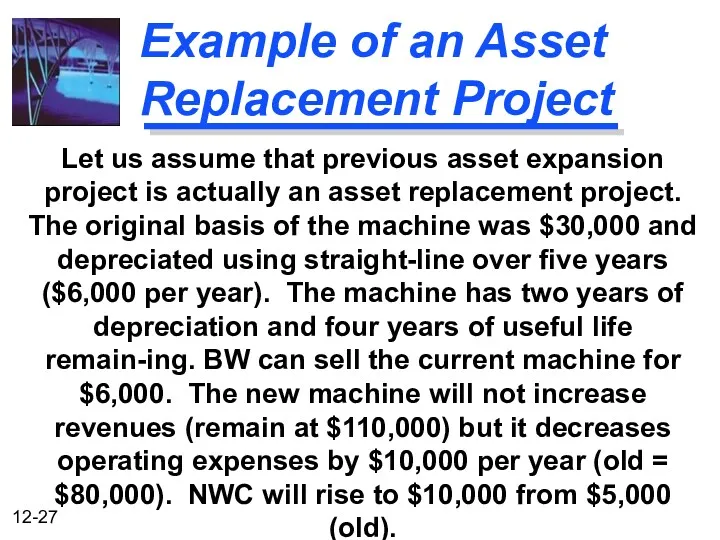
Example of an Asset Replacement Project
Let us assume that previous asset
Example of an Asset Replacement Project
Let us assume that previous asset
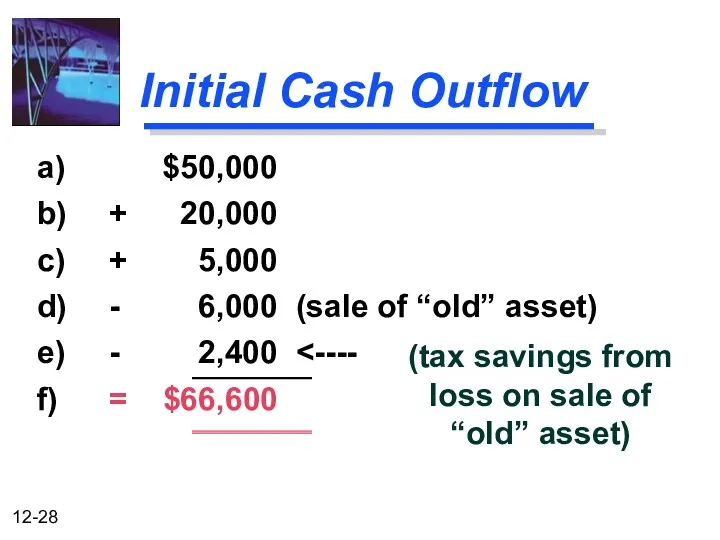
Initial Cash Outflow
a) $50,000
b) + 20,000
c) + 5,000
d) - 6,000 (sale of “old” asset)
e) -
Initial Cash Outflow
a) $50,000
b) + 20,000
c) + 5,000
d) - 6,000 (sale of “old” asset)
e) -
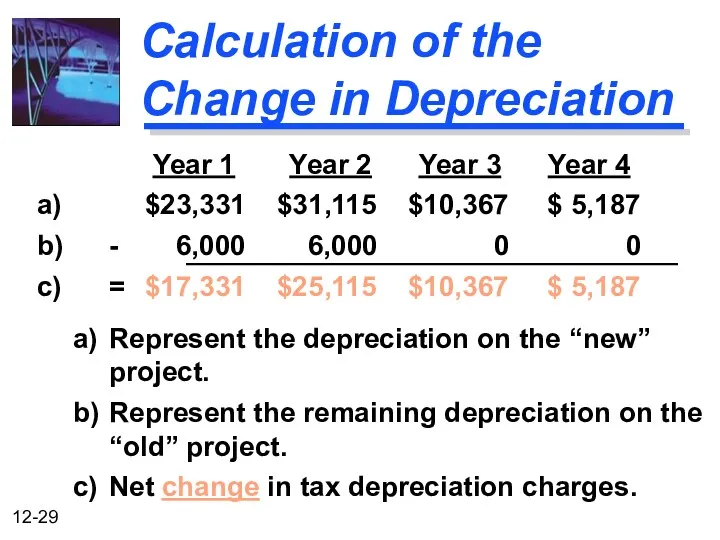
Calculation of the Change in Depreciation
Year 1 Year 2 Year
Calculation of the Change in Depreciation
Year 1 Year 2 Year
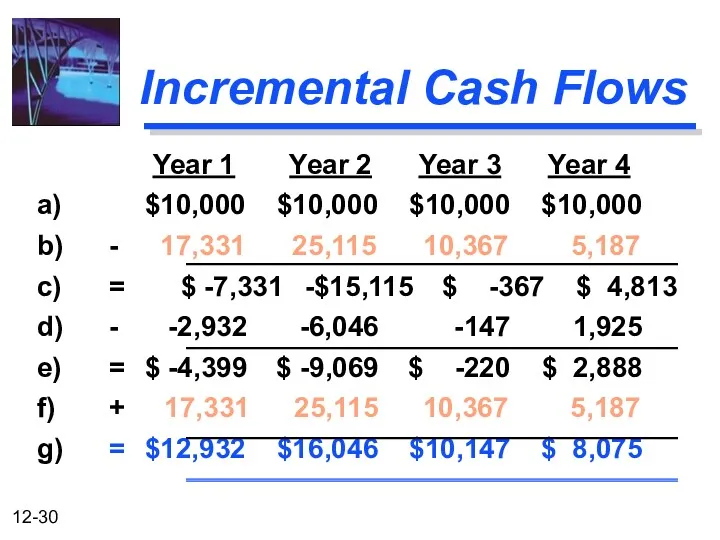
Incremental Cash Flows
Year 1 Year 2 Year 3 Year 4
a)
Incremental Cash Flows
Year 1 Year 2 Year 3 Year 4
a)
Terminal-Year Incremental Cash Flows
a) $ 8,075 The incremental cash flow from the
Terminal-Year Incremental Cash Flows
a) $ 8,075 The incremental cash flow from the
 Выгодные условия для сотрудников
 Напрями покращення фінансового стану підприємства (на прикладі Державного підприємства Іванківське лісове господарство)
 Государственное регулирование страховой деятельности
 Ұлттық экономикадағы қаржы және ақша несие жүйесі
 Представление сведений персонифицированного учета в Пенсионный фонд в 2018-2019 г.г
 Индивидуальный лицевой счет застрахованного лица
 Как заработать больше, а тратить меньше
 Онлайн-кассы. Новые требования
 Обеспечение доступности, бесперебойности и качества водоснабжения и водоотведения на территории Городского округа Подольск
 Международные организации и фонды
 Налог на доходы физических лиц (гл.23 НК РФ)
 Прохождение заявки от создания до принятия решения. Тинькофф
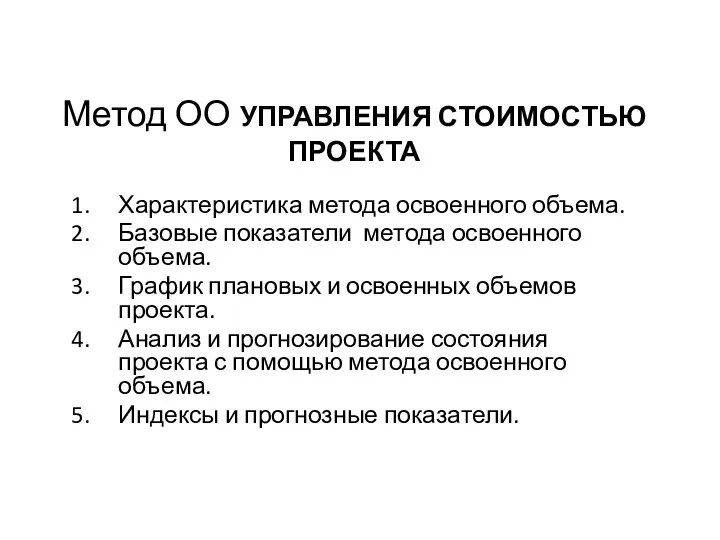 Метод освоенного объема управления стоимостью проекта
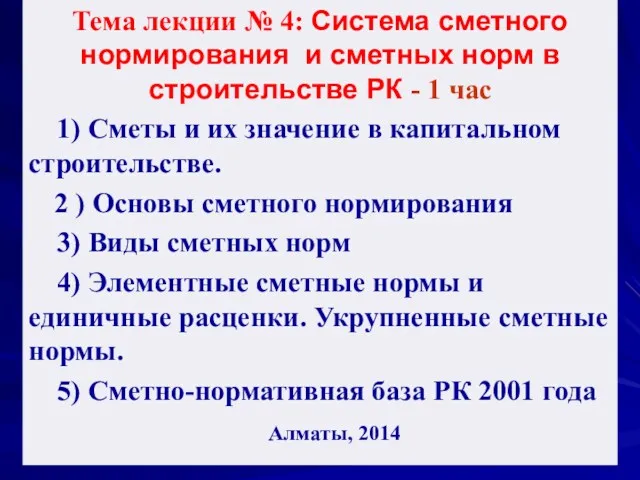 Система сметного нормирования и сметных норм в строительстве
 Структура задачи принятия решения: проблема и цели
 Понятие бюджетирования. Сущность и функции бюджетирования
 Форфейтинг. Сущность, особенности, организация
 Методы диагностики банкротства
 Банк ПСБ. Поддержка малого и среднего бизнеса в условиях турбулентности
 Рынок денег. Банковская система
 Экономическая эффективность использования оборотных средств ОАО Пермский завод Машиностроитель
 Бухгалтерский учет движения денежных средств и анализ денежных потоков на примере АО РТК
 Персонифицированное финансирование дополнительного образования. Московская область
 Строительство универсальной спортивной площадки. Общественный проект Твори Добро
 Money matters
 Издержки предприятия. Себестоимость продукции
 Денежные выплаты в помощь гражданам по оплате жилого помещения и коммунальных услуг, детского садика, проезда школьника
 Основные направления регулирования кредитных организаций на этапе их создания