- Anomaly detection

Содержание
- 2. Outline Introduction Aspects of Anomaly Detection Problem Applications Different Types of Anomaly Detection Case Studies Discussion
- 3. Introduction We are drowning in the deluge of data that are being collected world-wide, while starving
- 4. What are Anomalies? Anomaly is a pattern in the data that does not conform to the
- 5. Real World Anomalies Credit Card Fraud An abnormally high purchase made on a credit card Cyber
- 6. Simple Example N1 and N2 are regions of normal behavior Points o1 and o2 are anomalies
- 7. Related problems Rare Class Mining Chance discovery Novelty Detection Exception Mining Noise Removal Black Swan* *
- 8. Key Challenges Defining a representative normal region is challenging The boundary between normal and outlying behavior
- 9. Aspects of Anomaly Detection Problem Nature of input data Availability of supervision Type of anomaly: point,
- 10. Input Data Most common form of data handled by anomaly detection techniques is Record Data Univariate
- 11. Input Data – Nature of Attributes Nature of attributes Binary Categorical Continuous Hybrid categorical continuous continuous
- 12. Input Data – Complex Data Types Relationship among data instances Sequential Temporal Spatial Spatio-temporal Graph
- 13. Data Labels Supervised Anomaly Detection Labels available for both normal data and anomalies Similar to rare
- 14. Type of Anomaly Point Anomalies Contextual Anomalies Collective Anomalies
- 15. Point Anomalies An individual data instance is anomalous w.r.t. the data
- 16. Contextual Anomalies An individual data instance is anomalous within a context Requires a notion of context
- 17. Collective Anomalies A collection of related data instances is anomalous Requires a relationship among data instances
- 18. Output of Anomaly Detection Label Each test instance is given a normal or anomaly label This
- 19. Evaluation of Anomaly Detection – F-value Accuracy is not sufficient metric for evaluation Example: network traffic
- 20. Evaluation of Outlier Detection – ROC & AUC Standard measures for evaluating anomaly detection problems: Recall
- 21. Applications of Anomaly Detection Network intrusion detection Insurance / Credit card fraud detection Healthcare Informatics /
- 22. Intrusion Detection Intrusion Detection: Process of monitoring the events occurring in a computer system or network
- 23. Fraud Detection Fraud detection refers to detection of criminal activities occurring in commercial organizations Malicious users
- 24. Healthcare Informatics Detect anomalous patient records Indicate disease outbreaks, instrumentation errors, etc. Key Challenges Only normal
- 25. Industrial Damage Detection Industrial damage detection refers to detection of different faults and failures in complex
- 26. Image Processing Detecting outliers in a image monitored over time Detecting anomalous regions within an image
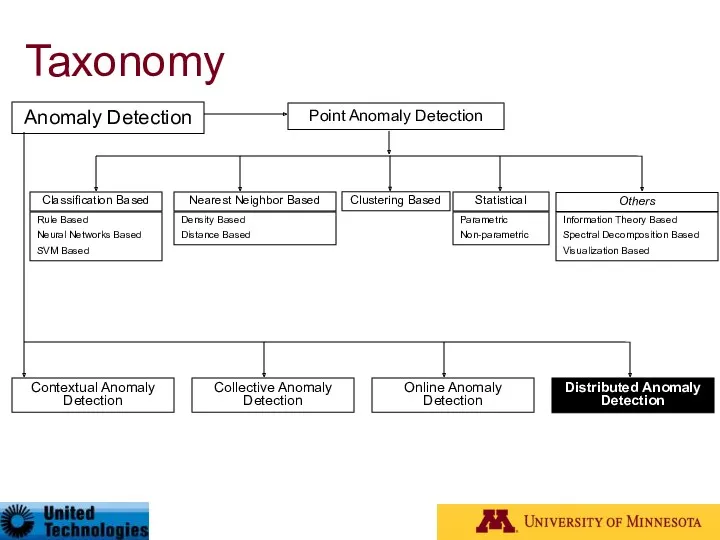
- 27. Taxonomy* Anomaly Detection Contextual Anomaly Detection Collective Anomaly Detection Online Anomaly Detection Distributed Anomaly Detection Point
- 28. Classification Based Techniques Main idea: build a classification model for normal (and anomalous (rare)) events based
- 29. Classification Based Techniques Advantages: Supervised classification techniques Models that can be easily understood High accuracy in
- 30. Supervised Classification Techniques Manipulating data records (oversampling / undersampling / generating artificial examples) Rule based techniques
- 31. Manipulating Data Records Over-sampling the rare class [Ling98] Make the duplicates of the rare events until
- 32. Rule Based Techniques Creating new rule based algorithms (PN-rule, CREDOS) Adapting existing rule based techniques Robust
- 33. New Rule-based Algorithms: PN-rule Learning* P-phase: cover most of the positive examples with high support seek
- 34. New Rule-based Algorithms: CREDOS* Ripple Down Rules (RDRs) offer a unique tree based representation that generalizes
- 35. Using Neural Networks Multi-layer Perceptrons Measuring the activation of output nodes [Augusteijn02] Extending the learning beyond
- 36. Using Support Vector Machines SVM Classifiers [Steinwart05,Mukkamala02] Main idea [Steinwart05] : Normal data records belong to
- 37. Using Bayesian Networks Typical Bayesian networks Aggregates information from different variables and provide an estimate of
- 38. Semi-supervised Classification Techniques Use modified classification model to learn the normal behavior and then detect any
- 39. Using Replicator Neural Networks* Use a replicator 4-layer feed-forward neural network (RNN) with the same number
- 40. Using Support Vector Machines Converting into one class classification problem Separate the entire set of training
- 41. Taxonomy Anomaly Detection Contextual Anomaly Detection Collective Anomaly Detection Online Anomaly Detection Distributed Anomaly Detection Point
- 42. Nearest Neighbor Based Techniques Key assumption: normal points have close neighbors while anomalies are located far
- 43. Nearest Neighbor Based Techniques Advantage Can be used in unsupervised or semi-supervised setting (do not make
- 44. Nearest Neighbor Based Techniques Distance based approaches A point O in a dataset is an DB(p,
- 45. Distance based Outlier Detection Nearest Neighbor (NN) approach*,** For each data point d compute the distance
- 46. Local Outlier Factor (LOF)* For each data point q compute the distance to the k-th nearest
- 47. Advantages of Density based Techniques Local Outlier Factor (LOF) approach Example: p2 × p1 × In
- 48. Connectivity Outlier Factor (COF)* Outliers are points p where average chaining distance ac-distkNN(p)(p) is larger than
- 49. Multi-Granularity Deviation Factor - LOCI* LOCI computes the neighborhood size (the number of neighbors) for each
- 50. Taxonomy Anomaly Detection Contextual Anomaly Detection Collective Anomaly Detection Online Anomaly Detection Distributed Anomaly Detection Point
- 51. Clustering Based Techniques Key assumption: normal data records belong to large and dense clusters, while anomalies
- 52. Clustering Based Techniques Advantages: No need to be supervised Easily adaptable to on-line / incremental mode
- 53. Simple Application of Clustering Radius ω of proximity is specified Two points x1 and x2 are
- 54. FindOut algorithm* by-product of WaveCluster Main idea: Remove the clusters from original data and then identify
- 55. Cluster based Local Outlier Factor (CBLOF) Use squeezer clustering algorithm to perform clustering Determine CBLOF for
- 56. Taxonomy Anomaly Detection Contextual Anomaly Detection Collective Anomaly Detection Online Anomaly Detection Distributed Anomaly Detection Point
- 57. Statistics Based Techniques Data points are modeled using stochastic distribution ⇒ points are determined to be
- 58. Types of Statistical Techniques Parametric Techniques Assume that the normal (and possibly anomalous) data is generated
- 59. SmartSifter (SS)* Uses Finite Mixtures SS uses a probabilistic model as a representation of underlying mechanism
- 60. Using Probability Distributions* Basic Assumption: # of normal elements in the data is significantly larger then
- 61. Taxonomy Anomaly Detection Contextual Anomaly Detection Collective Anomaly Detection Online Anomaly Detection Distributed Anomaly Detection Point
- 62. Information Theory Based Techniques Compute information content in data using information theoretic measures, e.g., entropy, relative
- 63. Using a variety of information theoretic measures [Lee01] Kolmogorov complexity based approaches [Arning96] Detect smallest data
- 64. Using Information Theoretic Measures* Entropy measures the uncertainty (impurity) of data items The entropy is smaller
- 65. Spectral Techniques Analysis based on eigen decomposition of data Key Idea Find combination of attributes that
- 66. Using Robust PCA* Variability analysis based on robust PCA Compute the principal components of the dataset
- 67. Temporal analysis of dynamic graphs Based on principal component analysis [Ide04] Applied to network traffic data
- 68. Visualization Based Techniques Use visualization tools to observe the data Provide alternate views of data for
- 69. Application of Dynamic Graphics* Apply dynamic graphics to the exploratory analysis of spatial data. Visualization tools
- 70. Visual Data Mining* Detecting Tele-communication fraud Display telephone call patterns as a graph Use colors to
- 71. Taxonomy Anomaly Detection Contextual Anomaly Detection Collective Anomaly Detection Online Anomaly Detection Distributed Anomaly Detection Point
- 72. Contextual Anomaly Detection Detect context anomalies General Approach Identify a context around a data instance (using
- 73. Contextual Anomaly Detection Advantages Detect anomalies that are hard to detect when analyzed in the global
- 74. Contextual Attributes Contextual attributes define a neighborhood (context) for each instance For example: Spatial Context Latitude,
- 75. Contextual Anomaly Detection Techniques Techniques Reduction to point outlier detection Segment data using contextual attributes Apply
- 76. Conditional Anomaly Detection* Each data point is represented as [x,y], where x denotes the environmental (contextual)
- 77. Taxonomy Anomaly Detection Contextual Anomaly Detection Collective Anomaly Detection Online Anomaly Detection Distributed Anomaly Detection Point
- 78. Collective Anomaly Detection Detect collective anomalies Exploit the relationship among data instances Sequential anomaly detection Detect
- 79. Sequential Anomaly Detection Detect anomalous sequences in a database of sequences, or Detect anomalous subsequence within
- 80. Sequence Time Delay Embedding (STIDE)* Assumes a training data containing normal sequences Training Extracts fixed length
- 81. Taxonomy Anomaly Detection Contextual Anomaly Detection Collective Anomaly Detection Online Anomaly Detection Distributed Anomaly Detection Point
- 82. Motivation for On-line Anomaly Detection Data in many rare events applications arrives continuously at an enormous
- 83. On-line Anomaly Detection – Simple Idea The normal behavior is changing through time Need to update
- 84. Drawbacks of simple on-line anomaly detection algorithm If arriving data points start to create a new
- 85. Incremental LOF algorithm Incremental LOF algorithm computes LOF value for each inserted data record and instantly
- 86. Taxonomy Anomaly Detection Contextual Anomaly Detection Collective Anomaly Detection Online Anomaly Detection Distributed Anomaly Detection Point
- 87. Need for Distributed Anomaly Detection Data in many anomaly detection applications may come from many different
- 88. Distributed Anomaly Detection Techniques Simple data exchange approaches Merging data at a single location Exchanging data
- 89. Case Study: Data Mining in Intrusion Detection Due to the proliferation of Internet, more and more
- 90. What are Intrusions? Intrusions are actions that attempt to bypass security mechanisms of computer systems. They
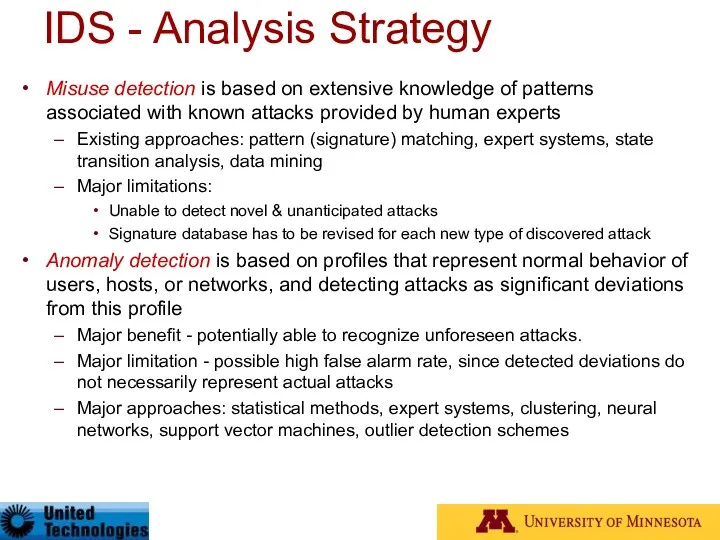
- 91. IDS - Analysis Strategy Misuse detection is based on extensive knowledge of patterns associated with known
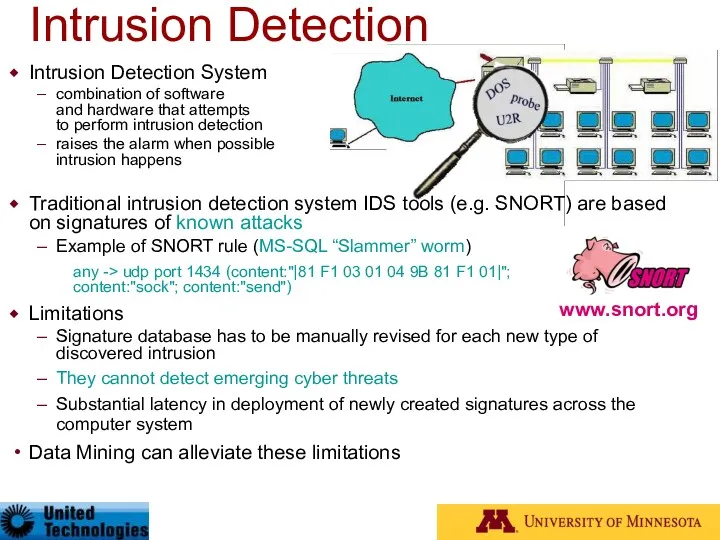
- 92. Intrusion Detection www.snort.org Intrusion Detection System combination of software and hardware that attempts to perform intrusion
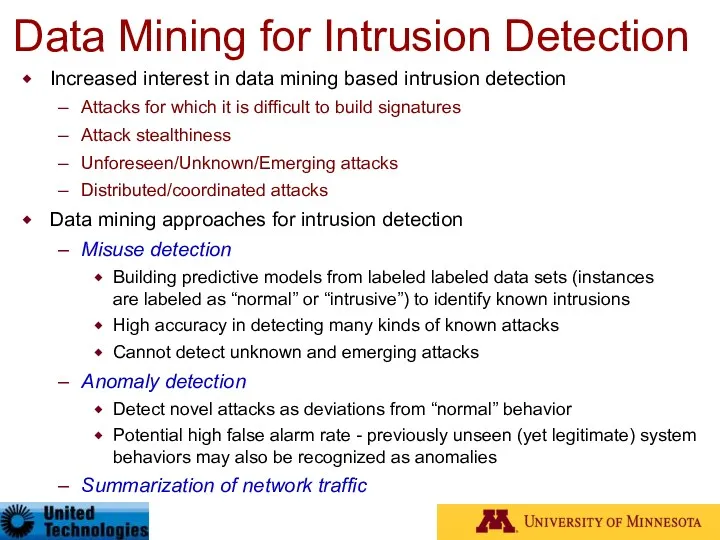
- 93. Data Mining for Intrusion Detection Increased interest in data mining based intrusion detection Attacks for which
- 94. Data Mining for Intrusion Detection Misuse Detection – Building Predictive Models categorical temporal continuous class Training
- 95. Anomaly Detection on Real Network Data Anomaly detection was used at U of Minnesota and Army
- 96. Three groups of features Basic features of individual TCP connections source & destination IP Features 1
- 97. Typical Anomaly Detection Output 48 hours after the “slammer” worm Anomalous connections that correspond to the
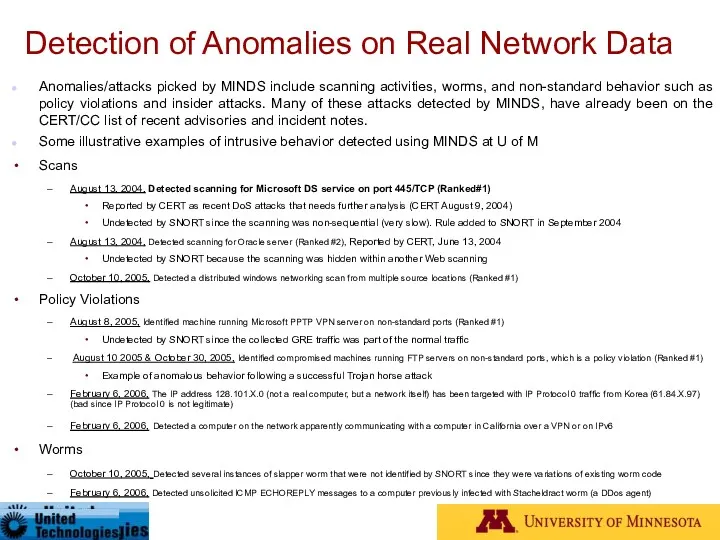
- 98. Detection of Anomalies on Real Network Data Anomalies/attacks picked by MINDS include scanning activities, worms, and
- 99. Conclusions Anomaly detection can detect critical information in data Highly applicable in various application domains Nature
- 100. References Ling, C., Li, C. Data mining for direct marketing: Problems and solutions, KDD, 1998. Kubat
- 101. References Lee, W. and Xiang, D. Information-theoretic measures for anomaly detection. In Proceedings of the IEEE
- 102. References S. Hawkins, et al. Outlier detection using Replicator neural networks, DaWaK02 2002. Jagota, A. Novelty
- 104. Скачать презентацию
Outline
Introduction
Aspects of Anomaly Detection Problem
Applications
Different Types of Anomaly Detection
Case Studies
Discussion and
Outline
Introduction
Aspects of Anomaly Detection Problem
Applications
Different Types of Anomaly Detection
Case Studies
Discussion and

Introduction
We are drowning in the deluge of data that are being
Introduction
We are drowning in the deluge of data that are being
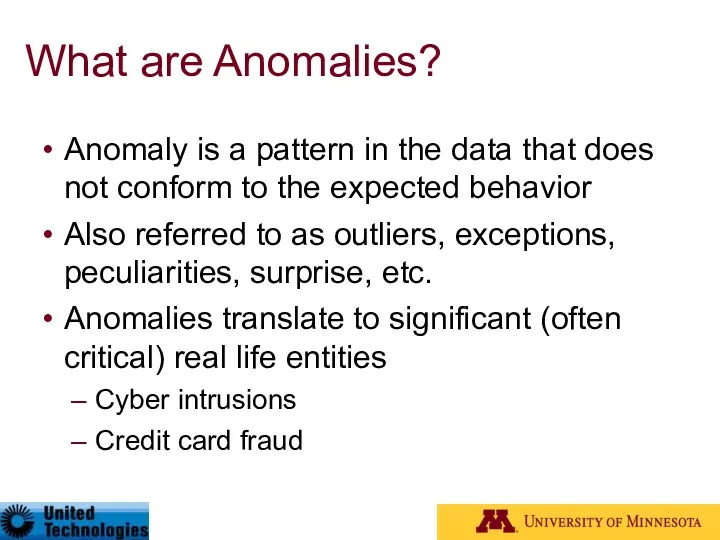
What are Anomalies?
Anomaly is a pattern in the data that does
What are Anomalies?
Anomaly is a pattern in the data that does

Real World Anomalies
Credit Card Fraud
An abnormally high purchase made on a
Real World Anomalies
Credit Card Fraud
An abnormally high purchase made on a
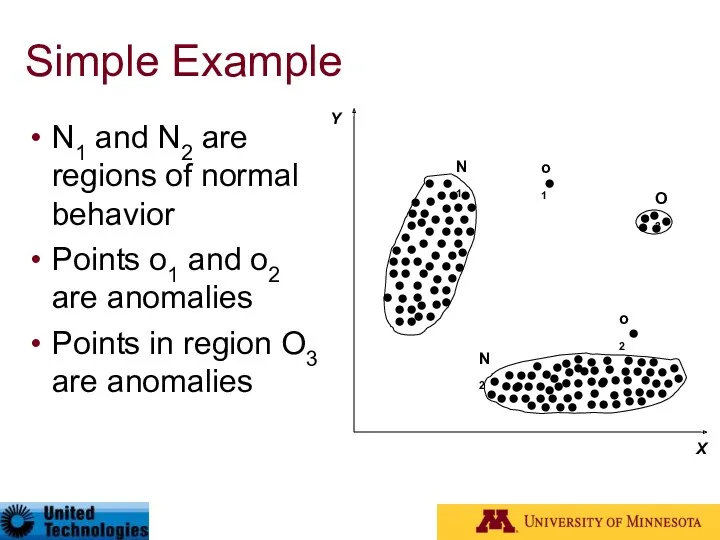
Simple Example
N1 and N2 are regions of normal behavior
Points o1 and
Simple Example
N1 and N2 are regions of normal behavior
Points o1 and
Related problems
Rare Class Mining
Chance discovery
Novelty Detection
Exception Mining
Noise Removal
Black Swan*
* N. Talleb,
Related problems
Rare Class Mining
Chance discovery
Novelty Detection
Exception Mining
Noise Removal
Black Swan*
* N. Talleb,
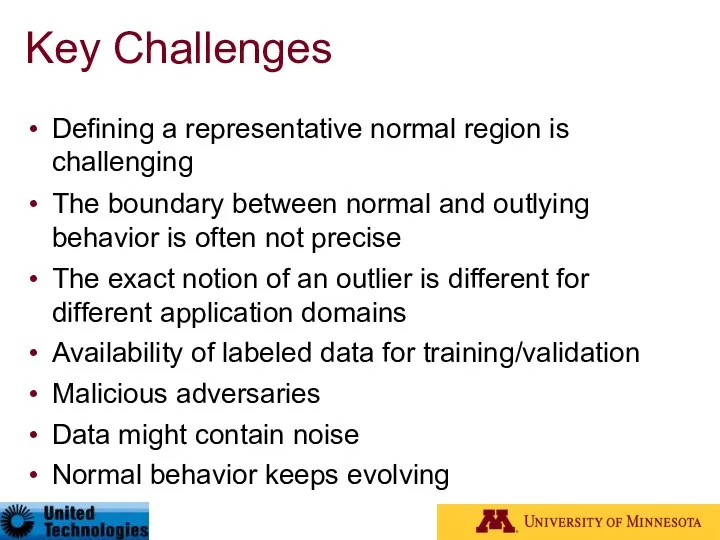
Key Challenges
Defining a representative normal region is challenging
The boundary between normal
Key Challenges
Defining a representative normal region is challenging
The boundary between normal
Aspects of Anomaly Detection Problem
Nature of input data
Availability of supervision
Aspects of Anomaly Detection Problem
Nature of input data
Availability of supervision
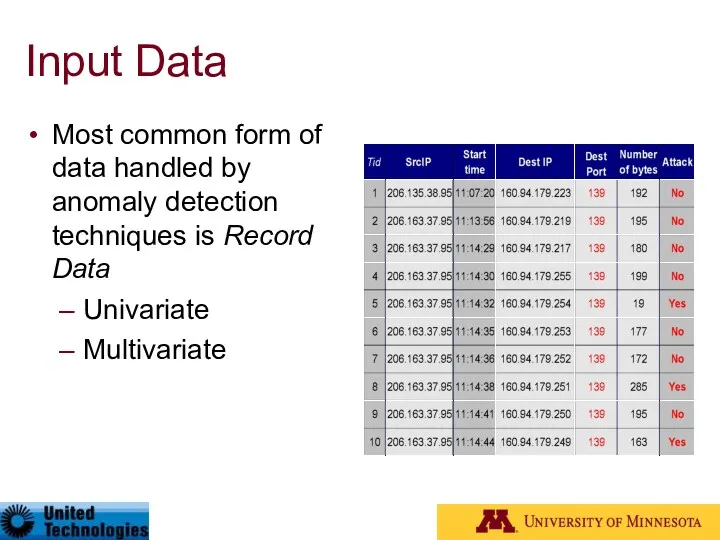
Input Data
Most common form of data handled by anomaly detection techniques
Input Data
Most common form of data handled by anomaly detection techniques
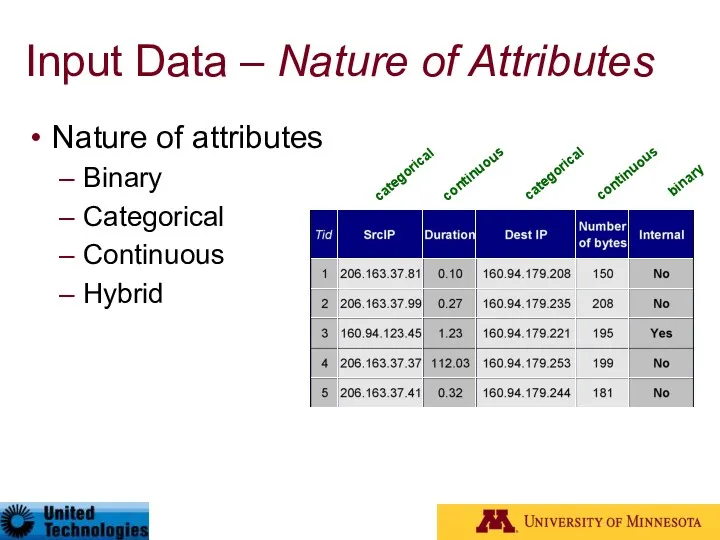
Input Data – Nature of Attributes
Nature of attributes
Binary
Categorical
Continuous
Hybrid
categorical
continuous
continuous
categorical
binary
Input Data – Nature of Attributes
Nature of attributes
Binary
Categorical
Continuous
Hybrid
categorical
continuous
continuous
categorical
binary
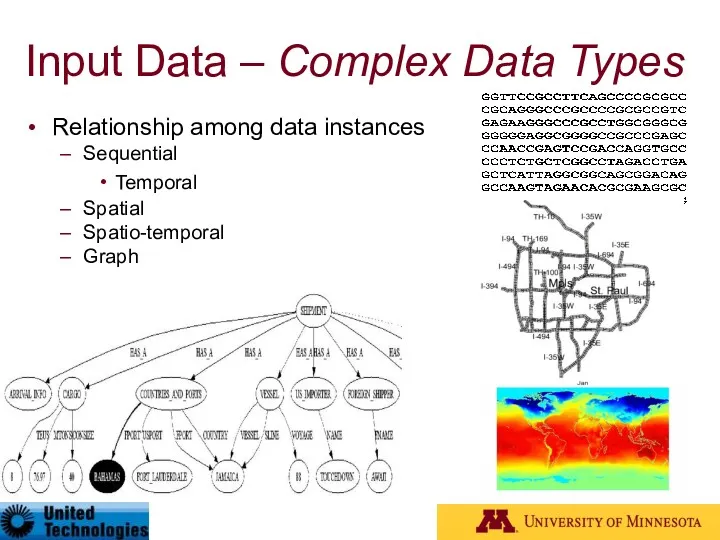
Input Data – Complex Data Types
Relationship among data instances
Sequential
Temporal
Spatial
Spatio-temporal
Graph
Input Data – Complex Data Types
Relationship among data instances
Sequential
Temporal
Spatial
Spatio-temporal
Graph
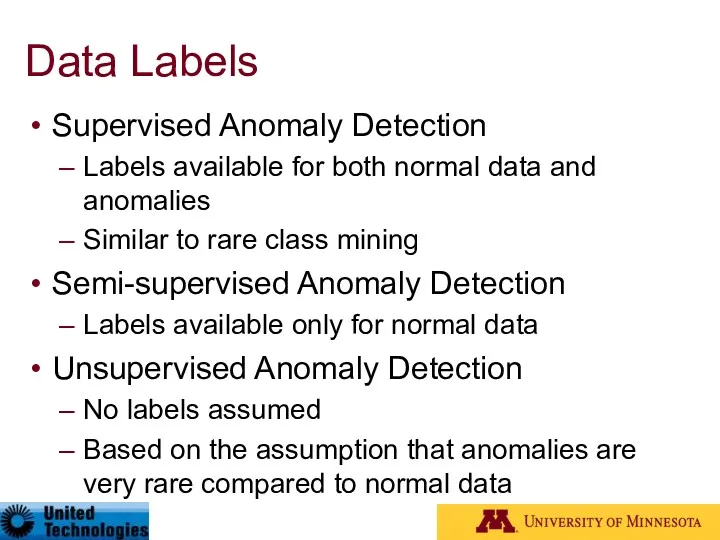
Data Labels
Supervised Anomaly Detection
Labels available for both normal data and anomalies
Similar
Data Labels
Supervised Anomaly Detection
Labels available for both normal data and anomalies
Similar
Type of Anomaly
Point Anomalies
Contextual Anomalies
Collective Anomalies
Type of Anomaly
Point Anomalies
Contextual Anomalies
Collective Anomalies
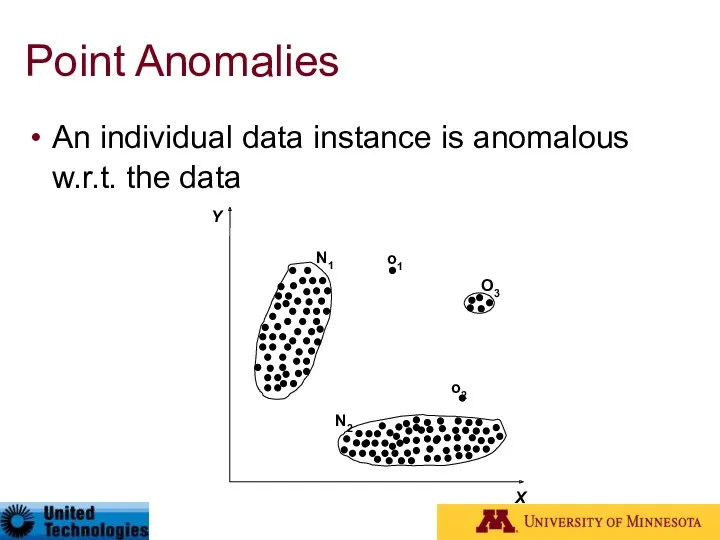
Point Anomalies
An individual data instance is anomalous w.r.t. the data
Point Anomalies
An individual data instance is anomalous w.r.t. the data
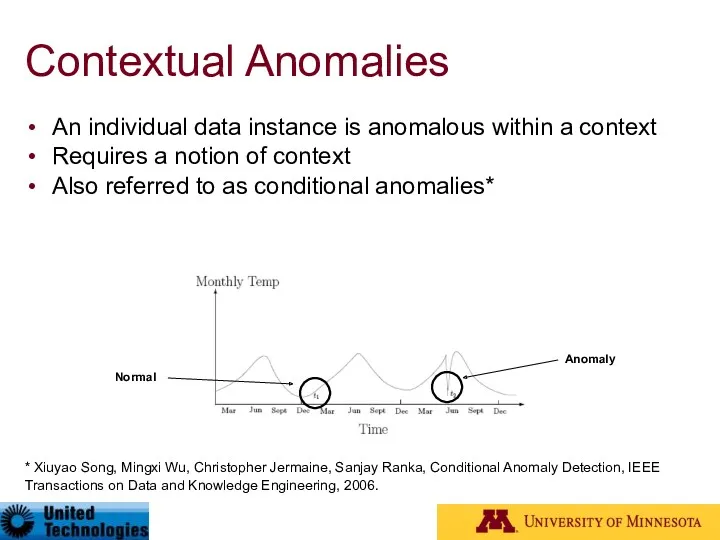
Contextual Anomalies
An individual data instance is anomalous within a context
Requires a
Contextual Anomalies
An individual data instance is anomalous within a context
Requires a
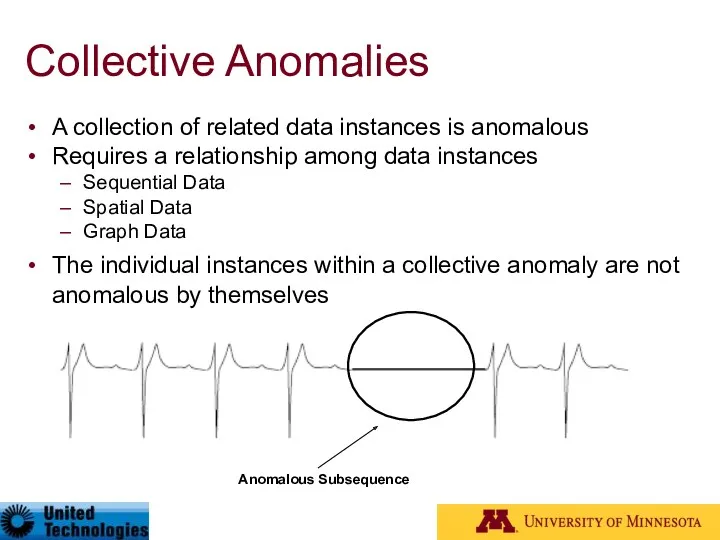
Collective Anomalies
A collection of related data instances is anomalous
Requires a relationship
Collective Anomalies
A collection of related data instances is anomalous
Requires a relationship
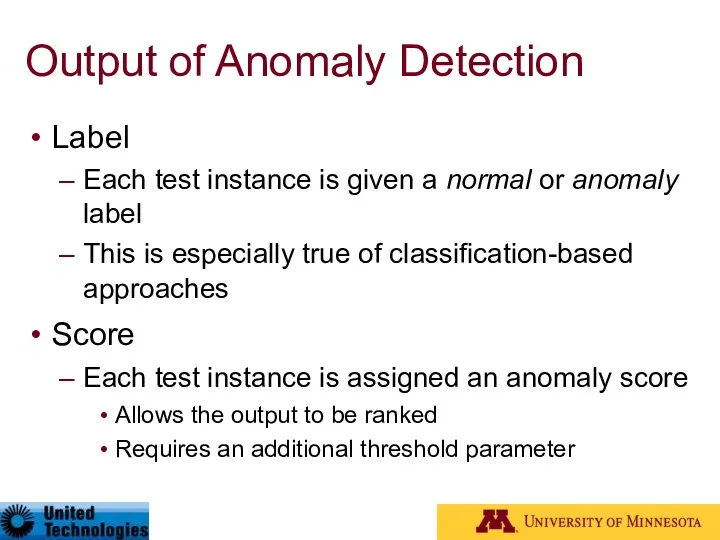
Output of Anomaly Detection
Label
Each test instance is given a normal or
Output of Anomaly Detection
Label
Each test instance is given a normal or
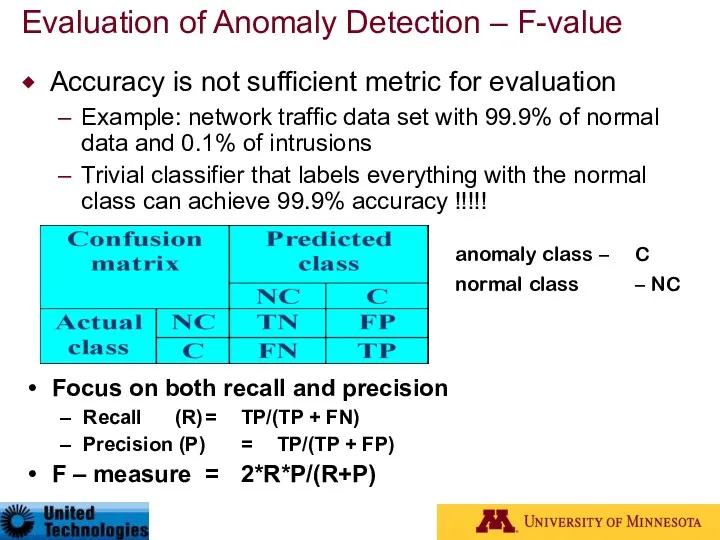
Evaluation of Anomaly Detection – F-value
Accuracy is not sufficient metric for
Evaluation of Anomaly Detection – F-value
Accuracy is not sufficient metric for
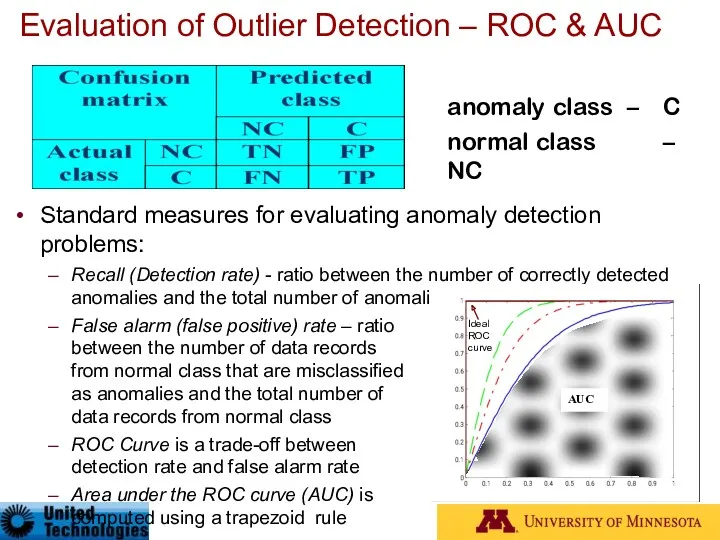
Evaluation of Outlier Detection – ROC & AUC
Standard measures for evaluating
Evaluation of Outlier Detection – ROC & AUC
Standard measures for evaluating
Applications of Anomaly Detection
Network intrusion detection
Insurance / Credit card fraud detection
Healthcare
Applications of Anomaly Detection
Network intrusion detection
Insurance / Credit card fraud detection
Healthcare
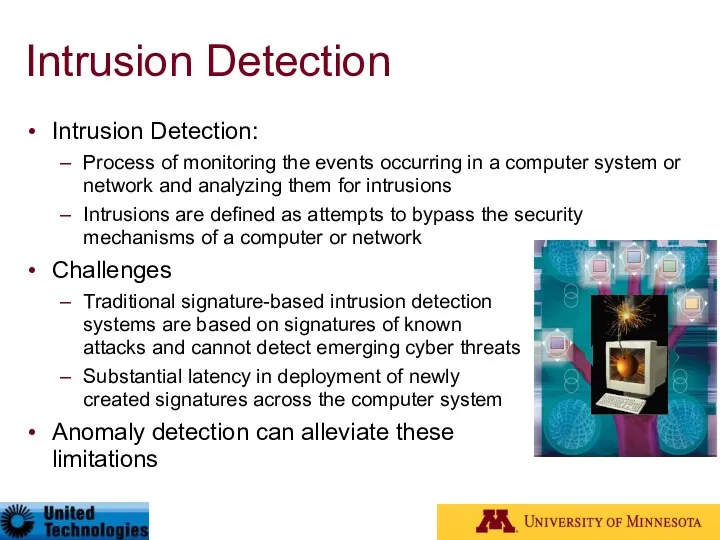
Intrusion Detection
Intrusion Detection:
Process of monitoring the events occurring in a
Intrusion Detection
Intrusion Detection:
Process of monitoring the events occurring in a
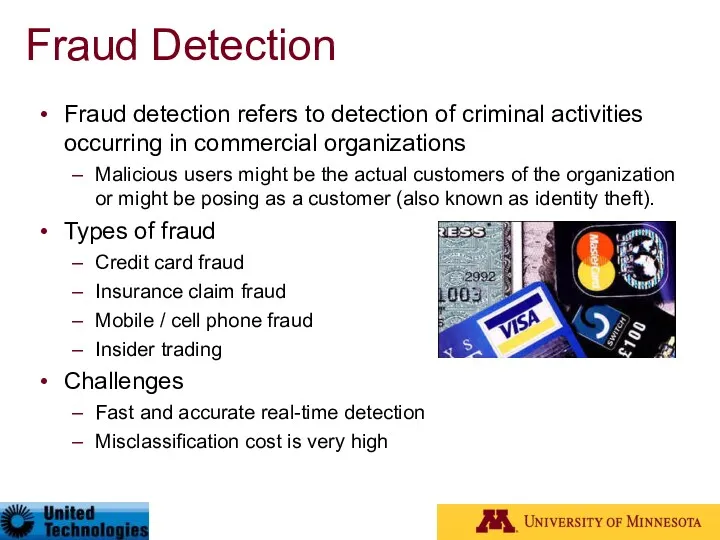
Fraud Detection
Fraud detection refers to detection of criminal activities occurring in
Fraud Detection
Fraud detection refers to detection of criminal activities occurring in
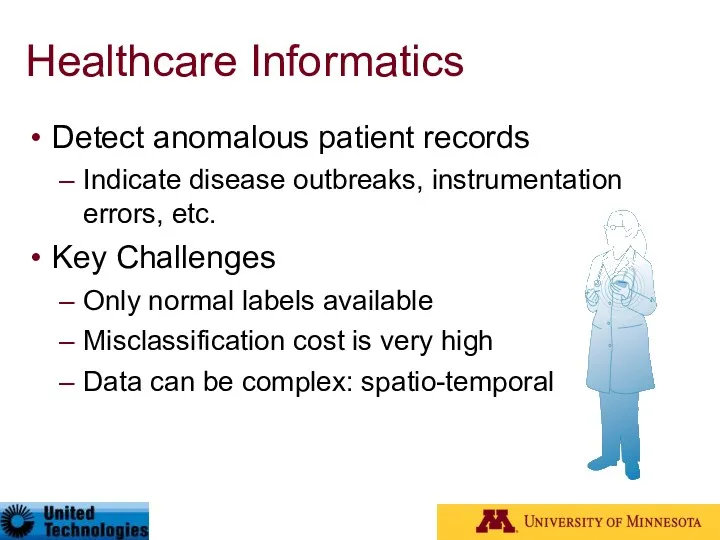
Healthcare Informatics
Detect anomalous patient records
Indicate disease outbreaks, instrumentation errors, etc.
Key Challenges
Only
Healthcare Informatics
Detect anomalous patient records
Indicate disease outbreaks, instrumentation errors, etc.
Key Challenges
Only
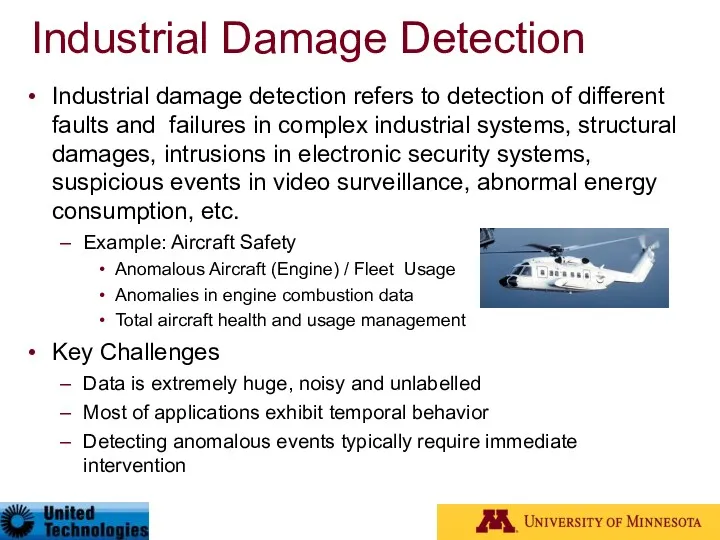
Industrial Damage Detection
Industrial damage detection refers to detection of different faults
Industrial Damage Detection
Industrial damage detection refers to detection of different faults
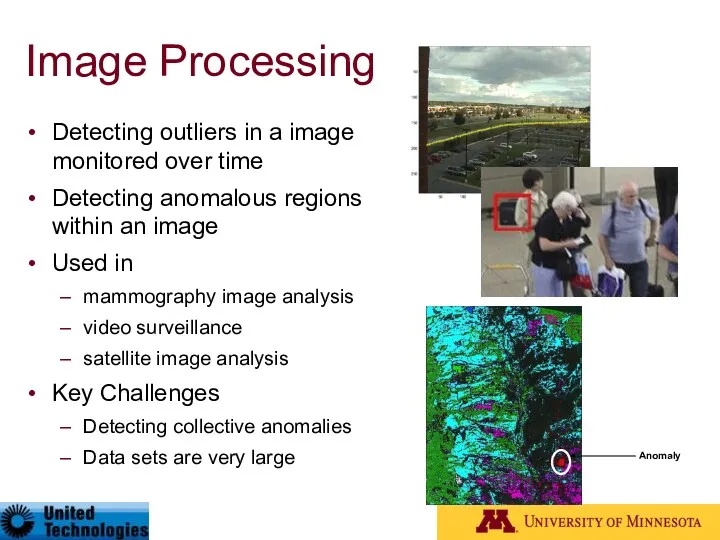
Image Processing
Detecting outliers in a image monitored over time
Detecting anomalous regions
Image Processing
Detecting outliers in a image monitored over time
Detecting anomalous regions
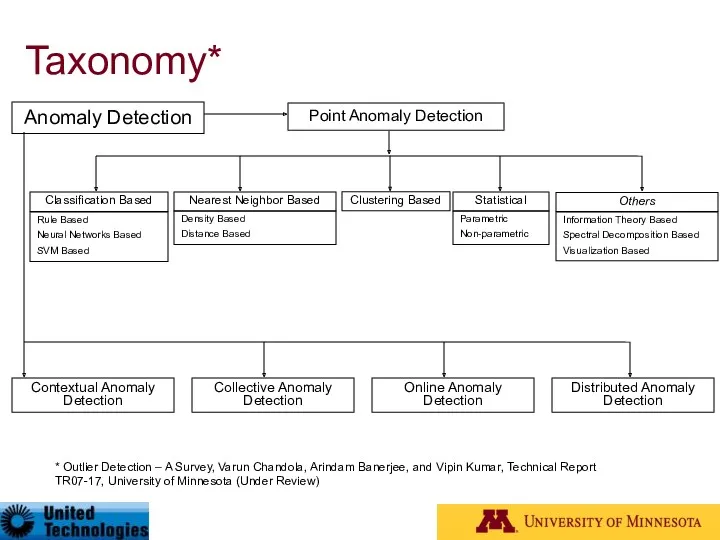
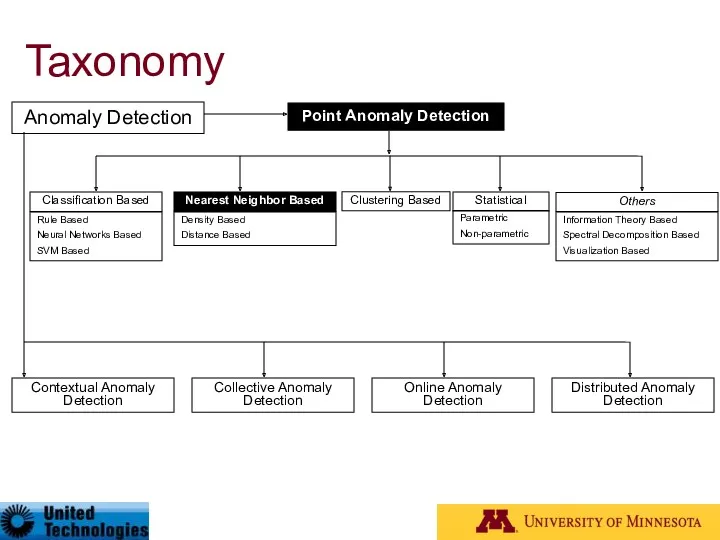
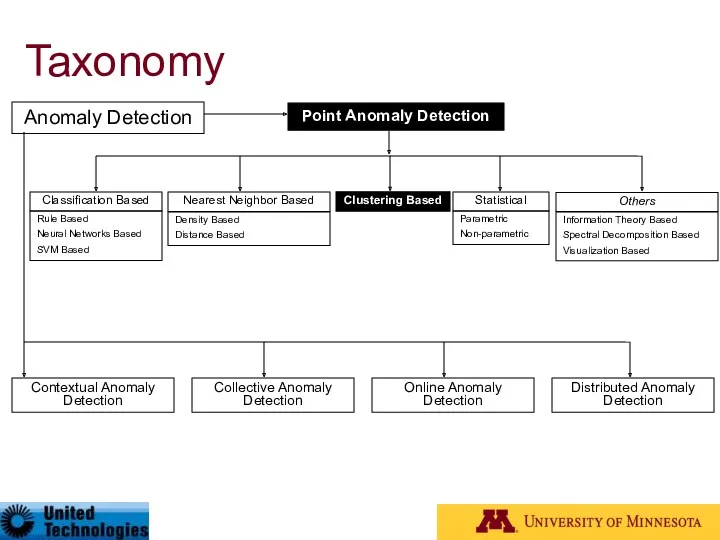
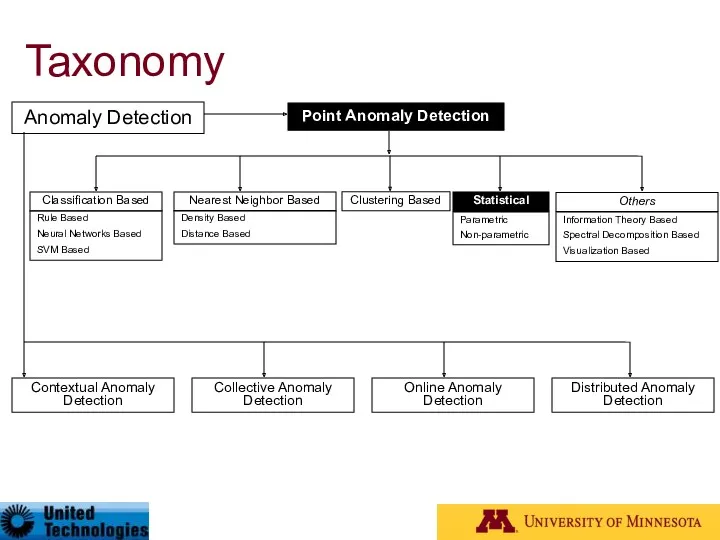
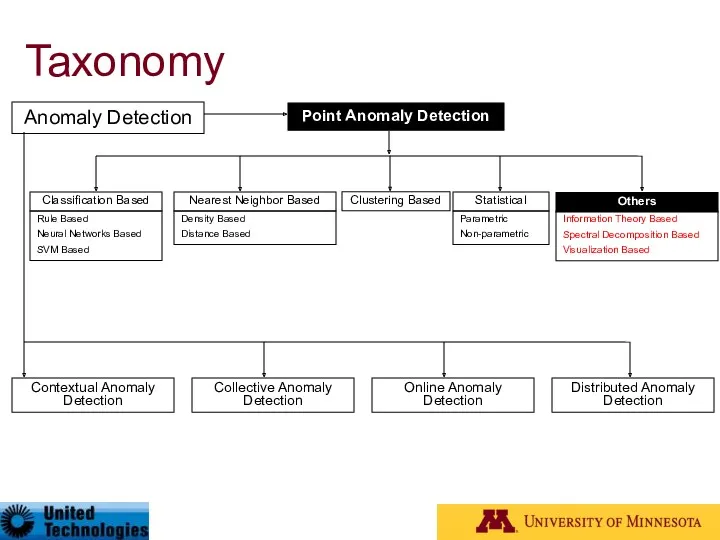
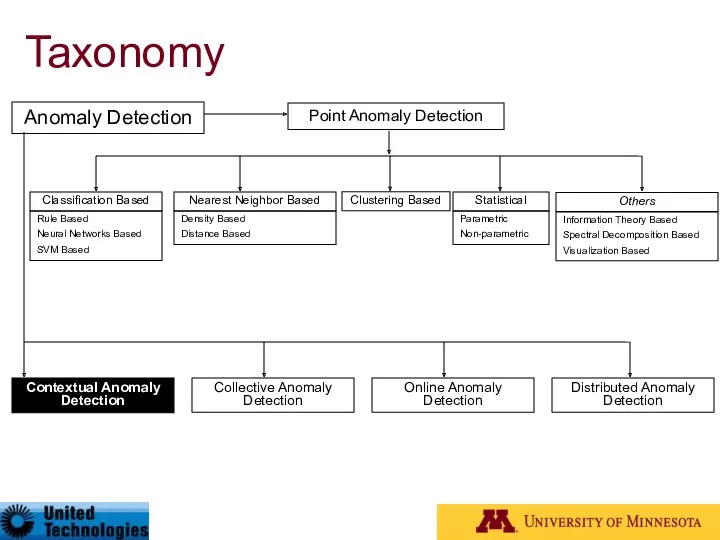
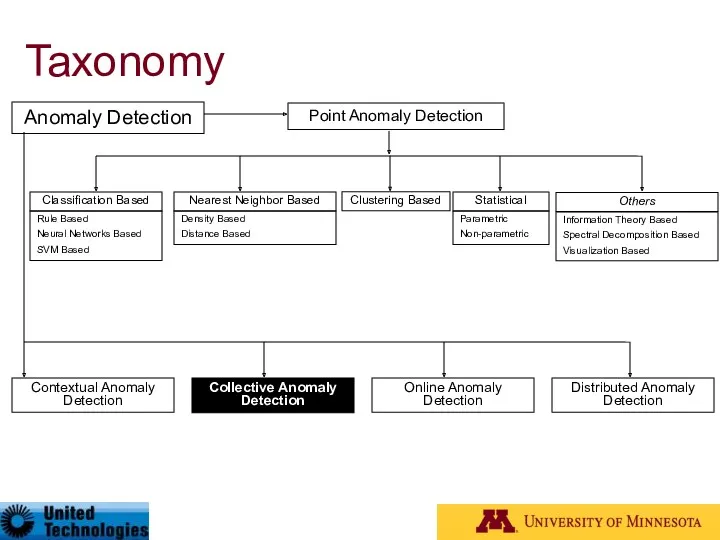
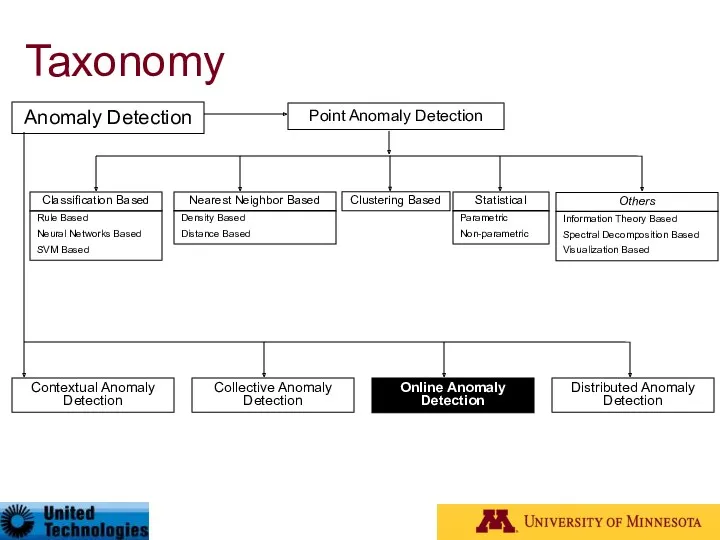
Taxonomy*
Anomaly Detection
Contextual Anomaly Detection
Collective Anomaly Detection
Online Anomaly Detection
Distributed Anomaly Detection
Point Anomaly
Taxonomy*
Anomaly Detection
Contextual Anomaly Detection
Collective Anomaly Detection
Online Anomaly Detection
Distributed Anomaly Detection
Point Anomaly
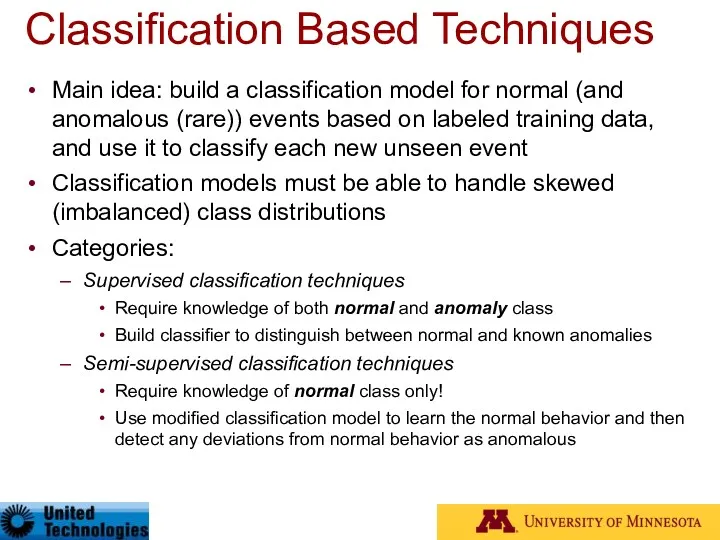
Classification Based Techniques
Main idea: build a classification model for normal (and
Classification Based Techniques
Main idea: build a classification model for normal (and
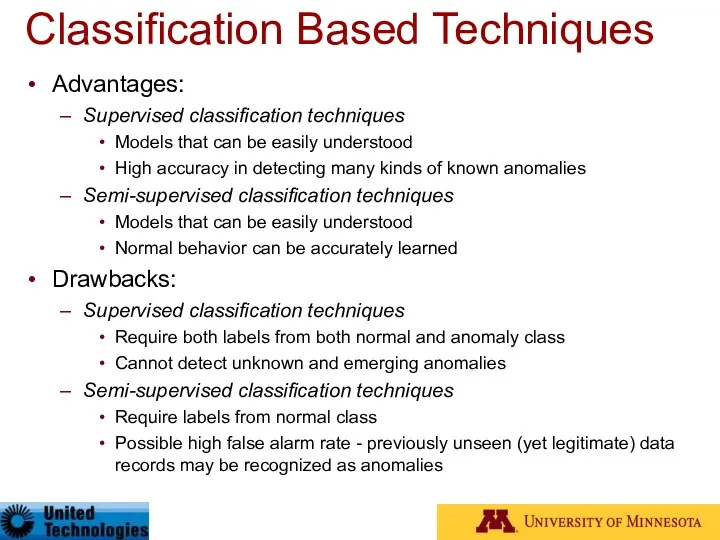
Classification Based Techniques
Advantages:
Supervised classification techniques
Models that can be easily understood
High accuracy
Classification Based Techniques
Advantages:
Supervised classification techniques
Models that can be easily understood
High accuracy
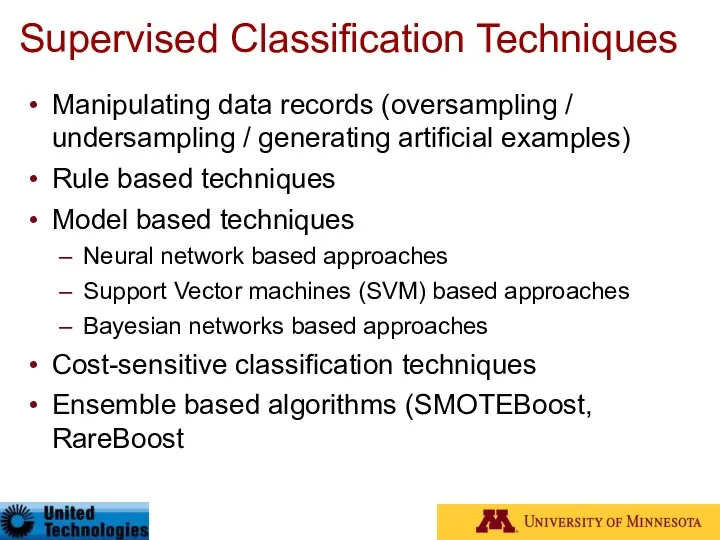
Supervised Classification Techniques
Manipulating data records (oversampling / undersampling / generating artificial
Supervised Classification Techniques
Manipulating data records (oversampling / undersampling / generating artificial
![Manipulating Data Records Over-sampling the rare class [Ling98] Make the](/_ipx/f_webp&q_80&fit_contain&s_1440x1080/imagesDir/jpg/282685/slide-30.jpg)
Manipulating Data Records
Over-sampling the rare class [Ling98]
Make the duplicates of the
Manipulating Data Records
Over-sampling the rare class [Ling98]
Make the duplicates of the
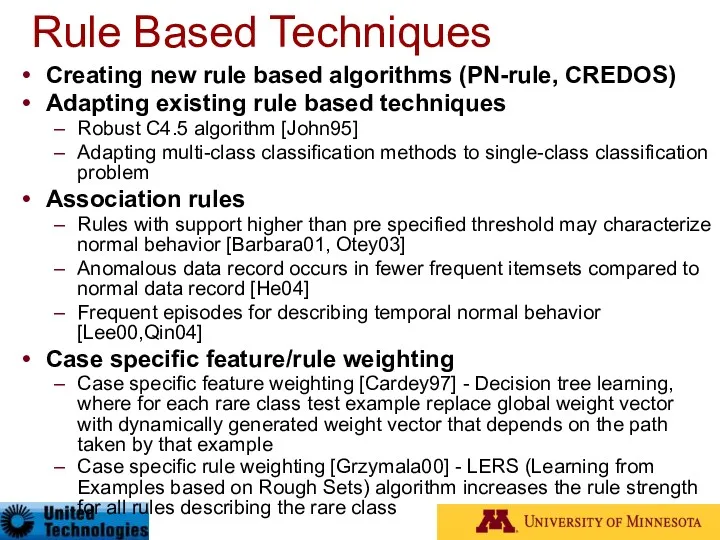
Rule Based Techniques
Creating new rule based algorithms (PN-rule, CREDOS)
Adapting existing rule
Rule Based Techniques
Creating new rule based algorithms (PN-rule, CREDOS)
Adapting existing rule

New Rule-based Algorithms: PN-rule Learning*
P-phase:
cover most of the positive examples with
New Rule-based Algorithms: PN-rule Learning*
P-phase:
cover most of the positive examples with
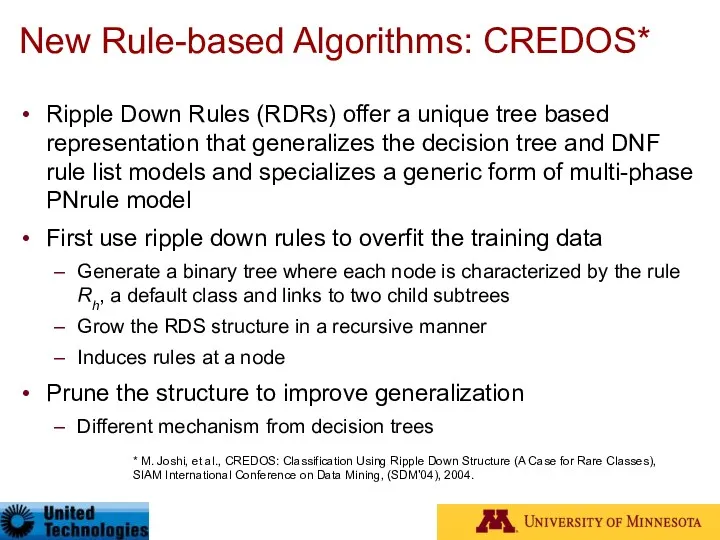
New Rule-based Algorithms: CREDOS*
Ripple Down Rules (RDRs) offer a unique tree
New Rule-based Algorithms: CREDOS*
Ripple Down Rules (RDRs) offer a unique tree
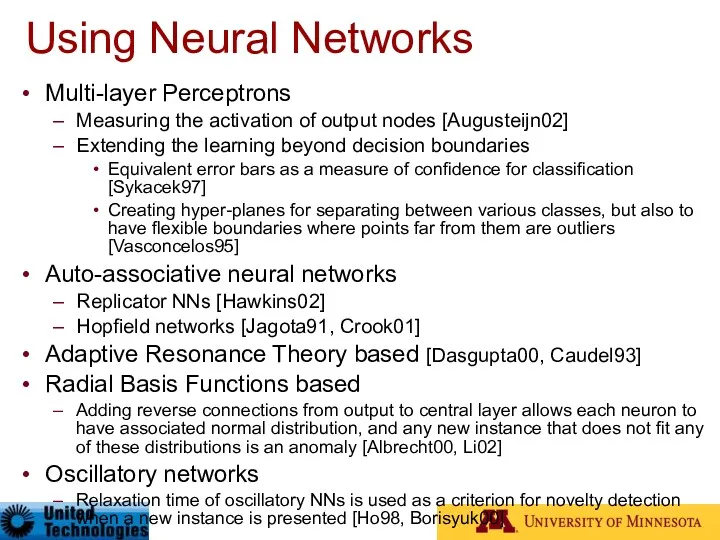
Using Neural Networks
Multi-layer Perceptrons
Measuring the activation of output nodes [Augusteijn02]
Extending the
Using Neural Networks
Multi-layer Perceptrons
Measuring the activation of output nodes [Augusteijn02]
Extending the
![Using Support Vector Machines SVM Classifiers [Steinwart05,Mukkamala02] Main idea [Steinwart05]](/_ipx/f_webp&q_80&fit_contain&s_1440x1080/imagesDir/jpg/282685/slide-35.jpg)
Using Support Vector Machines
SVM Classifiers [Steinwart05,Mukkamala02]
Main idea [Steinwart05] :
Normal data records
Using Support Vector Machines
SVM Classifiers [Steinwart05,Mukkamala02]
Main idea [Steinwart05] :
Normal data records
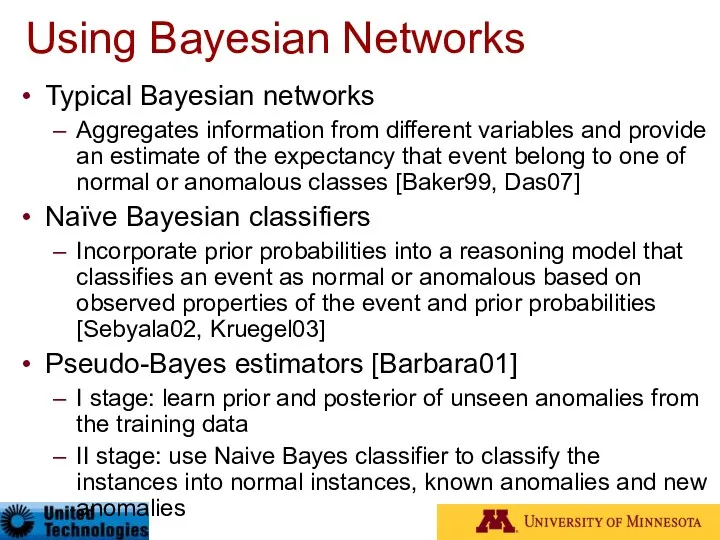
Using Bayesian Networks
Typical Bayesian networks
Aggregates information from different variables and
Using Bayesian Networks
Typical Bayesian networks
Aggregates information from different variables and
Semi-supervised Classification Techniques
Use modified classification model to learn the normal behavior
Semi-supervised Classification Techniques
Use modified classification model to learn the normal behavior
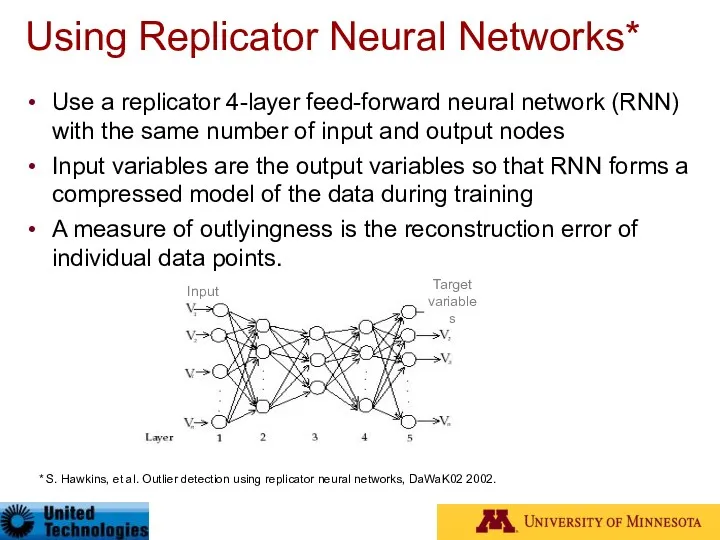
Using Replicator Neural Networks*
Use a replicator 4-layer feed-forward neural network (RNN)
Using Replicator Neural Networks*
Use a replicator 4-layer feed-forward neural network (RNN)
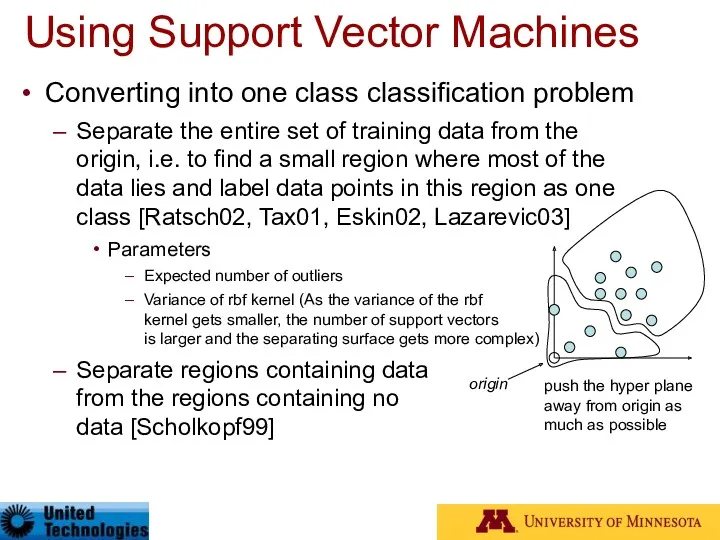
Using Support Vector Machines
Converting into one class classification problem
Separate the entire
Using Support Vector Machines
Converting into one class classification problem
Separate the entire
Taxonomy
Anomaly Detection
Contextual Anomaly Detection
Collective Anomaly Detection
Online Anomaly Detection
Distributed Anomaly Detection
Point Anomaly
Taxonomy
Anomaly Detection
Contextual Anomaly Detection
Collective Anomaly Detection
Online Anomaly Detection
Distributed Anomaly Detection
Point Anomaly
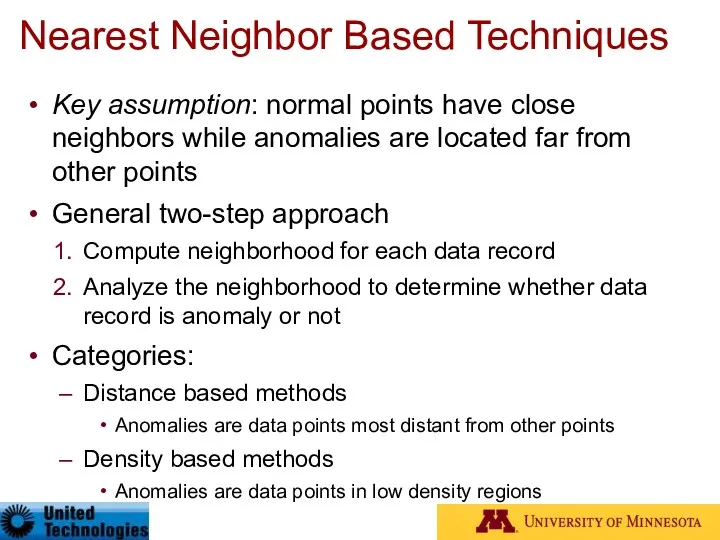
Nearest Neighbor Based Techniques
Key assumption: normal points have close neighbors while
Nearest Neighbor Based Techniques
Key assumption: normal points have close neighbors while
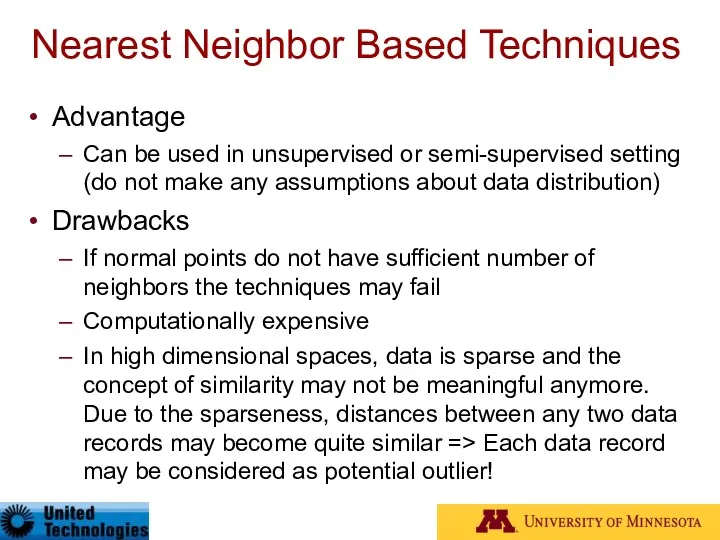
Nearest Neighbor Based Techniques
Advantage
Can be used in unsupervised or semi-supervised setting
Nearest Neighbor Based Techniques
Advantage
Can be used in unsupervised or semi-supervised setting
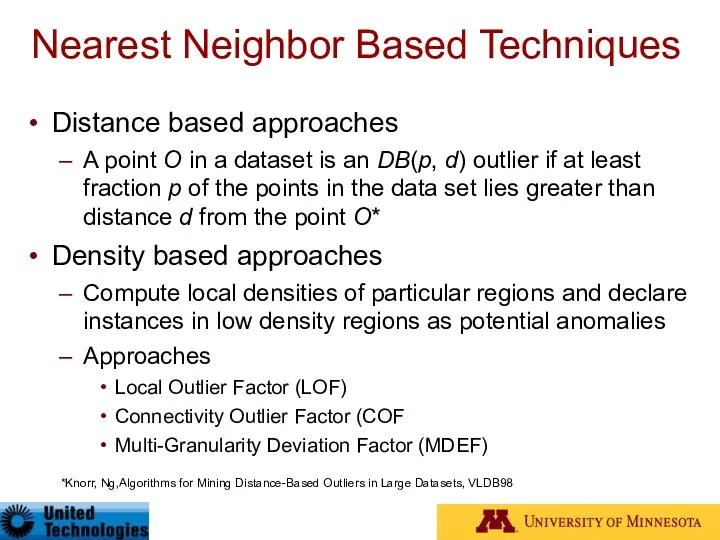
Nearest Neighbor Based Techniques
Distance based approaches
A point O in a dataset
Nearest Neighbor Based Techniques
Distance based approaches
A point O in a dataset
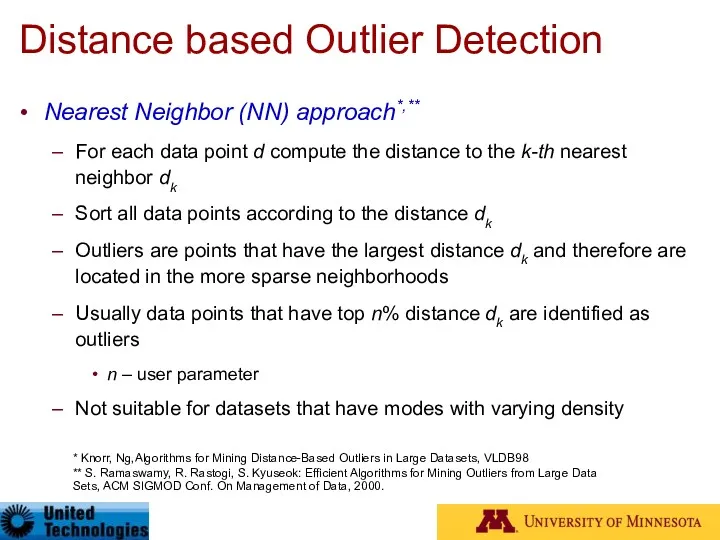
Distance based Outlier Detection
Nearest Neighbor (NN) approach*,**
For each data point d
Distance based Outlier Detection
Nearest Neighbor (NN) approach*,**
For each data point d
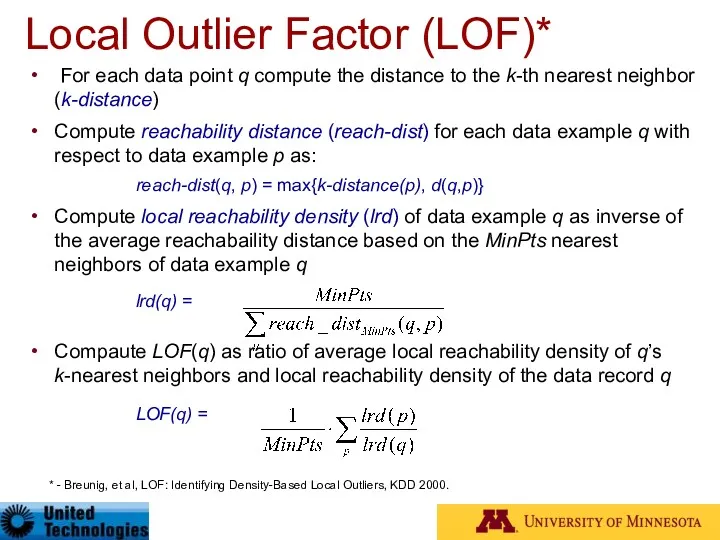
Local Outlier Factor (LOF)*
For each data point q compute the
Local Outlier Factor (LOF)*
For each data point q compute the
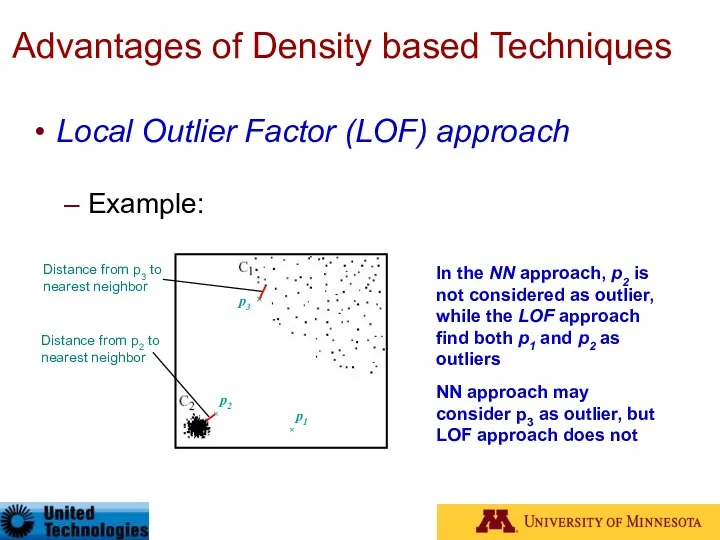
Advantages of Density based Techniques
Local Outlier Factor (LOF) approach
Example:
p2
×
Advantages of Density based Techniques
Local Outlier Factor (LOF) approach
Example:
p2
×
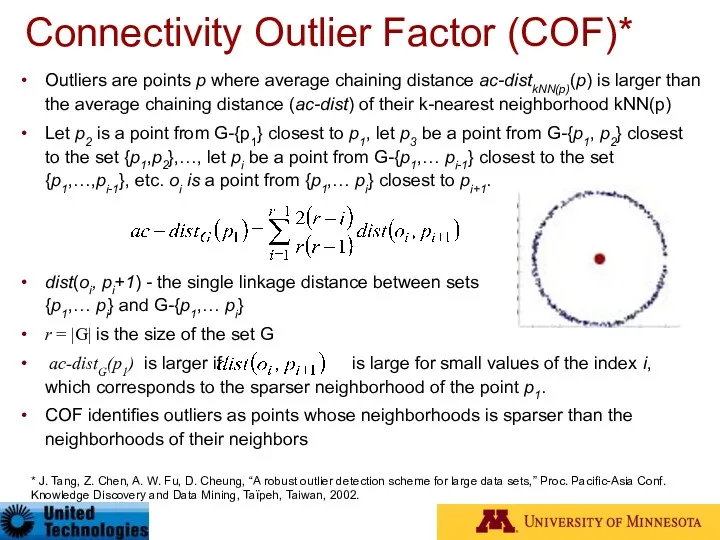
Connectivity Outlier Factor (COF)*
Outliers are points p where average chaining distance
Connectivity Outlier Factor (COF)*
Outliers are points p where average chaining distance
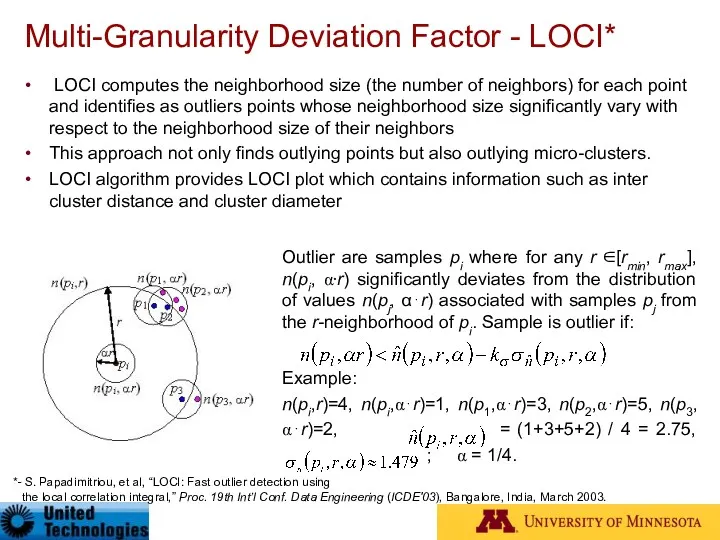
Multi-Granularity Deviation Factor - LOCI*
LOCI computes the neighborhood size (the
Multi-Granularity Deviation Factor - LOCI*
LOCI computes the neighborhood size (the
Taxonomy
Anomaly Detection
Contextual Anomaly Detection
Collective Anomaly Detection
Online Anomaly Detection
Distributed Anomaly Detection
Point Anomaly
Taxonomy
Anomaly Detection
Contextual Anomaly Detection
Collective Anomaly Detection
Online Anomaly Detection
Distributed Anomaly Detection
Point Anomaly
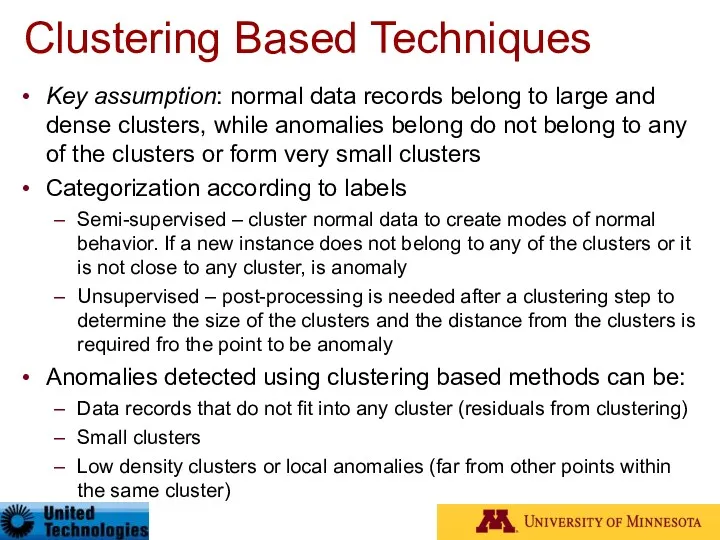
Clustering Based Techniques
Key assumption: normal data records belong to large and
Clustering Based Techniques
Key assumption: normal data records belong to large and
Clustering Based Techniques
Advantages:
No need to be supervised
Easily adaptable to on-line /
Clustering Based Techniques
Advantages:
No need to be supervised
Easily adaptable to on-line /
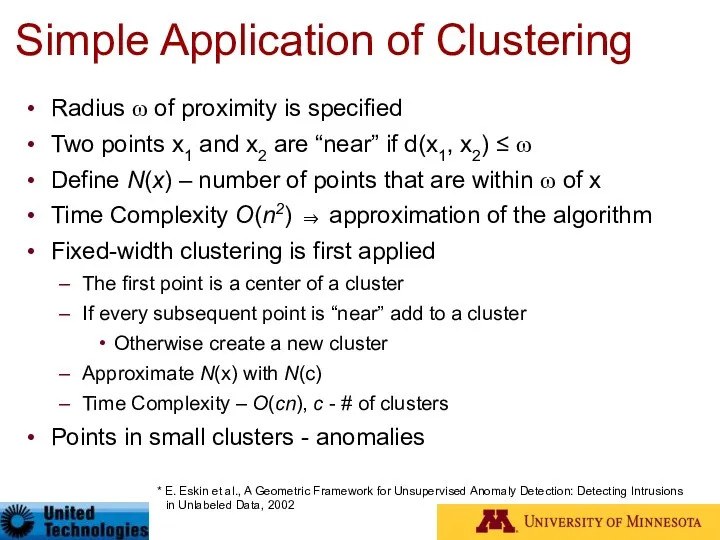
Simple Application of Clustering
Radius ω of proximity is specified
Two points x1
Simple Application of Clustering
Radius ω of proximity is specified
Two points x1
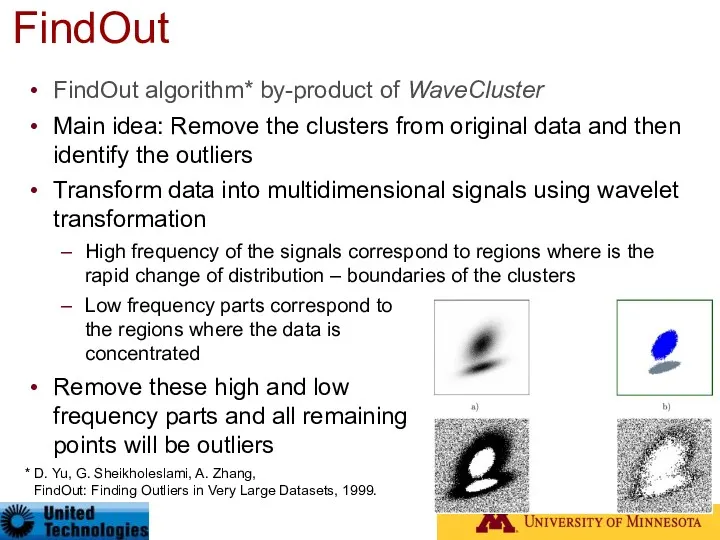
FindOut algorithm* by-product of WaveCluster
Main idea: Remove the clusters from original
FindOut algorithm* by-product of WaveCluster
Main idea: Remove the clusters from original
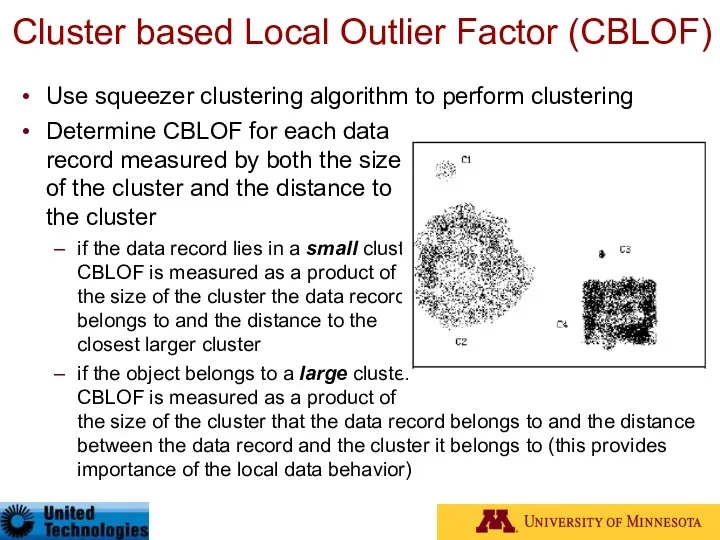
Cluster based Local Outlier Factor (CBLOF)
Use squeezer clustering algorithm to perform
Cluster based Local Outlier Factor (CBLOF)
Use squeezer clustering algorithm to perform
Taxonomy
Anomaly Detection
Contextual Anomaly Detection
Collective Anomaly Detection
Online Anomaly Detection
Distributed Anomaly Detection
Point Anomaly
Taxonomy
Anomaly Detection
Contextual Anomaly Detection
Collective Anomaly Detection
Online Anomaly Detection
Distributed Anomaly Detection
Point Anomaly
Statistics Based Techniques
Data points are modeled using stochastic distribution ⇒ points
Statistics Based Techniques
Data points are modeled using stochastic distribution ⇒ points
Types of Statistical Techniques
Parametric Techniques
Assume that the normal (and possibly anomalous)
Types of Statistical Techniques
Parametric Techniques
Assume that the normal (and possibly anomalous)
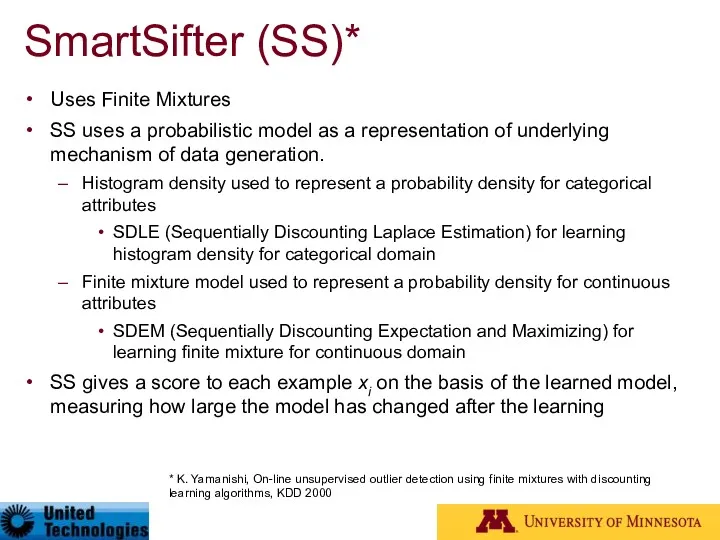
SmartSifter (SS)*
Uses Finite Mixtures
SS uses a probabilistic model as a
SmartSifter (SS)*
Uses Finite Mixtures
SS uses a probabilistic model as a
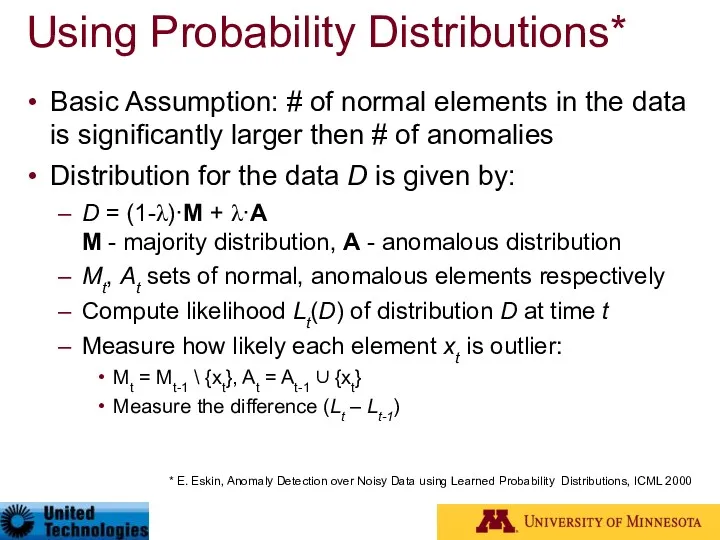
Using Probability Distributions*
Basic Assumption: # of normal elements in the data
Using Probability Distributions*
Basic Assumption: # of normal elements in the data
Taxonomy
Anomaly Detection
Contextual Anomaly Detection
Collective Anomaly Detection
Online Anomaly Detection
Distributed Anomaly Detection
Point Anomaly
Taxonomy
Anomaly Detection
Contextual Anomaly Detection
Collective Anomaly Detection
Online Anomaly Detection
Distributed Anomaly Detection
Point Anomaly
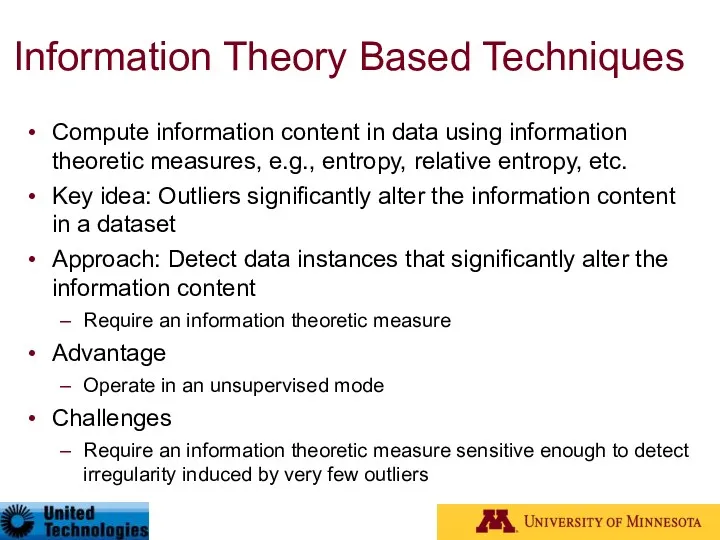
Information Theory Based Techniques
Compute information content in data using information theoretic
Information Theory Based Techniques
Compute information content in data using information theoretic
![Using a variety of information theoretic measures [Lee01] Kolmogorov complexity](/_ipx/f_webp&q_80&fit_contain&s_1440x1080/imagesDir/jpg/282685/slide-62.jpg)
Using a variety of information theoretic measures [Lee01]
Kolmogorov complexity based approaches
Using a variety of information theoretic measures [Lee01]
Kolmogorov complexity based approaches
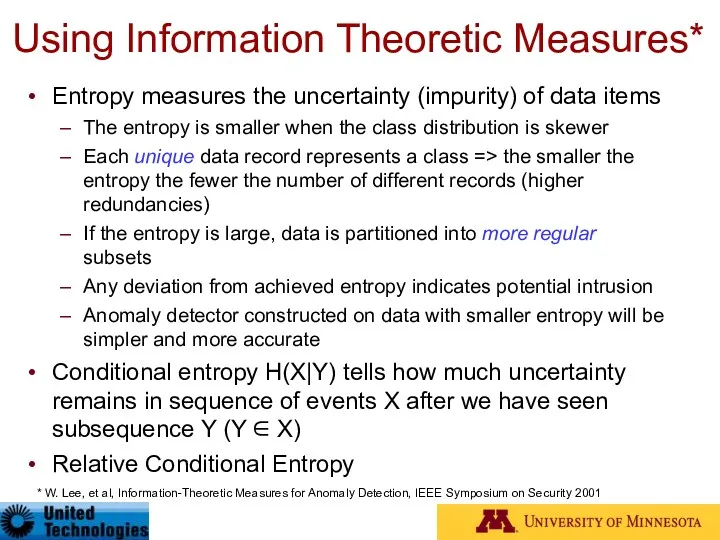
Using Information Theoretic Measures*
Entropy measures the uncertainty (impurity) of data items
The
Using Information Theoretic Measures*
Entropy measures the uncertainty (impurity) of data items
The
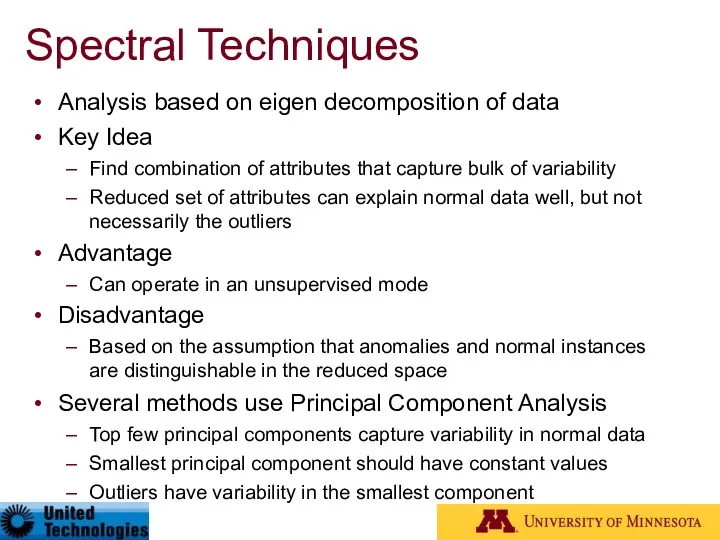
Spectral Techniques
Analysis based on eigen decomposition of data
Key Idea
Find combination of
Spectral Techniques
Analysis based on eigen decomposition of data
Key Idea
Find combination of
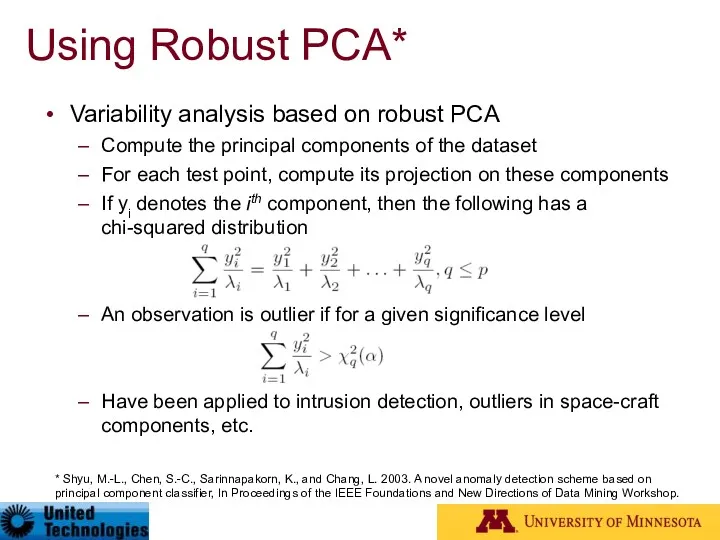
Using Robust PCA*
Variability analysis based on robust PCA
Compute the principal components
Using Robust PCA*
Variability analysis based on robust PCA
Compute the principal components
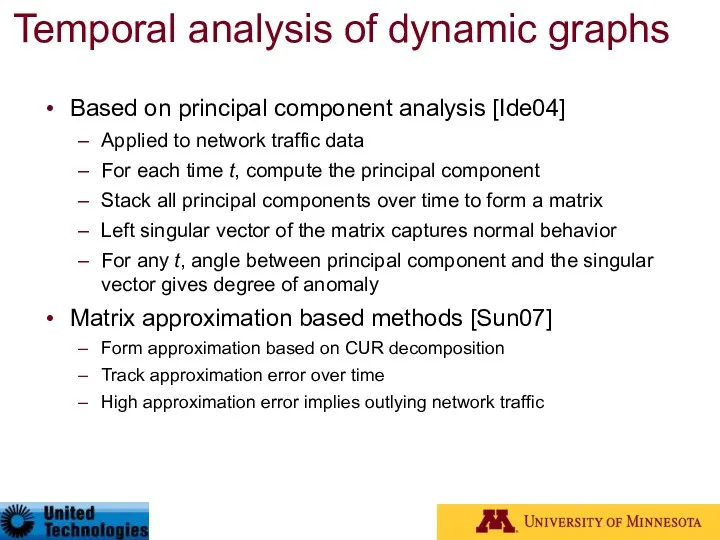
Temporal analysis of dynamic graphs
Based on principal component analysis [Ide04]
Applied to
Temporal analysis of dynamic graphs
Based on principal component analysis [Ide04]
Applied to
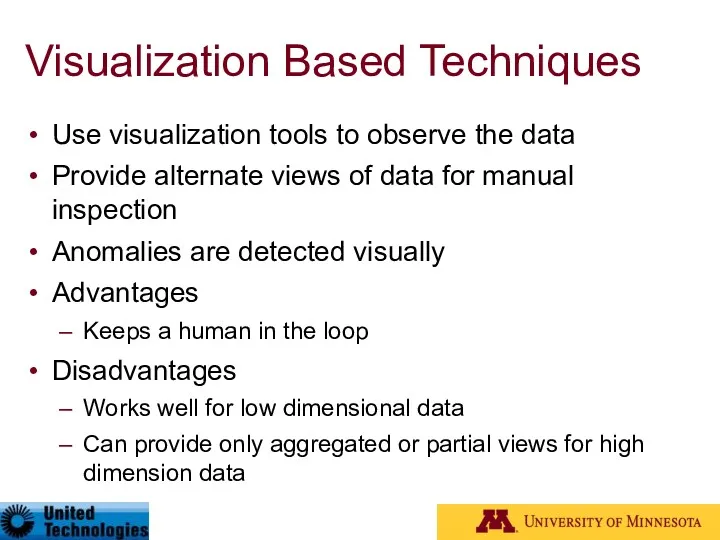
Visualization Based Techniques
Use visualization tools to observe the data
Provide alternate views
Visualization Based Techniques
Use visualization tools to observe the data
Provide alternate views
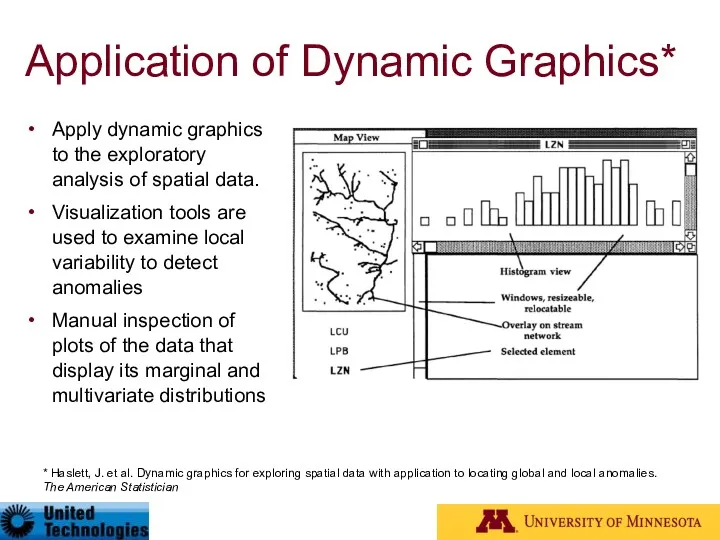
Application of Dynamic Graphics*
Apply dynamic graphics to the exploratory analysis of
Application of Dynamic Graphics*
Apply dynamic graphics to the exploratory analysis of
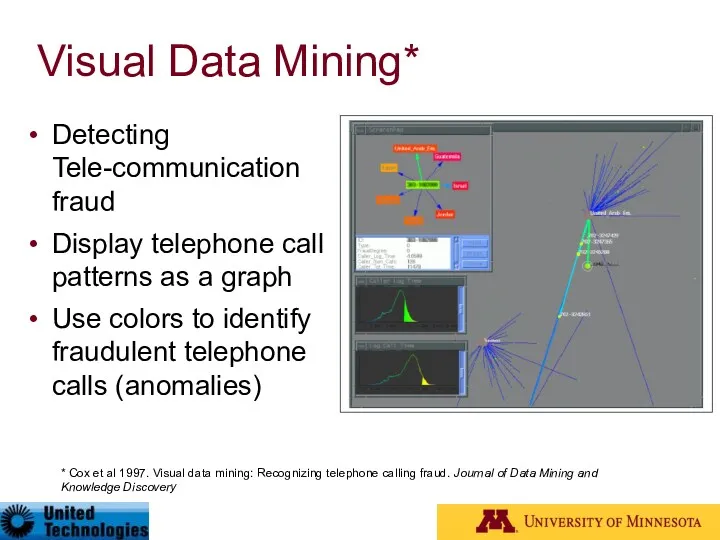
Visual Data Mining*
Detecting Tele-communication fraud
Display telephone call patterns as a
Visual Data Mining*
Detecting Tele-communication fraud
Display telephone call patterns as a
Taxonomy
Anomaly Detection
Contextual Anomaly Detection
Collective Anomaly Detection
Online Anomaly Detection
Distributed Anomaly Detection
Point Anomaly
Taxonomy
Anomaly Detection
Contextual Anomaly Detection
Collective Anomaly Detection
Online Anomaly Detection
Distributed Anomaly Detection
Point Anomaly
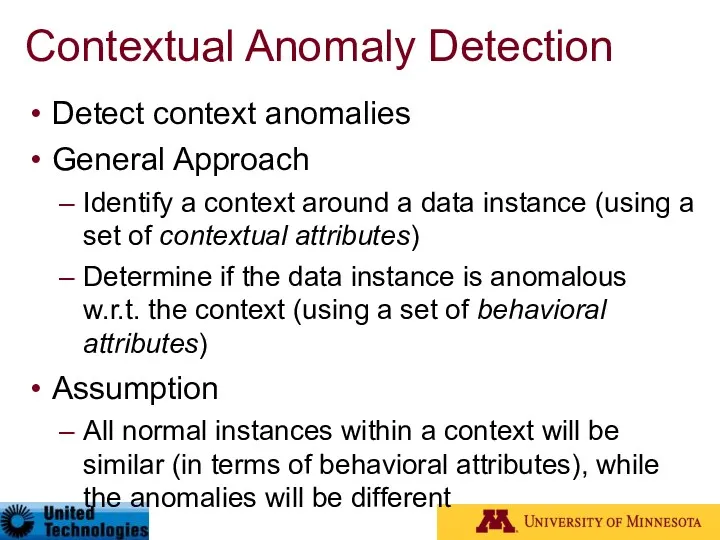
Contextual Anomaly Detection
Detect context anomalies
General Approach
Identify a context around a data
Contextual Anomaly Detection
Detect context anomalies
General Approach
Identify a context around a data
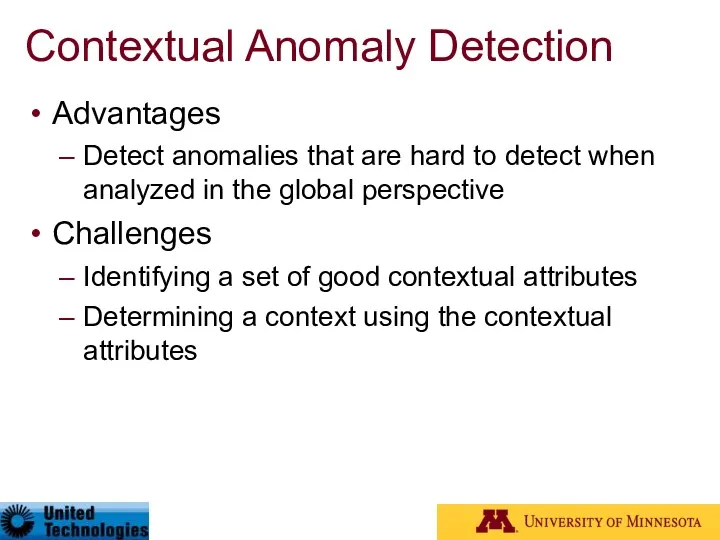
Contextual Anomaly Detection
Advantages
Detect anomalies that are hard to detect when analyzed
Contextual Anomaly Detection
Advantages
Detect anomalies that are hard to detect when analyzed
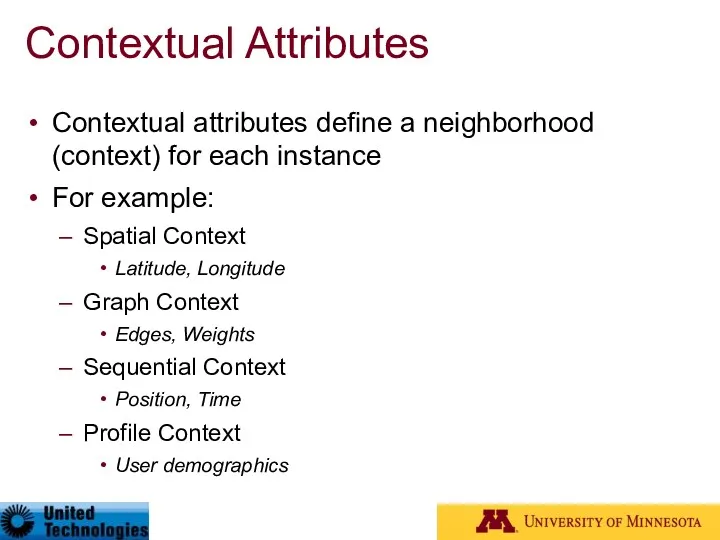
Contextual Attributes
Contextual attributes define a neighborhood (context) for each instance
For example:
Spatial
Contextual Attributes
Contextual attributes define a neighborhood (context) for each instance
For example:
Spatial
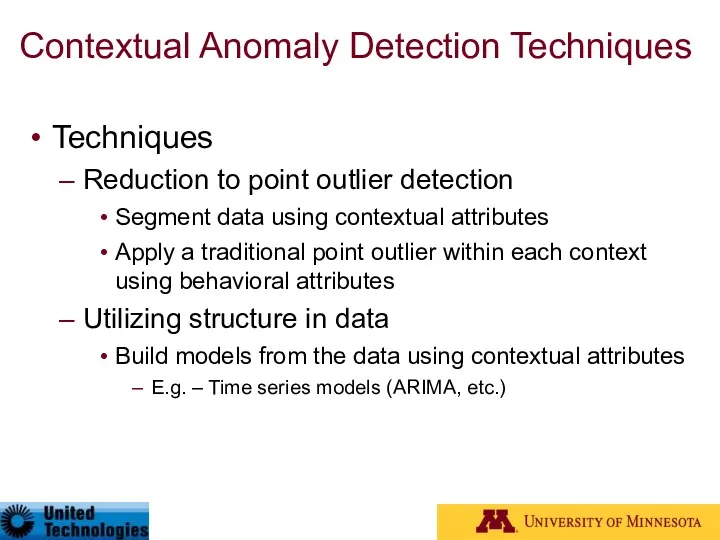
Contextual Anomaly Detection Techniques
Techniques
Reduction to point outlier detection
Segment data using contextual
Contextual Anomaly Detection Techniques
Techniques
Reduction to point outlier detection
Segment data using contextual
![Conditional Anomaly Detection* Each data point is represented as [x,y],](/_ipx/f_webp&q_80&fit_contain&s_1440x1080/imagesDir/jpg/282685/slide-75.jpg)
Conditional Anomaly Detection*
Each data point is represented as [x,y], where x
Conditional Anomaly Detection*
Each data point is represented as [x,y], where x
Taxonomy
Anomaly Detection
Contextual Anomaly Detection
Collective Anomaly Detection
Online Anomaly Detection
Distributed Anomaly Detection
Point Anomaly
Taxonomy
Anomaly Detection
Contextual Anomaly Detection
Collective Anomaly Detection
Online Anomaly Detection
Distributed Anomaly Detection
Point Anomaly

Collective Anomaly Detection
Detect collective anomalies
Exploit the relationship among data instances
Sequential anomaly
Collective Anomaly Detection
Detect collective anomalies
Exploit the relationship among data instances
Sequential anomaly
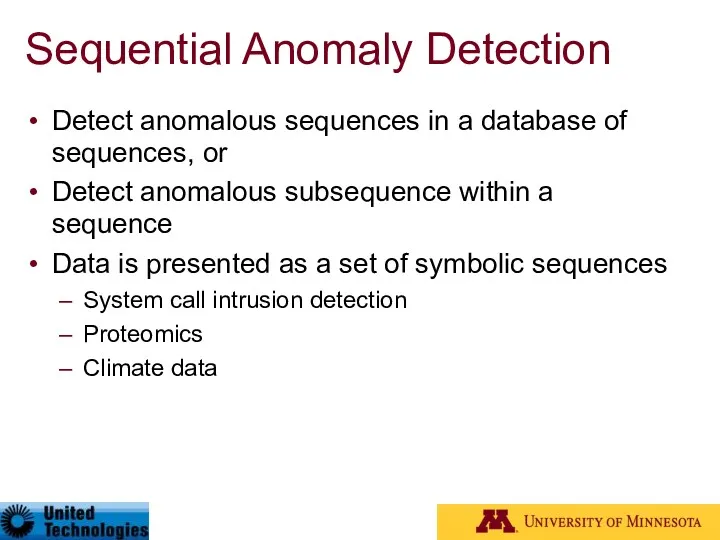
Sequential Anomaly Detection
Detect anomalous sequences in a database of sequences, or
Detect
Sequential Anomaly Detection
Detect anomalous sequences in a database of sequences, or
Detect
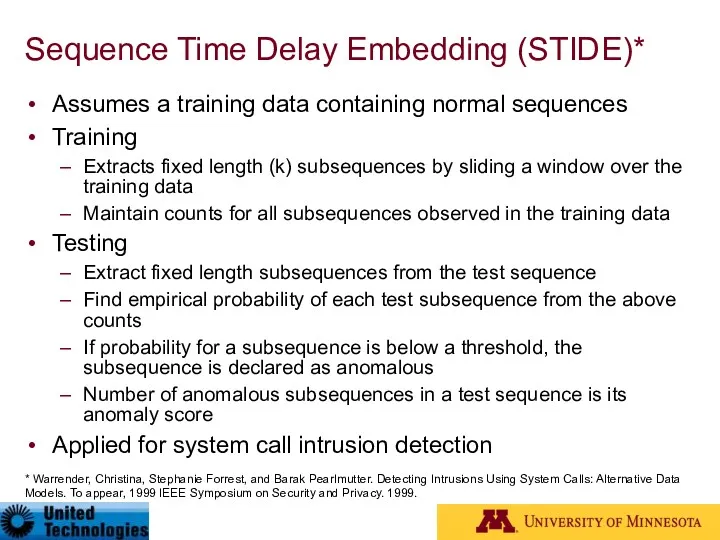
Sequence Time Delay Embedding (STIDE)*
Assumes a training data containing normal sequences
Training
Extracts
Sequence Time Delay Embedding (STIDE)*
Assumes a training data containing normal sequences
Training
Extracts
Taxonomy
Anomaly Detection
Contextual Anomaly Detection
Collective Anomaly Detection
Online Anomaly Detection
Distributed Anomaly Detection
Point Anomaly
Taxonomy
Anomaly Detection
Contextual Anomaly Detection
Collective Anomaly Detection
Online Anomaly Detection
Distributed Anomaly Detection
Point Anomaly
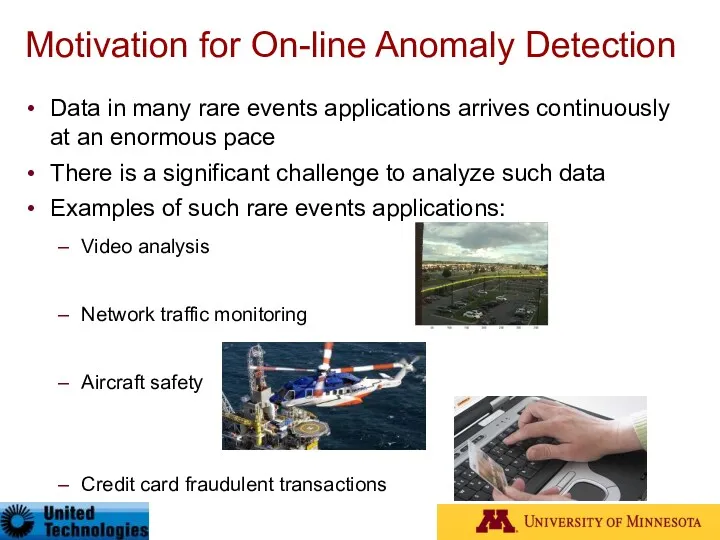
Motivation for On-line Anomaly Detection
Data in many rare events applications arrives
Motivation for On-line Anomaly Detection
Data in many rare events applications arrives
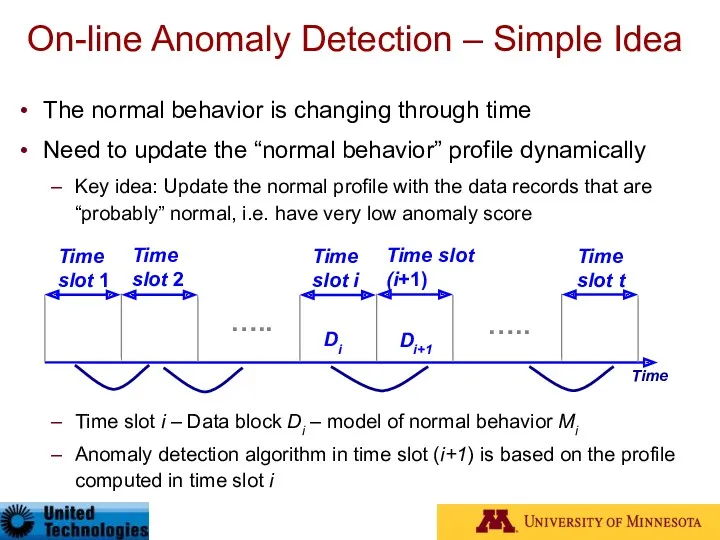
On-line Anomaly Detection – Simple Idea
The normal behavior is changing through
On-line Anomaly Detection – Simple Idea
The normal behavior is changing through
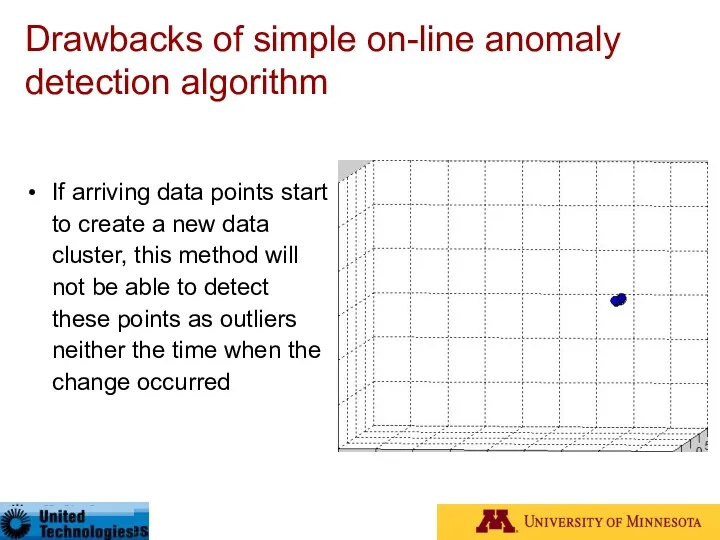
Drawbacks of simple on-line anomaly detection algorithm
If arriving data points start
Drawbacks of simple on-line anomaly detection algorithm
If arriving data points start
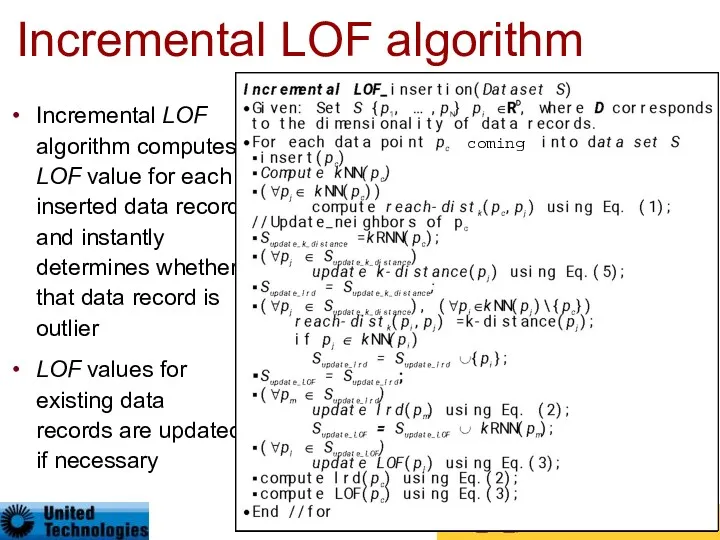
Incremental LOF algorithm
Incremental LOF algorithm computes LOF value for each inserted
Incremental LOF algorithm
Incremental LOF algorithm computes LOF value for each inserted
Taxonomy
Anomaly Detection
Contextual Anomaly Detection
Collective Anomaly Detection
Online Anomaly Detection
Distributed Anomaly Detection
Point Anomaly
Taxonomy
Anomaly Detection
Contextual Anomaly Detection
Collective Anomaly Detection
Online Anomaly Detection
Distributed Anomaly Detection
Point Anomaly
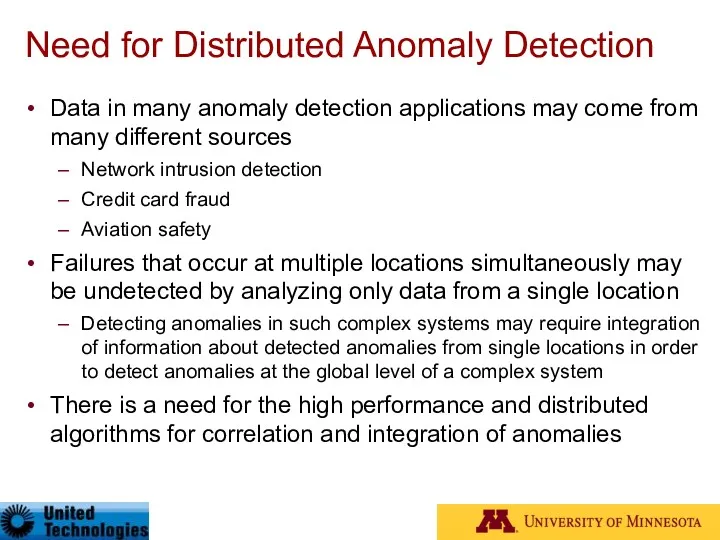
Need for Distributed Anomaly Detection
Data in many anomaly detection applications may
Need for Distributed Anomaly Detection
Data in many anomaly detection applications may
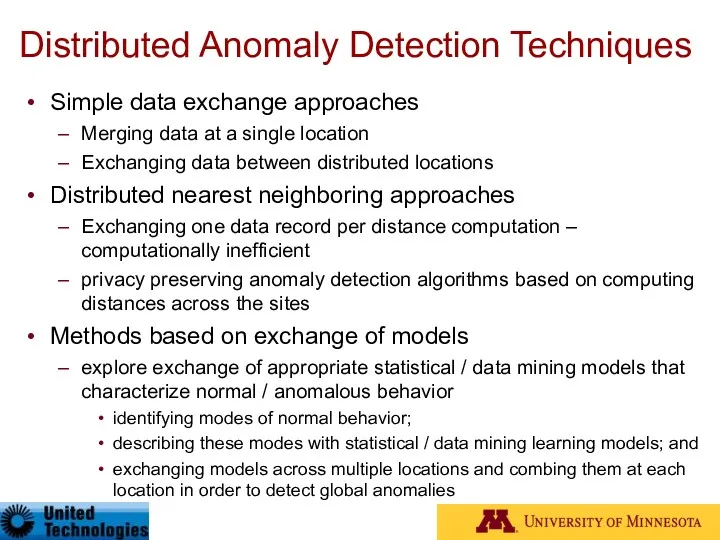
Distributed Anomaly Detection Techniques
Simple data exchange approaches
Merging data at a single
Distributed Anomaly Detection Techniques
Simple data exchange approaches
Merging data at a single
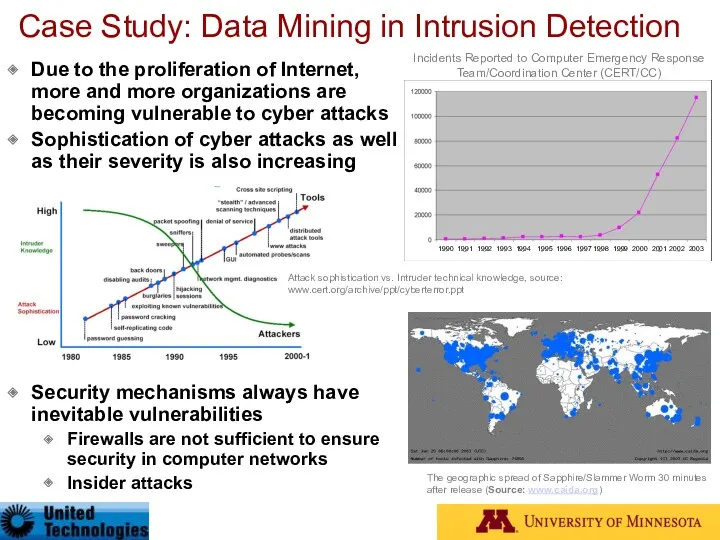
Case Study: Data Mining in Intrusion Detection
Due to the proliferation of
Case Study: Data Mining in Intrusion Detection
Due to the proliferation of
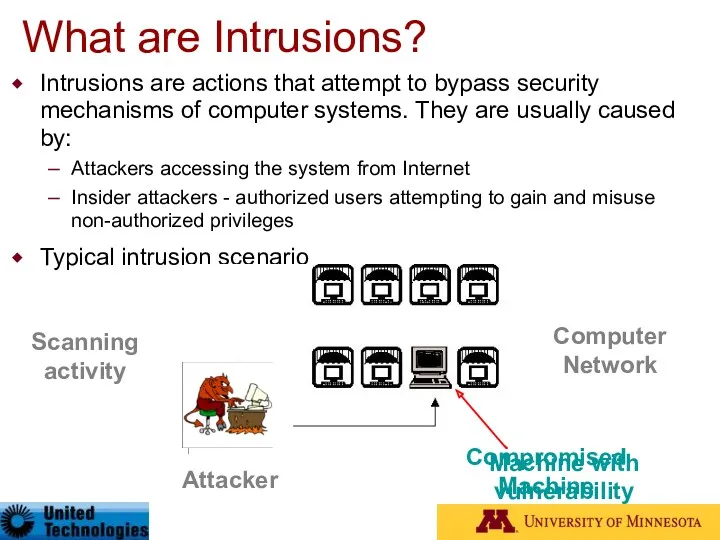
What are Intrusions?
Intrusions are actions that attempt to bypass security mechanisms
What are Intrusions?
Intrusions are actions that attempt to bypass security mechanisms
IDS - Analysis Strategy
Misuse detection is based on extensive knowledge of
IDS - Analysis Strategy
Misuse detection is based on extensive knowledge of
Intrusion Detection
www.snort.org
Intrusion Detection System
combination of software
and hardware that attempts
Intrusion Detection
www.snort.org
Intrusion Detection System
combination of software
and hardware that attempts
Data Mining for Intrusion Detection
Increased interest in data mining based intrusion
Data Mining for Intrusion Detection
Increased interest in data mining based intrusion
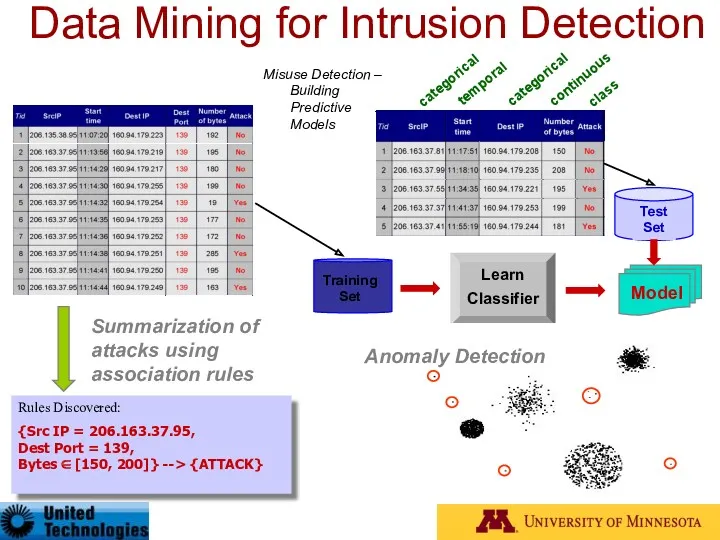
Data Mining for Intrusion Detection
Misuse Detection –
Building Predictive Models
categorical
temporal
continuous
class
Training
Set
Learn
Data Mining for Intrusion Detection
Misuse Detection –
Building Predictive Models
categorical
temporal
continuous
class
Training
Set
Learn
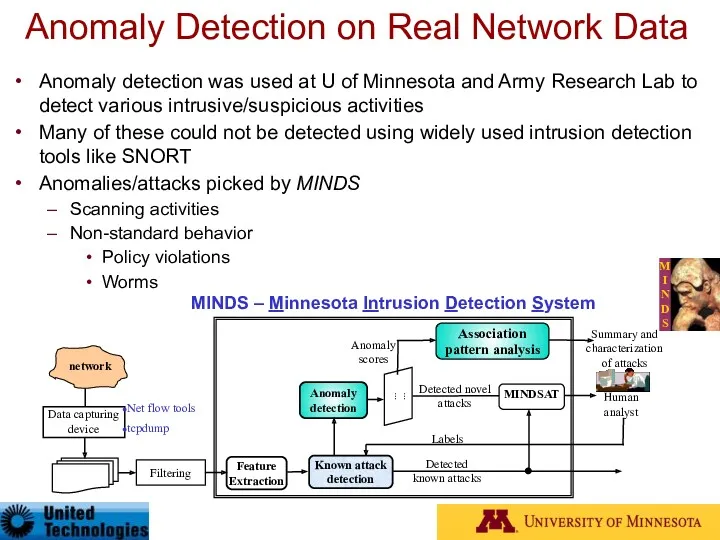
Anomaly Detection on Real Network Data
Anomaly detection was used at U
Anomaly Detection on Real Network Data
Anomaly detection was used at U
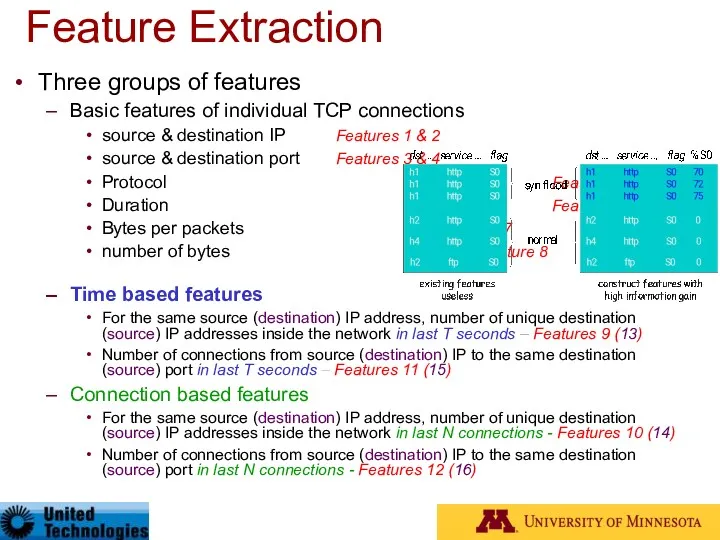
Three groups of features
Basic features of individual TCP connections
source & destination
Three groups of features
Basic features of individual TCP connections
source & destination
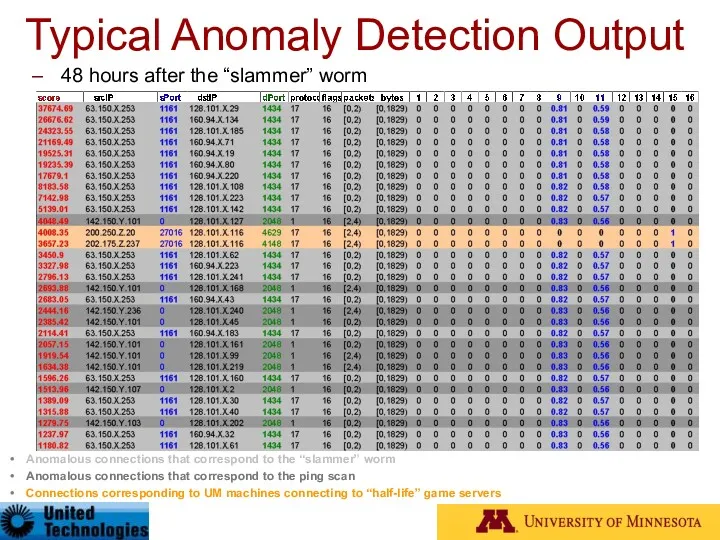
Typical Anomaly Detection Output
48 hours after the “slammer” worm
Anomalous connections
Typical Anomaly Detection Output
48 hours after the “slammer” worm
Anomalous connections
Detection of Anomalies on Real Network Data
Anomalies/attacks picked by MINDS include
Detection of Anomalies on Real Network Data
Anomalies/attacks picked by MINDS include
Conclusions
Anomaly detection can detect critical information in data
Highly applicable in various
Conclusions
Anomaly detection can detect critical information in data
Highly applicable in various
References
Ling, C., Li, C. Data mining for direct marketing: Problems and
References
Ling, C., Li, C. Data mining for direct marketing: Problems and
References
Lee, W. and Xiang, D. Information-theoretic measures for anomaly detection. In
References
Lee, W. and Xiang, D. Information-theoretic measures for anomaly detection. In
References
S. Hawkins, et al. Outlier detection using Replicator neural networks, DaWaK02
References
S. Hawkins, et al. Outlier detection using Replicator neural networks, DaWaK02
 Мобильные приложения. Шаблоны проектирования
 Трассировка. Цикл DO While. Лабораторная работа №4
 Введение в C#. Новый язык от Microsoft
 Компьютерные сети, Интернет и мультимедиа технологии. Основы сетей передачи данных
 The online gold shop
 Логические элементы
 Dota 2 — компьютерная многопользовательская командная игра
 DTP — собственный протокол компании Cisco
 Информационная система
 Базы данных
 Кібербулінг. Запобігання впливу шкідливої інформації
 Библиографическое описание. Правила составления. (Тема 6)
 Интерфейс мобильных приложений
 Что могут роботы
 CiGe Update firmware Using the tutorial
 Моя будущая профессия - разработчик игр
 Системы счисления
 Введение в поисковое продвижение
 Слой приложений
 Использование электронной почты для организации электронного документооборота
 Что такое UML
 Сортировка массивов. Основы программирования
 Введение в профессию. Понятия информации, сообщения и сигнала
 Multithreading (Java, C#, C++)
 Игра по информатике Умники и умницы
 Современные информационные технологии в дипломатии
 Адаптеры Ethernet и Fast Ethernet
 Работа с данными в Entity Framework Core. Проектирование и разработка веб-сервисов