- Architecture of integrated information systems (ARIS)

Содержание
- 2. ARIS ARCHITECTURE CONCEPT The Architecture of integrated Information Systems (ARIS) is based on an integration concept
- 3. ARIS ARCHITECTURE CONCEPT A second approach that also reduces complexity is a differentiation via descriptions. Following
- 4. ARIS DESCRIPTIVE VIEWS Product/Service view describes relationships between products/services. Function view contains the description of the
- 5. ARIS DESCRIPTIVE VIEWS Resource view provides general conditions for describing other components that are more directly
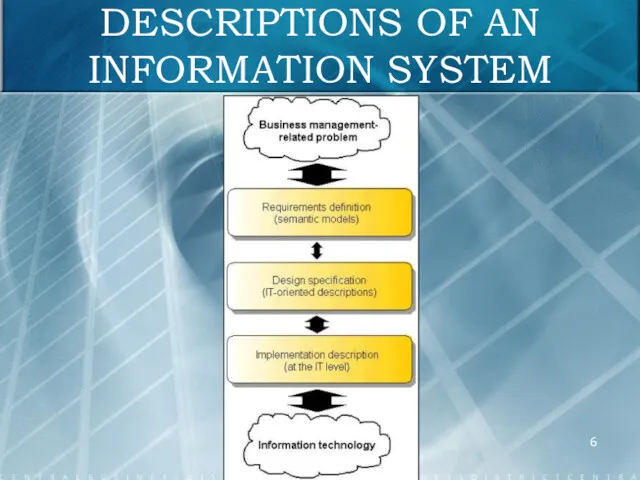
- 6. DESCRIPTIONS OF AN INFORMATION SYSTEM
- 7. DESCRIPTION OF THE BUSINESS MANAGEMENT PROBLEM Individual objects or areas of consideration are modeled within the
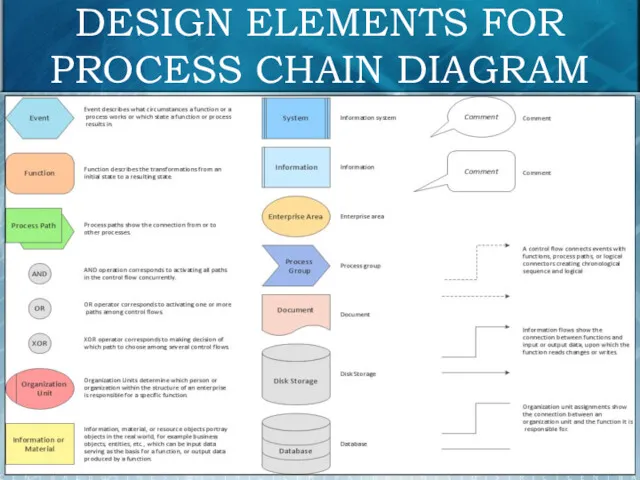
- 8. PROCESS CHAIN DIAGRAM (PCD) A process chain diagram represents a closed process chain. All views of
- 9. DESIGN ELEMENTS FOR PROCESS CHAIN DIAGRAM
- 10. PROCESS CHAIN DIAGRAM (EXAMPLE)
- 11. FUNCTION VIEW The ARIS architecture strictly separates the various areas of consideration. The function view covers
- 12. FUNCTION TREE Functions can be described at different aggregation levels. Accumulations of functions in the form
- 13. EXAMPLE OF THE FUNCTION TREE
- 14. GROUPING FUNCTIONS Grouping functions within a function tree can be performed according to different criteria: object-oriented
- 15. GROUPING FUNCTIONS (EXAMPLES)
- 16. DESIGN SPECIFICATION – APPLICATION SYSTEM TYPE DIAGRAM The design specification of the function view contains the
- 17. DESIGN SPECIFICATION – APPLICATION SYSTEM TYPE DIAGRAM Which lists can be created with an application system
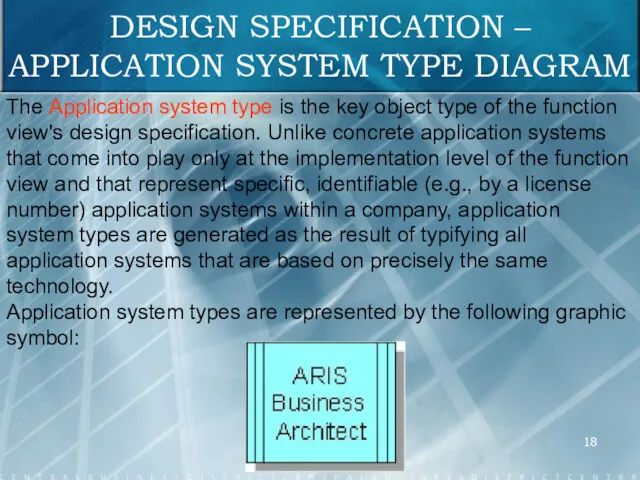
- 18. DESIGN SPECIFICATION – APPLICATION SYSTEM TYPE DIAGRAM The Application system type is the key object type
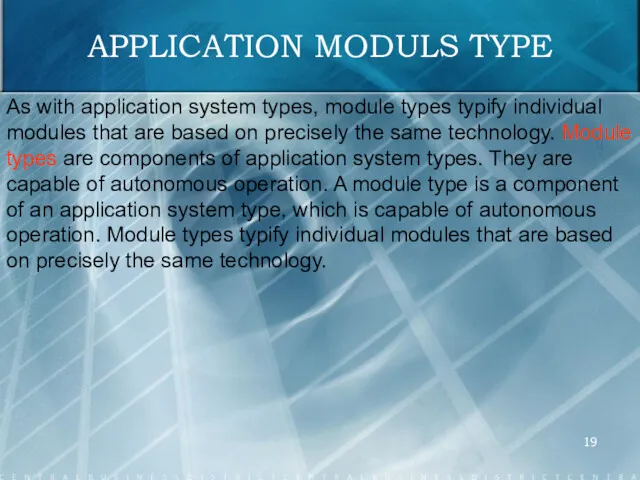
- 19. APPLICATION MODULS TYPE As with application system types, module types typify individual modules that are based
- 20. MODULAR STRUCTURE OF AN APPLICATION SYSTEM TYPE
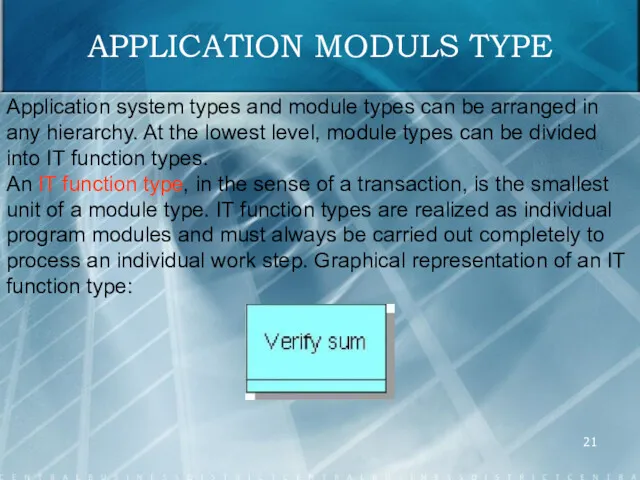
- 21. APPLICATION MODULS TYPE Application system types and module types can be arranged in any hierarchy. At
- 22. ALLOCATION OF FUNCTIONS TO APPLICATION SYSTEM TYPES The application system type diagram is also a means
- 23. APPLICATION SYSTEM TYPE CONFIGURATION To obtain a more detailed specification of the technology that application system
- 24. SCREEN AND LIST ASSIGNMENTS Processing a technical function with the support of an application system involves
- 25. IMPLEMENTATION – APPLICATION SYSTEM TYPE DIAGRAM In the application system type diagram can be assigned specific
- 26. ASSIGNMENT OF APPLICATION SYSTEMS TO THEIR APPLICATION SYSTEM TYPES
- 27. DIFFERENT MODULAR STRUCTURE OF TWO APPLICATION SYSTEMS OF THE SAME TYPE
- 28. ASSIGNMENT OF APPLICATION SYSTEM TYPES, PROGRAM MODULE TYPES, AND PROGRAM MODULES
- 29. DATA VIEW The requirements definition of the data view includes a description of the semantic data
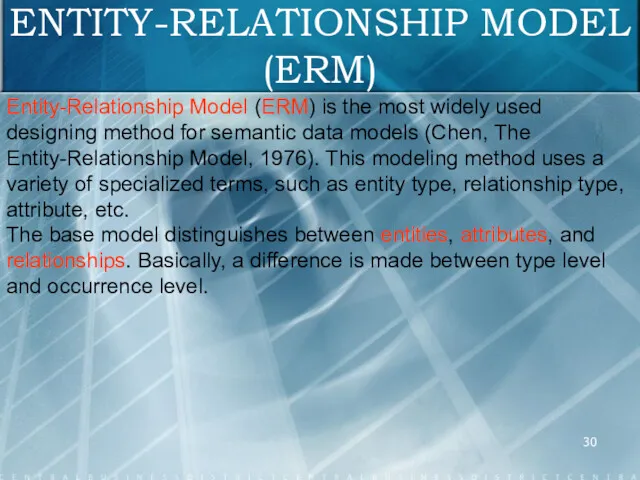
- 30. ENTITY-RELATIONSHIP MODEL (ERM) Entity-Relationship Model (ERM) is the most widely used designing method for semantic data
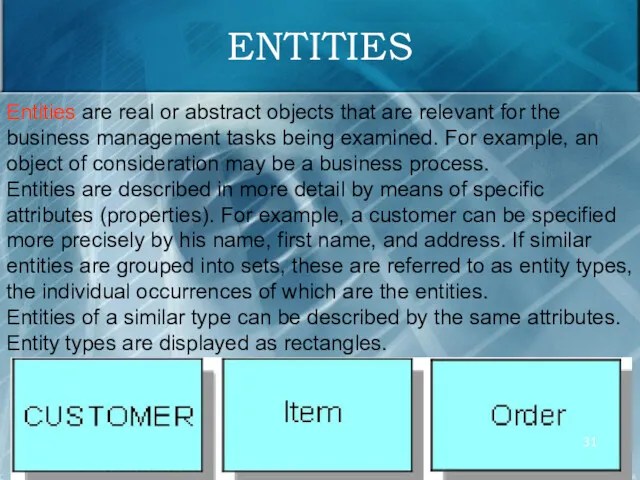
- 31. ENTITIES Entities are real or abstract objects that are relevant for the business management tasks being
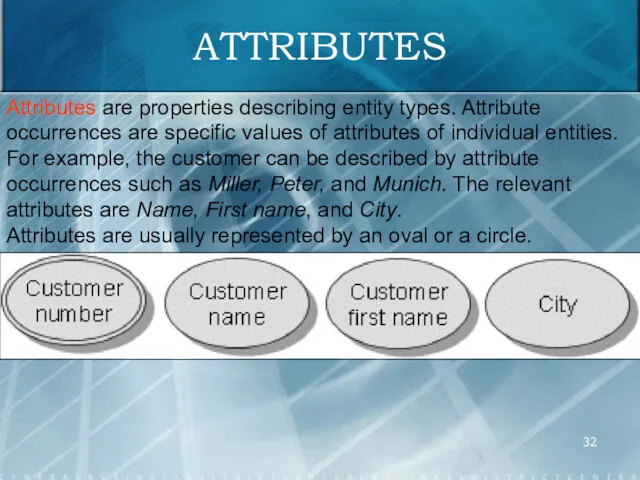
- 32. ATTRIBUTES Attributes are properties describing entity types. Attribute occurrences are specific values of attributes of individual
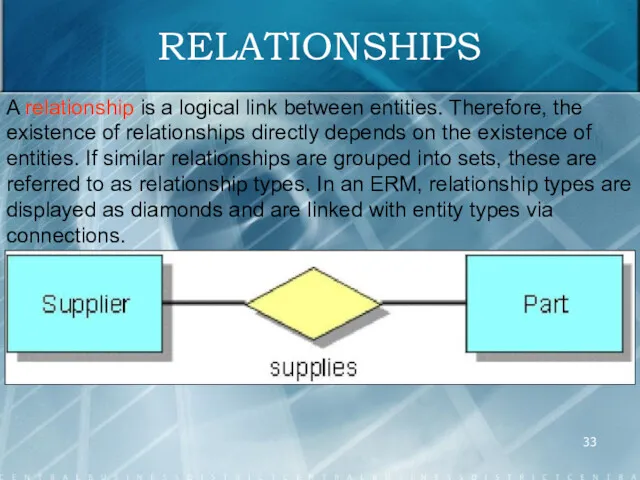
- 33. RELATIONSHIPS A relationship is a logical link between entities. Therefore, the existence of relationships directly depends
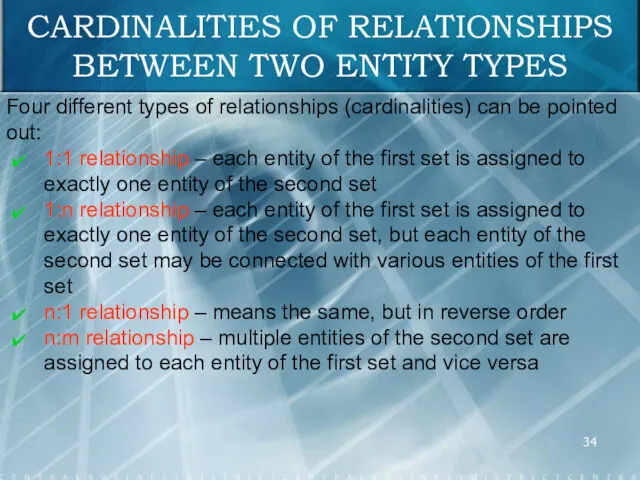
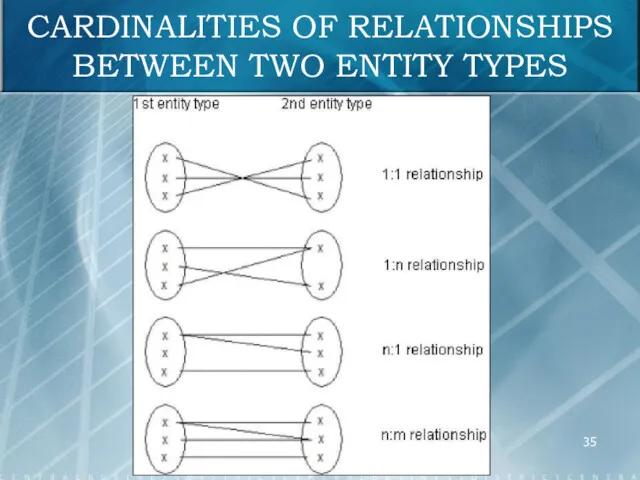
- 34. CARDINALITIES OF RELATIONSHIPS BETWEEN TWO ENTITY TYPES Four different types of relationships (cardinalities) can be pointed
- 35. CARDINALITIES OF RELATIONSHIPS BETWEEN TWO ENTITY TYPES
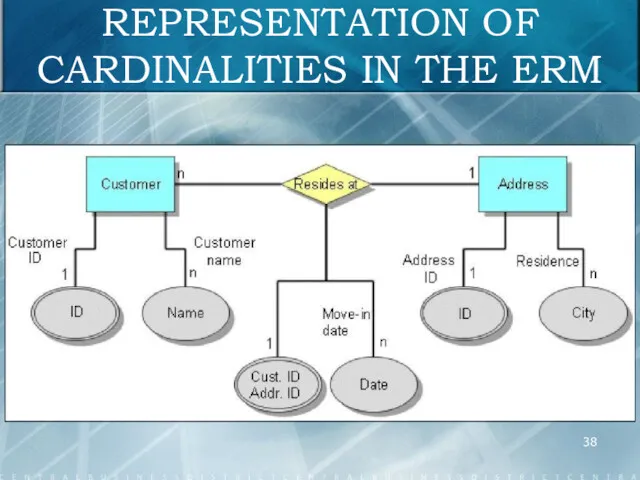
- 36. REPRESENTATION OF CARDINALITIES IN THE ERM
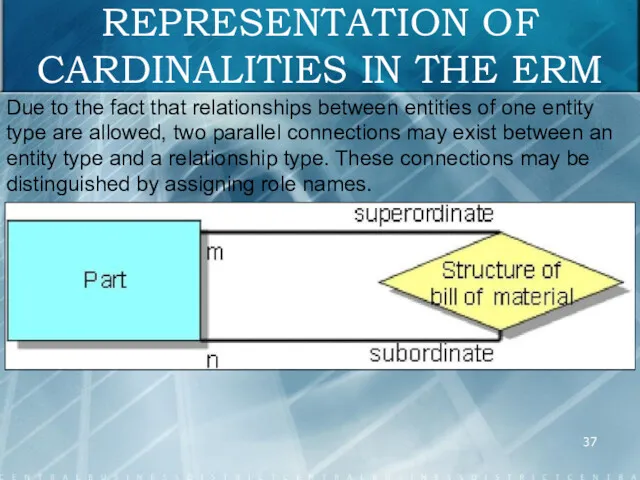
- 37. REPRESENTATION OF CARDINALITIES IN THE ERM Due to the fact that relationships between entities of one
- 38. REPRESENTATION OF CARDINALITIES IN THE ERM
- 39. eERM EXTENSIONS For extending ERM modeling, four basic design operators have become accepted: Classification Generalization Aggregation
- 40. CLASSIFICATION Through classification, objects (entities) of the same type are identified and assigned to a term
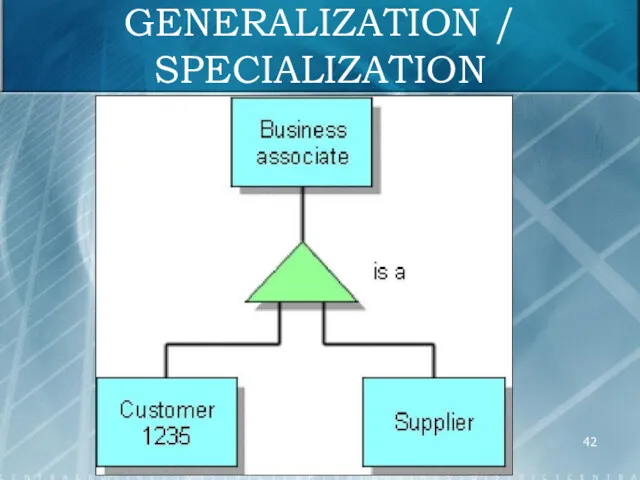
- 41. GENERALIZATION / SPECIALIZATION Generalization means that similar object types are grouped under a superior object type.
- 42. GENERALIZATION / SPECIALIZATION
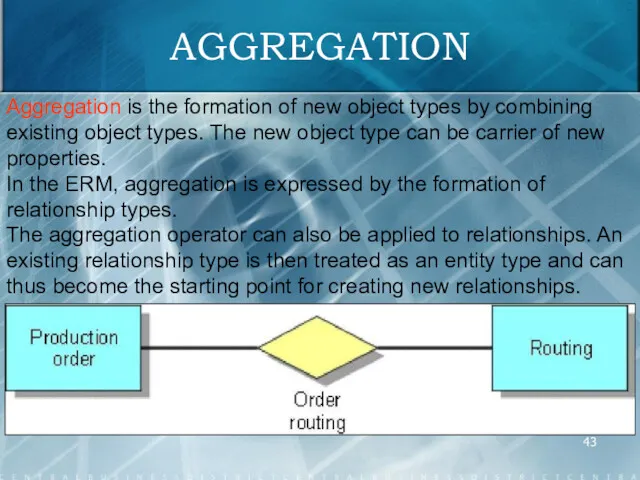
- 43. AGGREGATION Aggregation is the formation of new object types by combining existing object types. The new
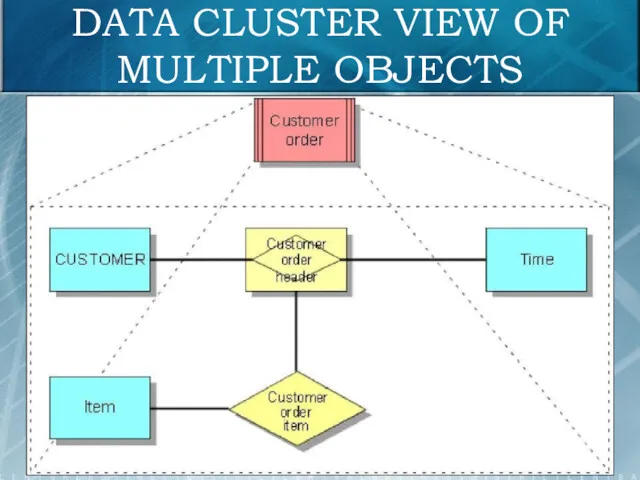
- 44. DATA CLUSTER In an ERM, a complex structural context is split into a transparent structure. As
- 45. DATA CLUSTER VIEW OF MULTIPLE OBJECTS
- 46. GROUPING Grouping forms groups from the elements of an entity set. For example, all Operating resources
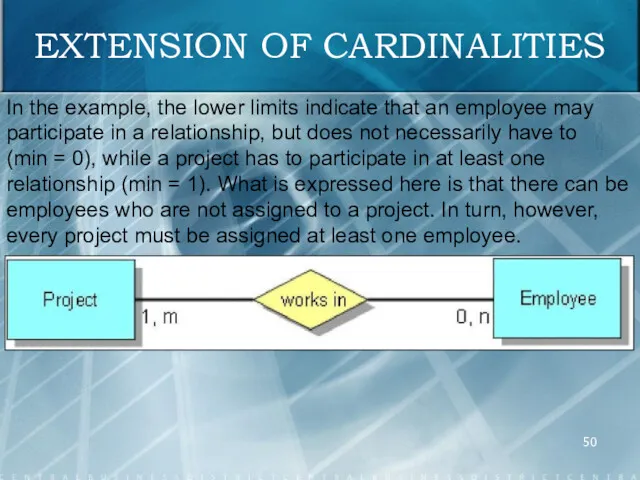
- 47. EXTENSION OF CARDINALITIES When specifying cardinalities, so far only the upper limit for the admitted number
- 48. EXTENSION OF CARDINALITIES The upper limit, the lower limit specifying the minimum number of relationship occurrences
- 49. EXTENSION OF CARDINALITIES Every relationship is defined by two degrees of complexity (minimum, maximum). The lower
- 50. EXTENSION OF CARDINALITIES In the example, the lower limits indicate that an employee may participate in
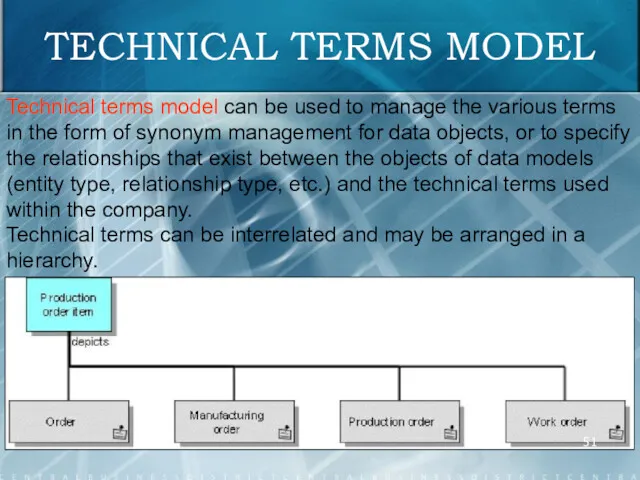
- 51. TECHNICAL TERMS MODEL Technical terms model can be used to manage the various terms in the
- 52. TECHNICAL TERMS MODEL
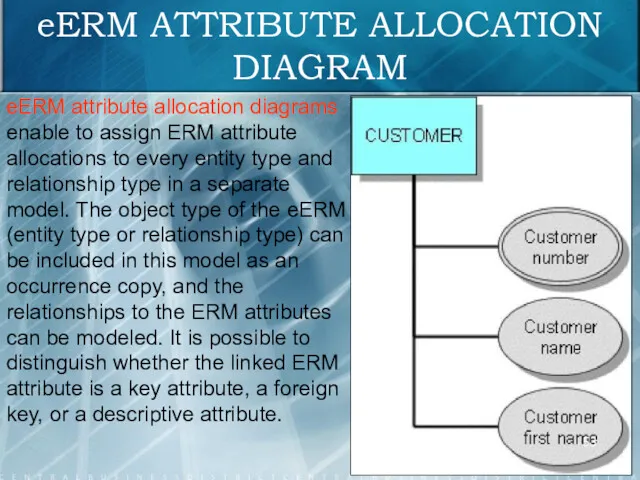
- 53. eERM ATTRIBUTE ALLOCATION DIAGRAM eERM attribute allocation diagrams enable to assign ERM attribute allocations to every
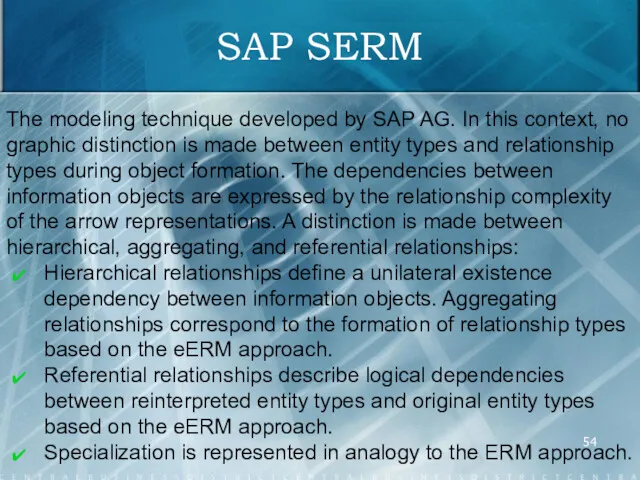
- 54. SAP SERM The modeling technique developed by SAP AG. In this context, no graphic distinction is
- 55. eERM and SAP SERM REPRESENTATION
- 56. eERM: TERMS AND FORMS REPRESENTATION
- 57. eERM: TERMS AND FORMS REPRESENTATION
- 58. DOCUMENT TYPE DEFINITION A model of the DTD (Document Type Definition) type describes the rules according
- 59. MATERIAL FLOW MODELING – MATERIAL DIAGRAM To illustrate the material flow in process models material types
- 60. MATERIAL FLOW MODELING – MATERIAL DIAGRAM Packaging material types can also be arranged in hierarchies and
- 61. EXAMPLE OF A MATERIAL DIAGRAM
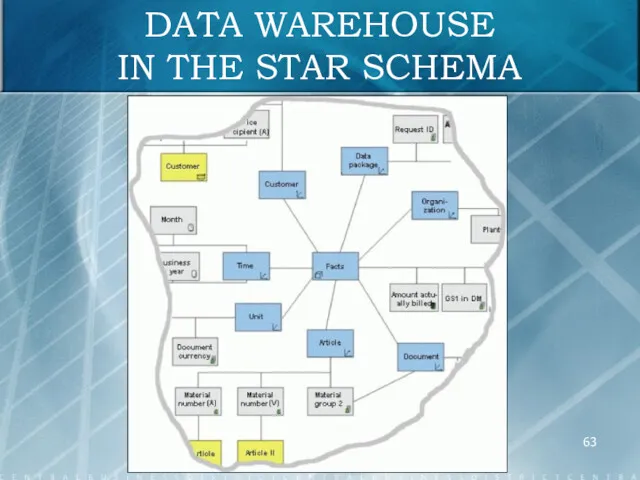
- 62. MODELING THE DATA WAREHOUSE STRUCTURE The Data Warehouse structure diagram describes the structure of a Data
- 63. DATA WAREHOUSE IN THE STAR SCHEMA
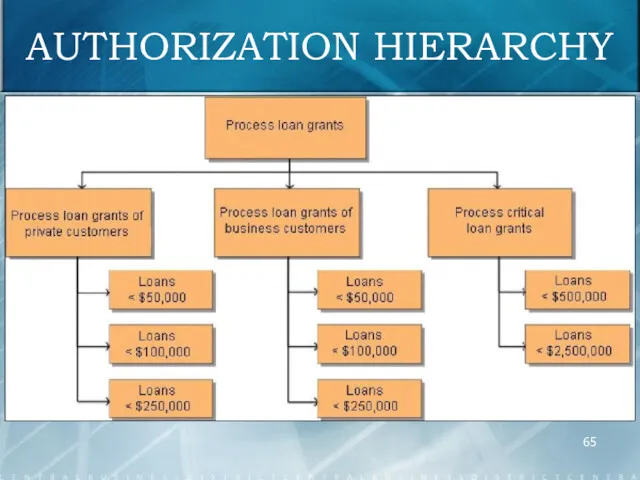
- 64. AUTHORIZATION HIERARCHY The authorization hierarchy diagram is used in role modeling and organizational modeling. It illustrates
- 65. AUTHORIZATION HIERARCHY
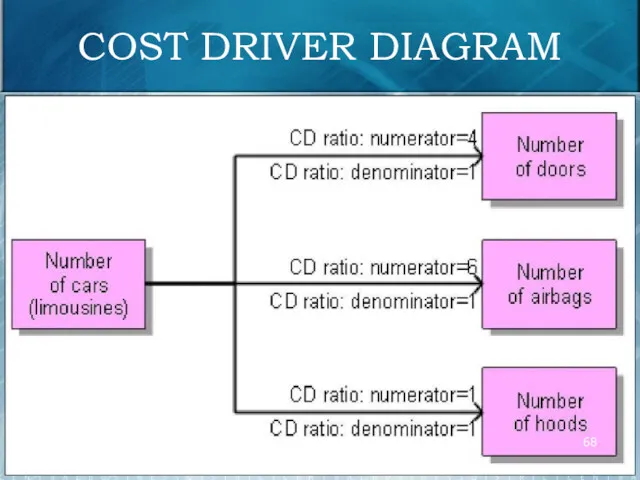
- 66. COST DRIVER DIAGRAM The CD diagram (cost driver diagram) is used in process cost management (e.
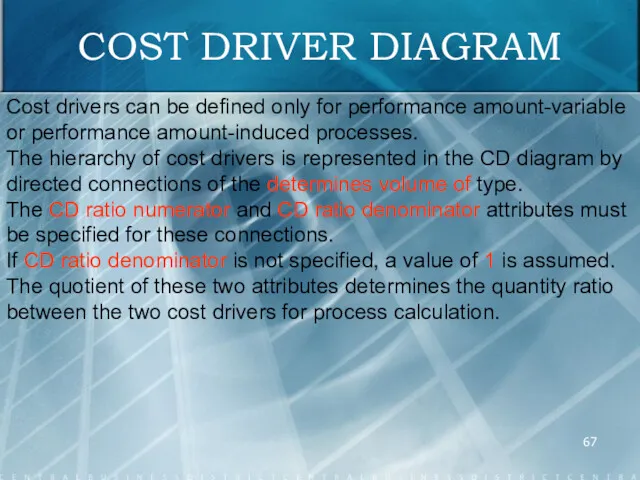
- 67. COST DRIVER DIAGRAM Cost drivers can be defined only for performance amount-variable or performance amount-induced processes.
- 68. COST DRIVER DIAGRAM
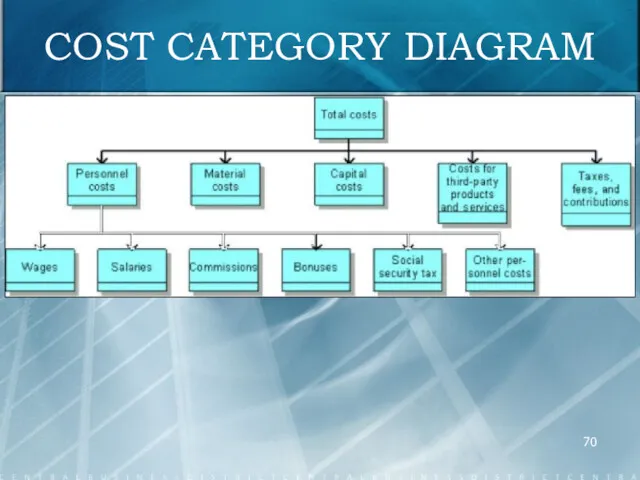
- 69. COST CATEGORY DIAGRAM The cost category diagram is used in process cost management, e.g., with ARIS
- 70. COST CATEGORY DIAGRAM
- 71. RELATIONS DIAGRAM In the design specification, the logical data structures designed in the requirements definition are
- 72. RELATIONS DIAGRAM In a first step, the required relations are defined in the relations diagram. A
- 73. RELATIONS DIAGRAM In a second step, the relations diagram can indicate for each relation which entity
- 74. ALLOCATION OF THE REQUIREMENTS DEFINITION ATTRIBUTES AND DATA OBJECTS
- 75. ATTRIBUTE ALLOCATION DIAGRAM To reduce representation complexity, the attributes of every relation can be defined in
- 76. LOGICAL VIEW OF MULTIPLE RELATIONS The data clusters of the requirements definition are realized in the
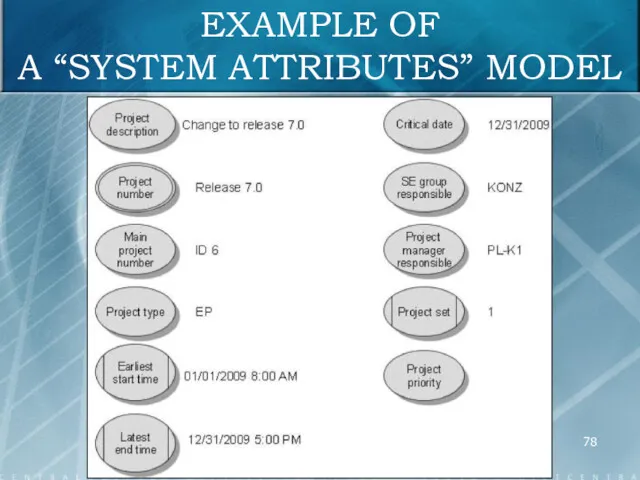
- 77. SYSTEM ATTRIBUTES MODEL The System attributes model type is primarily designed to perform data export-oriented tasks
- 78. EXAMPLE OF A “SYSTEM ATTRIBUTES” MODEL
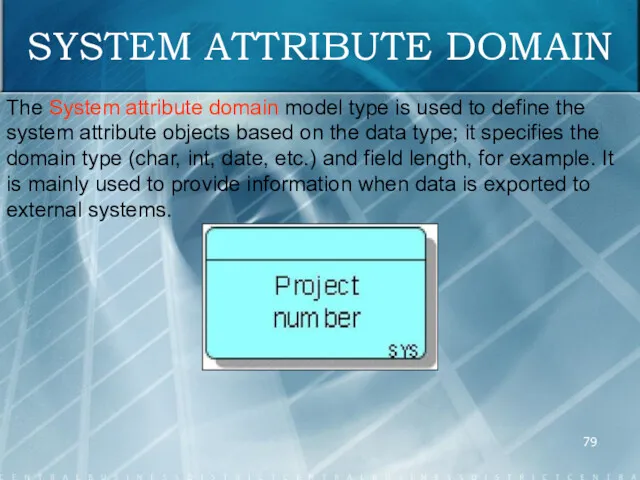
- 79. SYSTEM ATTRIBUTE DOMAIN The System attribute domain model type is used to define the system attribute
- 80. TABLE DIAGRAM The table diagram is used to describe the tables and fields of a database
- 81. FIELD ALLOCATIONS
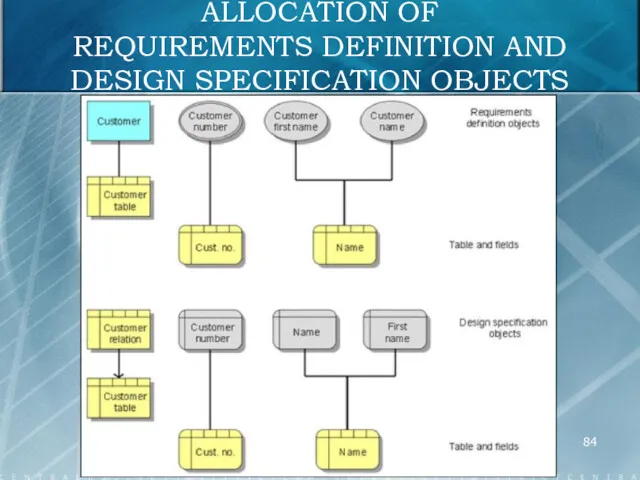
- 82. ALLOCATION OF REQUIREMENTS DEFINITION AND DESIGN SPECIFICATION OBJECTS As relations of a relations diagram are not
- 83. Due to the fact that converting or documenting database tables and fields used in a company
- 84. ALLOCATION OF REQUIREMENTS DEFINITION AND DESIGN SPECIFICATION OBJECTS
- 85. To be able to define the exact location of specific tables and fields in a company,
- 86. TABLE SPECIMENS
- 87. Companies are complex social structures that are divided into manageable units. To deal with the given
- 88. The design of an ideal company organization with the aim of reducing coordination efforts to a
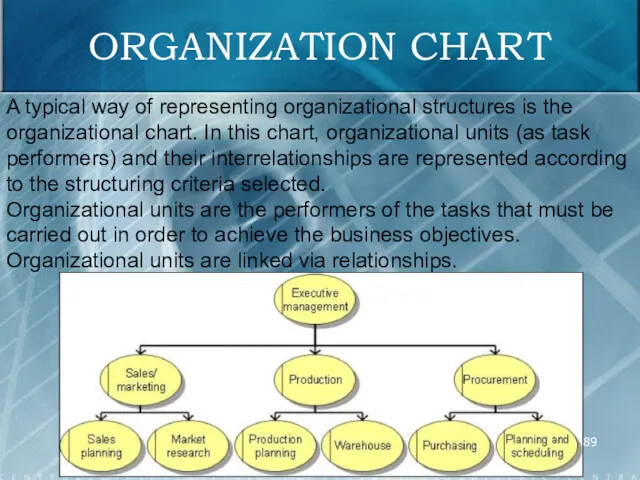
- 89. A typical way of representing organizational structures is the organizational chart. In this chart, organizational units
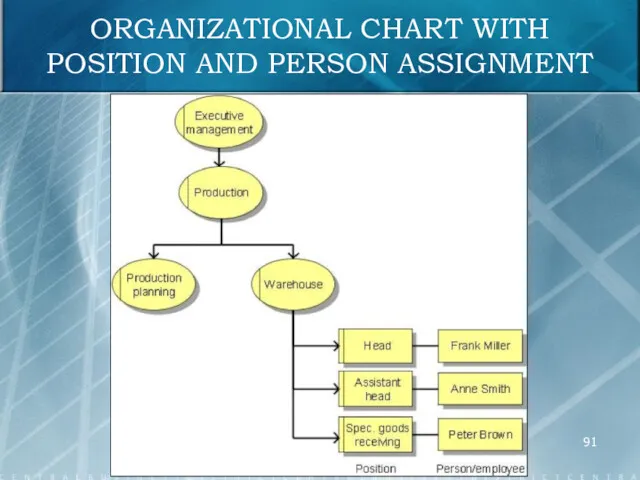
- 90. The Position object type is provided to represent individual positions within the company, for example, positions
- 91. ORGANIZATIONAL CHART WITH POSITION AND PERSON ASSIGNMENT
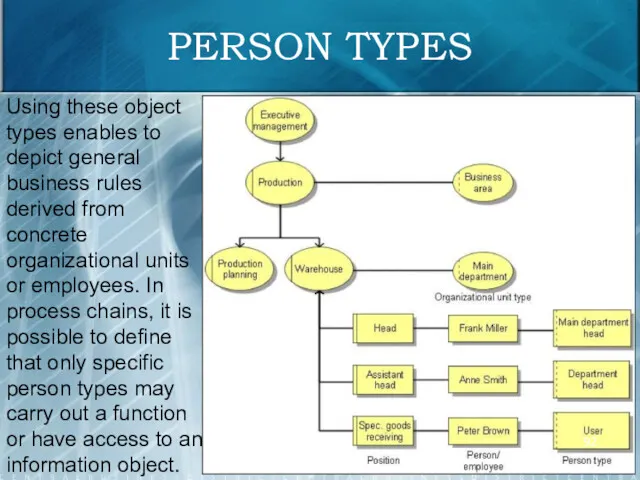
- 92. PERSON TYPES Using these object types enables to depict general business rules derived from concrete organizational
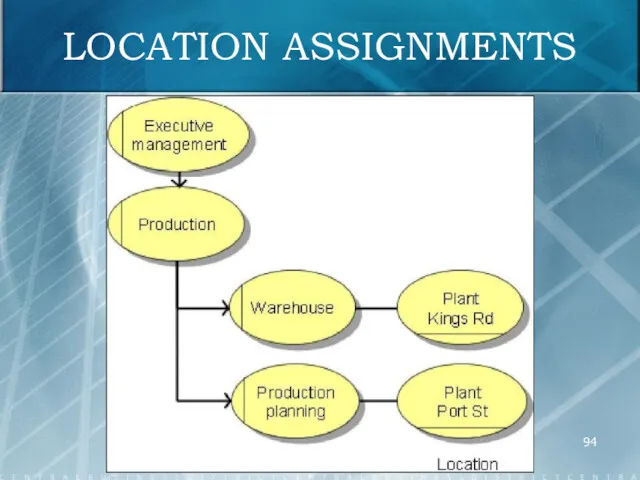
- 93. LOCATION ASSIGNMENTS The modeling of the organizational structure of the company is the starting point for
- 94. LOCATION ASSIGNMENTS
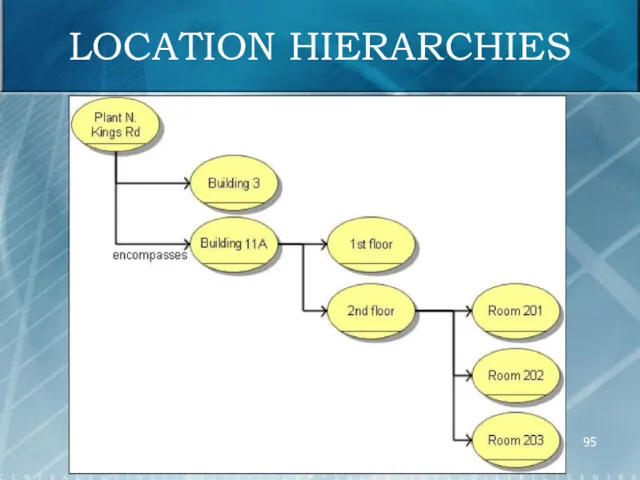
- 95. LOCATION HIERARCHIES
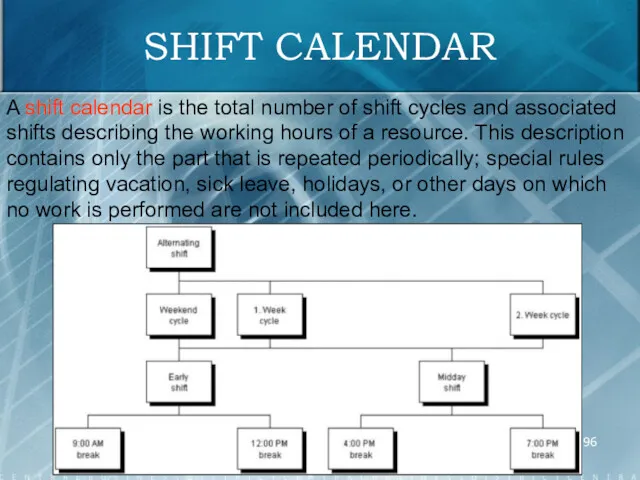
- 96. SHIFT CALENDAR A shift calendar is the total number of shift cycles and associated shifts describing
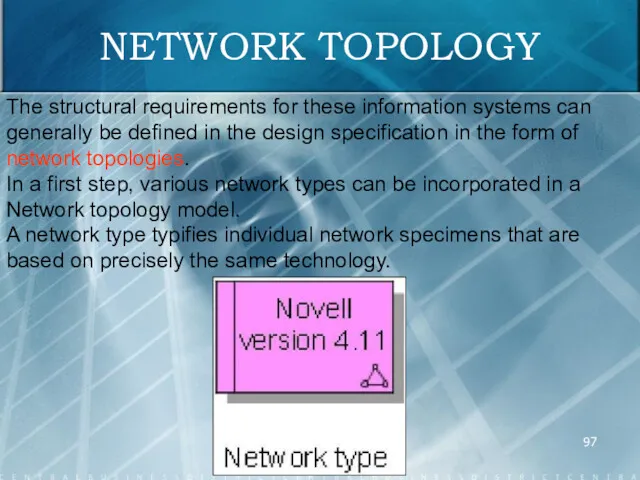
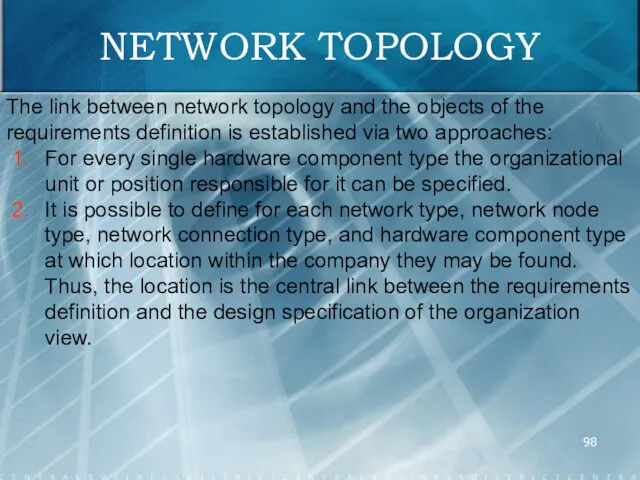
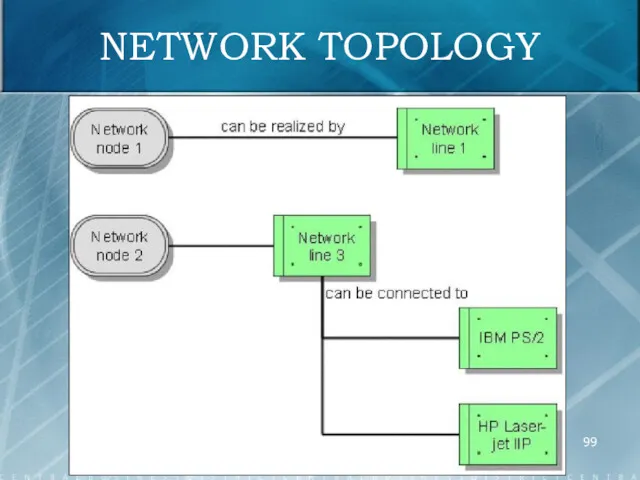
- 97. NETWORK TOPOLOGY The structural requirements for these information systems can generally be defined in the design
- 98. NETWORK TOPOLOGY The link between network topology and the objects of the requirements definition is established
- 99. NETWORK TOPOLOGY
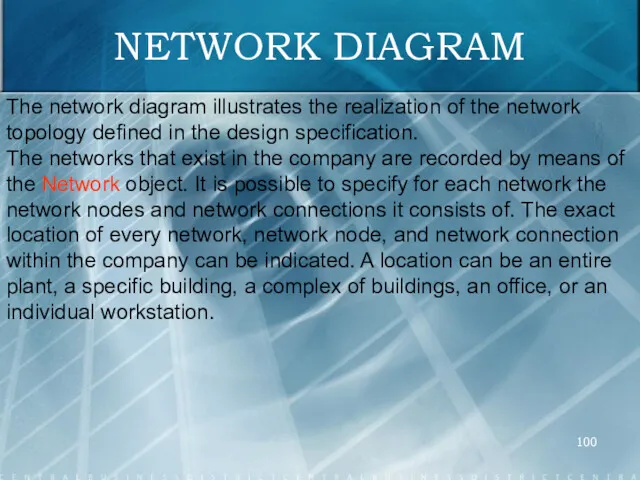
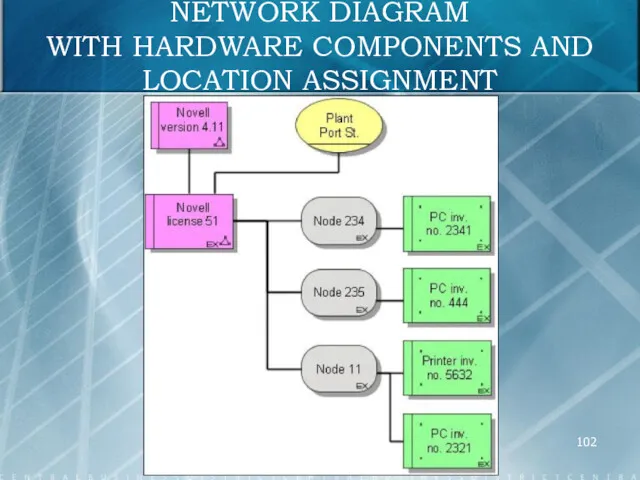
- 100. NETWORK DIAGRAM The network diagram illustrates the realization of the network topology defined in the design
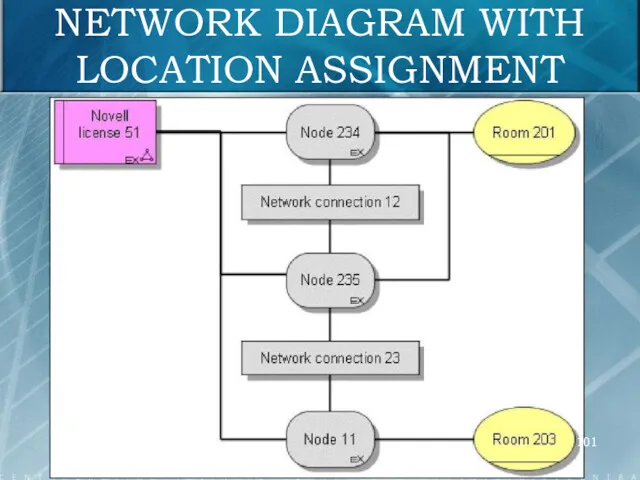
- 101. NETWORK DIAGRAM WITH LOCATION ASSIGNMENT
- 102. NETWORK DIAGRAM WITH HARDWARE COMPONENTS AND LOCATION ASSIGNMENT
- 103. MATERIAL FLOW MODELING – TECHNICAL RESOURCES To illustrate the material flow in process models material types
- 104. MATERIAL FLOW MODELING – TECHNICAL RESOURCES In the Technical resources model type you can arrange technical
- 105. MATERIAL FLOW MODELING – TECHNICAL RESOURCES Operating resource class. Similar operating resource types can be combined
- 106. MATERIAL FLOW MODELING – TECHNICAL RESOURCES Warehouse equipment class. Similar warehouse equipment types can be combined
- 107. MATERIAL FLOW MODELING – TECHNICAL RESOURCES Technical operating supply class. Similar technical operating supply types can
- 108. MATERIAL FLOW MODELING – TECHNICAL RESOURCES Transport system class. Similar transport system types can be combined
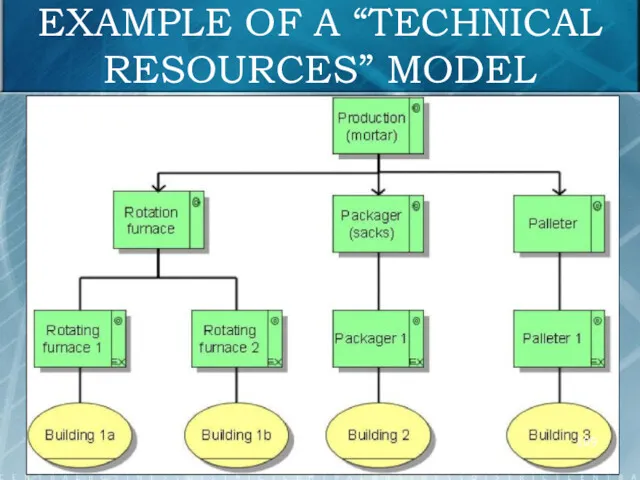
- 109. EXAMPLE OF A “TECHNICAL RESOURCES” MODEL
- 110. PROCESS VIEW / CONTROL VIEW The relationships between the objects of the data, organization, and function
- 111. LINKING FUNCTIONS WITH ORGANIZATION Linking the function view with the organization view serves to allocate the
- 112. ALLOCATION OF ORGANIZATIONAL ELEMENTS TO FUNCTIONS
- 113. EVENT-DRIVEN PROCESS CHAIN (EPC) Linking the function view with the organization view serves to allocate the
- 114. EVENTS The operational sequence of functions in the sense of business processes is represented in process
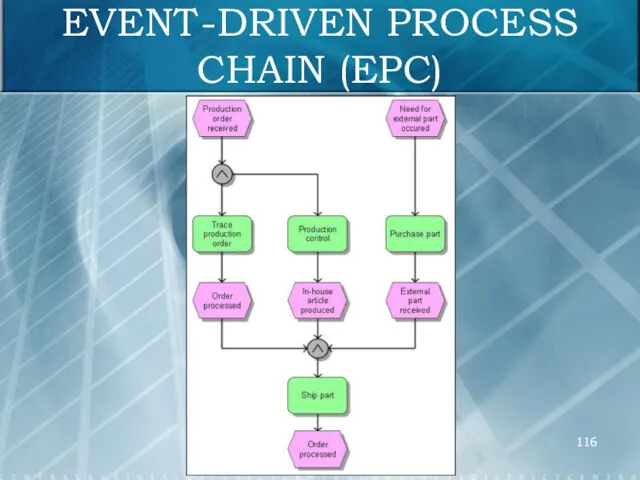
- 115. EVENT-DRIVEN PROCESS CHAIN (EPC) Events trigger functions and are the results of functions. By arranging events
- 116. EVENT-DRIVEN PROCESS CHAIN (EPC)
- 117. LOGIC OPERATORS (RULES)
- 118. LOGIC OPERATORS (RULES)
- 119. AND OPERATOR FOR TRIGGERING EVENTS The function can be started only after all events have occurred.
- 120. OR OPERATOR FOR TRIGGERING EVENTS The function is carried out after at least one of the
- 121. EXLUSIVE OR (XOR) OPERATOR FOR TRIGGERING EVENTS The function is started after no more than exactly
- 122. AND OPERATOR FOR CREATED EVENTS All events will occur after function execution is complete.
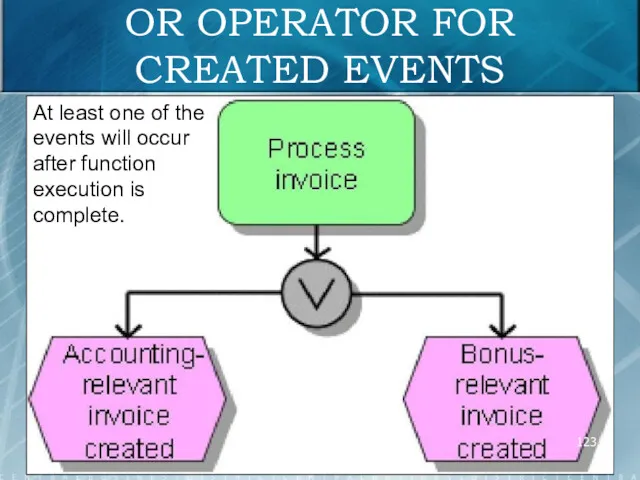
- 123. OR OPERATOR FOR CREATED EVENTS At least one of the events will occur after function execution
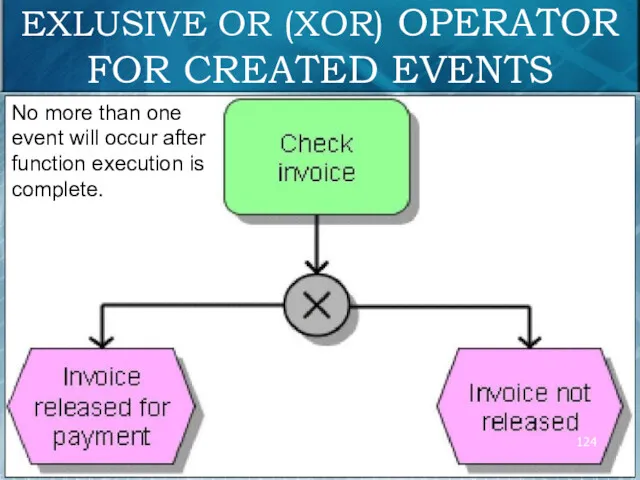
- 124. EXLUSIVE OR (XOR) OPERATOR FOR CREATED EVENTS No more than one event will occur after function
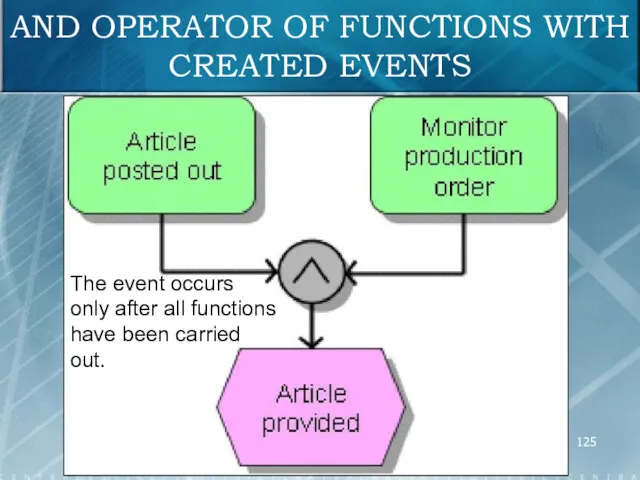
- 125. AND OPERATOR OF FUNCTIONS WITH CREATED EVENTS The event occurs only after all functions have been
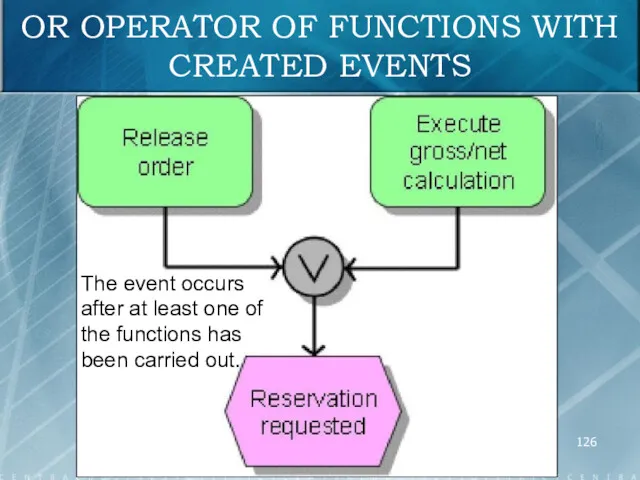
- 126. OR OPERATOR OF FUNCTIONS WITH CREATED EVENTS The event occurs after at least one of the
- 127. EXLUSIVE OR (XOR) OPERATOR OF FUNCTIONS WITH CREATED EVENTS The event occurs after no more than
- 128. AND OPERATOR OF FUNCTIONS WITH TRIGGERING EVENTS The event triggers all functions. OR & Exclusive OR
- 129. FUNCTION ALLOCATION DIAGRAM (I/O) In addition to the event control representation the transformation of input data
- 130. EXAMPLE OF FUNCTION ALLOCATION DIAGRAM (I/O)
- 131. FUNCTION ALLOCATION DIAGRAM (I/O) Besides a function's input/output data, events and all other objects that can
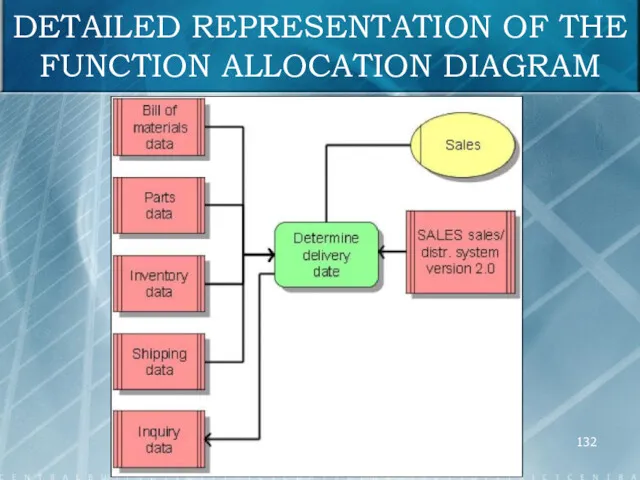
- 132. DETAILED REPRESENTATION OF THE FUNCTION ALLOCATION DIAGRAM
- 133. EPC WITH INPUT/OUTPUT DATA Besides this method of representing data transformation in the form of function
- 134. EPC WITH INPUT/OUTPUT DATA
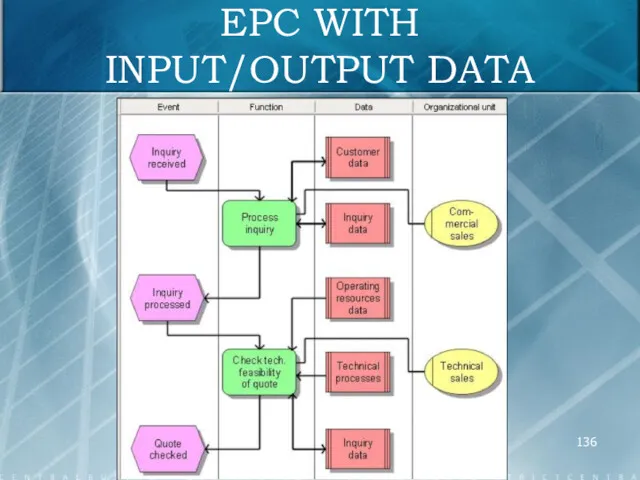
- 135. EPC WITH INPUT/OUTPUT DATA In the PCD (process chain diagram), objects have to be arranged according
- 136. EPC WITH INPUT/OUTPUT DATA
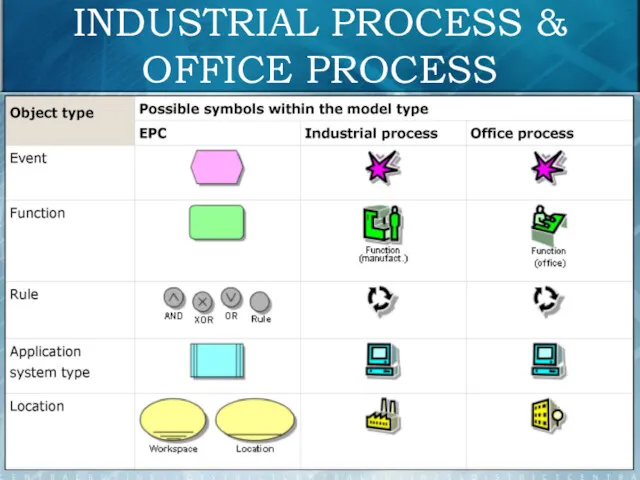
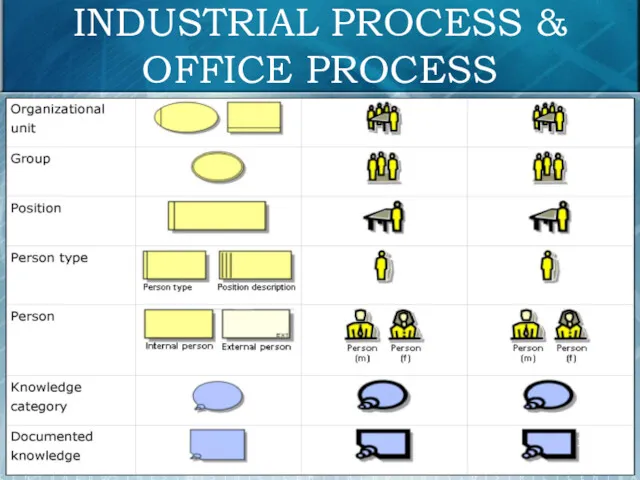
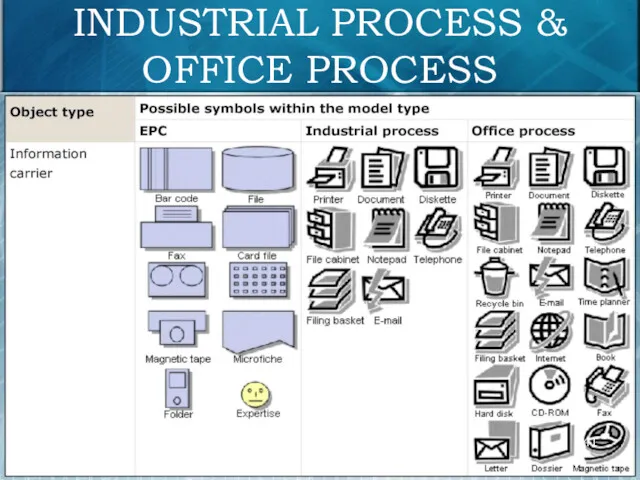
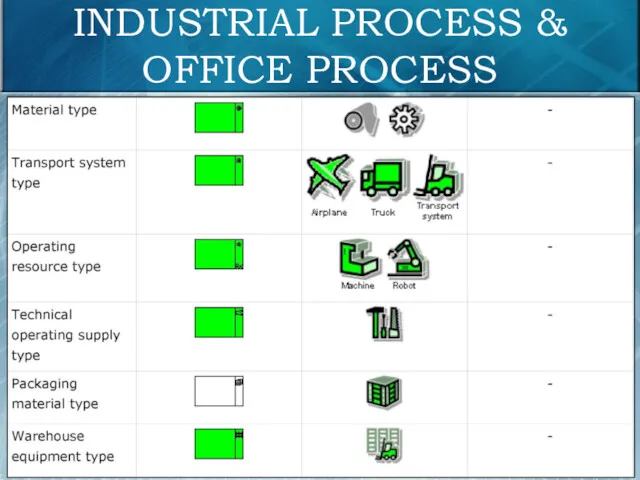
- 137. INDUSTRIAL PROCESS & OFFICE PROCESS The Industrial process and Office process model types essentially represent the
- 138. INDUSTRIAL PROCESS & OFFICE PROCESS To maximize the identification with symbols, two process types (model types)
- 139. INDUSTRIAL PROCESS & OFFICE PROCESS
- 140. INDUSTRIAL PROCESS & OFFICE PROCESS
- 141. INDUSTRIAL PROCESS & OFFICE PROCESS
- 142. INDUSTRIAL PROCESS & OFFICE PROCESS
- 144. Скачать презентацию
ARIS
ARCHITECTURE CONCEPT
The Architecture of integrated Information Systems (ARIS) is based on
ARIS
ARCHITECTURE CONCEPT
The Architecture of integrated Information Systems (ARIS) is based on
ARIS
ARCHITECTURE CONCEPT
A second approach that also reduces complexity is a differentiation
ARIS
ARCHITECTURE CONCEPT
A second approach that also reduces complexity is a differentiation
ARIS DESCRIPTIVE VIEWS
Product/Service view describes relationships between products/services.
Function view contains the
ARIS DESCRIPTIVE VIEWS
Product/Service view describes relationships between products/services.
Function view contains the
ARIS DESCRIPTIVE VIEWS
Resource view provides general conditions for describing other components
ARIS DESCRIPTIVE VIEWS
Resource view provides general conditions for describing other components
DESCRIPTIONS OF AN INFORMATION SYSTEM
DESCRIPTIONS OF AN INFORMATION SYSTEM
DESCRIPTION OF THE BUSINESS MANAGEMENT PROBLEM
Individual objects or areas of consideration
DESCRIPTION OF THE BUSINESS MANAGEMENT PROBLEM
Individual objects or areas of consideration
PROCESS CHAIN DIAGRAM (PCD)
A process chain diagram represents a closed process
PROCESS CHAIN DIAGRAM (PCD)
A process chain diagram represents a closed process
DESIGN ELEMENTS FOR PROCESS CHAIN DIAGRAM
DESIGN ELEMENTS FOR PROCESS CHAIN DIAGRAM
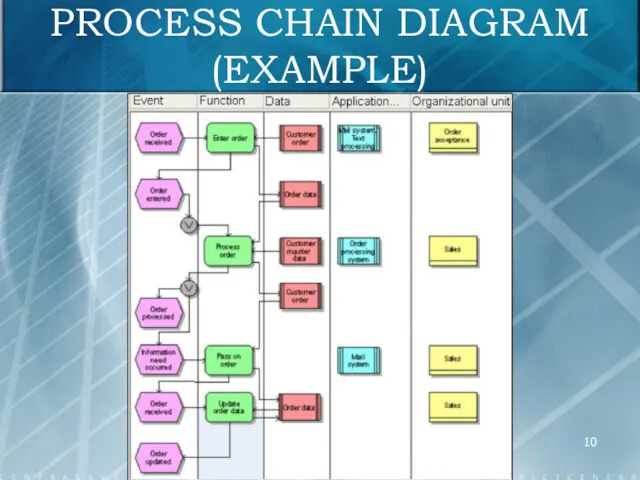
PROCESS CHAIN DIAGRAM (EXAMPLE)
PROCESS CHAIN DIAGRAM (EXAMPLE)
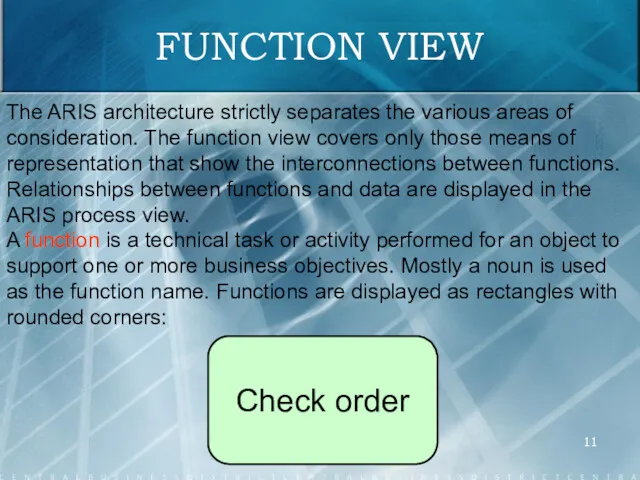
FUNCTION VIEW
The ARIS architecture strictly separates the various areas of consideration.
FUNCTION VIEW
The ARIS architecture strictly separates the various areas of consideration.
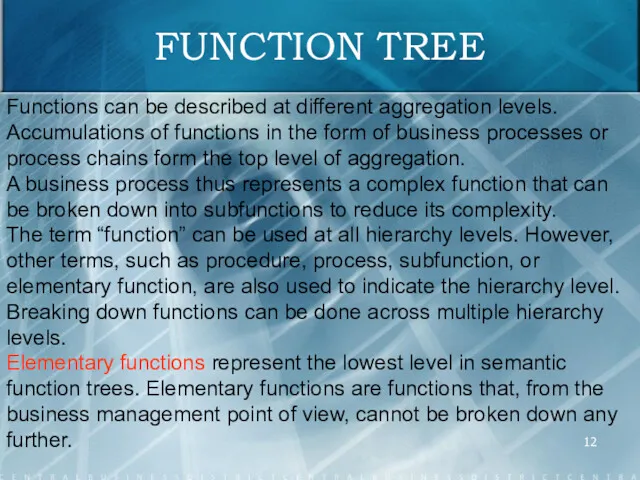
FUNCTION TREE
Functions can be described at different aggregation levels. Accumulations of
FUNCTION TREE
Functions can be described at different aggregation levels. Accumulations of
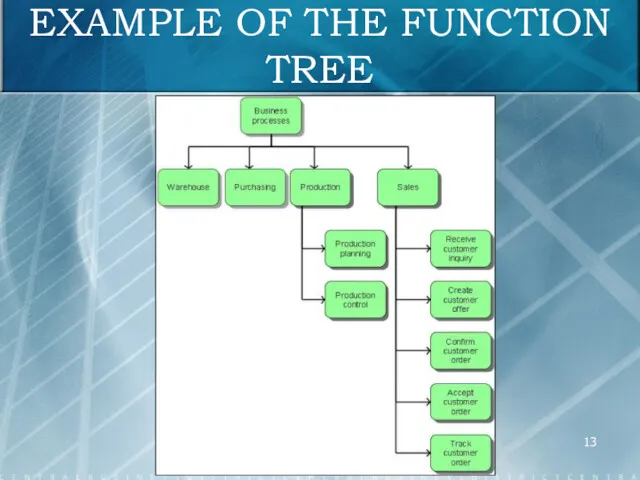
EXAMPLE OF THE FUNCTION TREE
EXAMPLE OF THE FUNCTION TREE
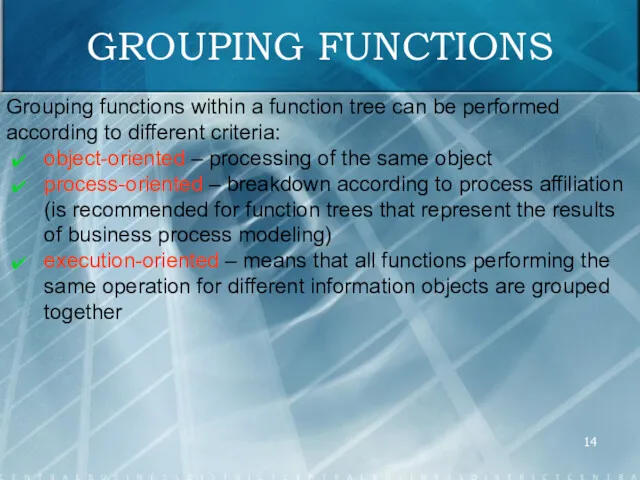
GROUPING FUNCTIONS
Grouping functions within a function tree can be performed according
GROUPING FUNCTIONS
Grouping functions within a function tree can be performed according
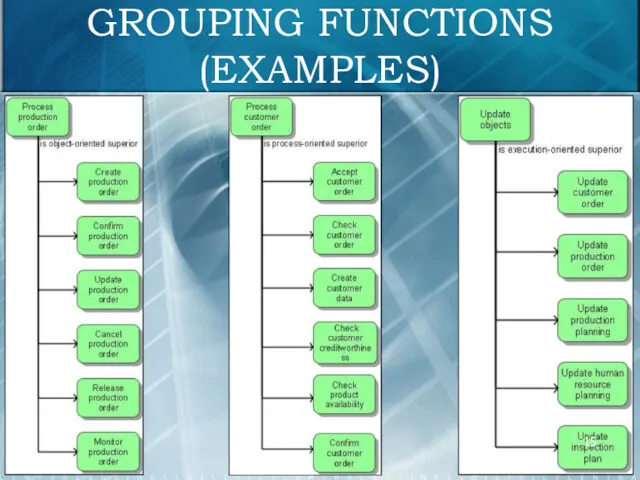
GROUPING FUNCTIONS
(EXAMPLES)
GROUPING FUNCTIONS
(EXAMPLES)
DESIGN SPECIFICATION – APPLICATION SYSTEM TYPE DIAGRAM
The design specification of the
DESIGN SPECIFICATION – APPLICATION SYSTEM TYPE DIAGRAM
The design specification of the
DESIGN SPECIFICATION – APPLICATION SYSTEM TYPE DIAGRAM
Which lists can be created
DESIGN SPECIFICATION – APPLICATION SYSTEM TYPE DIAGRAM
Which lists can be created
DESIGN SPECIFICATION – APPLICATION SYSTEM TYPE DIAGRAM
The Application system type is
DESIGN SPECIFICATION – APPLICATION SYSTEM TYPE DIAGRAM
The Application system type is
APPLICATION MODULS TYPE
As with application system types, module types typify individual
APPLICATION MODULS TYPE
As with application system types, module types typify individual
MODULAR STRUCTURE OF
AN APPLICATION SYSTEM TYPE
MODULAR STRUCTURE OF
AN APPLICATION SYSTEM TYPE
APPLICATION MODULS TYPE
Application system types and module types can be arranged
APPLICATION MODULS TYPE
Application system types and module types can be arranged
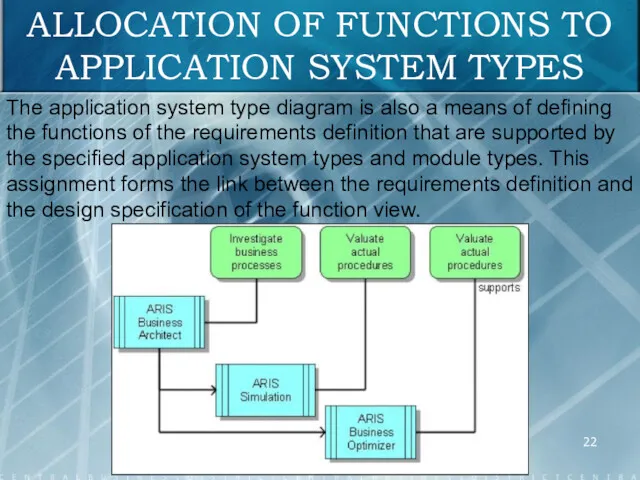
ALLOCATION OF FUNCTIONS TO APPLICATION SYSTEM TYPES
The application system type
ALLOCATION OF FUNCTIONS TO APPLICATION SYSTEM TYPES
The application system type
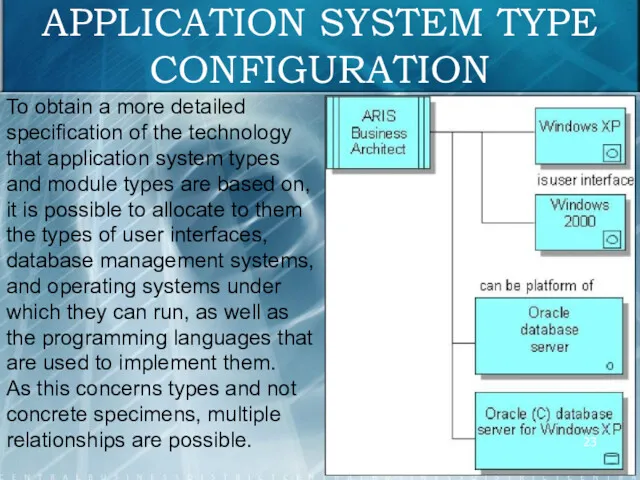
APPLICATION SYSTEM TYPE CONFIGURATION
To obtain a more detailed specification of the
APPLICATION SYSTEM TYPE CONFIGURATION
To obtain a more detailed specification of the
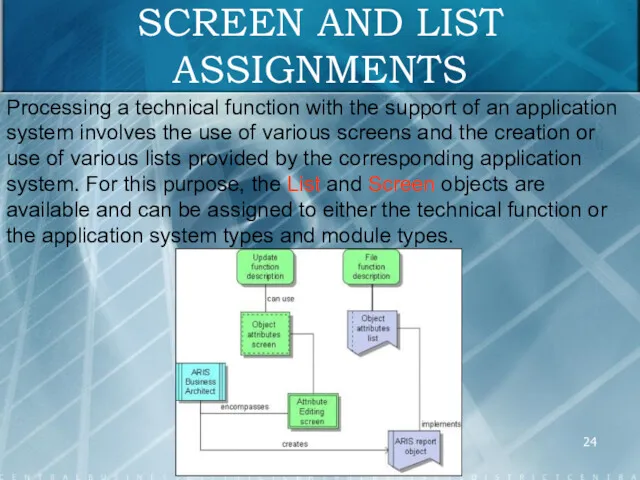
SCREEN AND LIST ASSIGNMENTS
Processing a technical function with the support of
SCREEN AND LIST ASSIGNMENTS
Processing a technical function with the support of
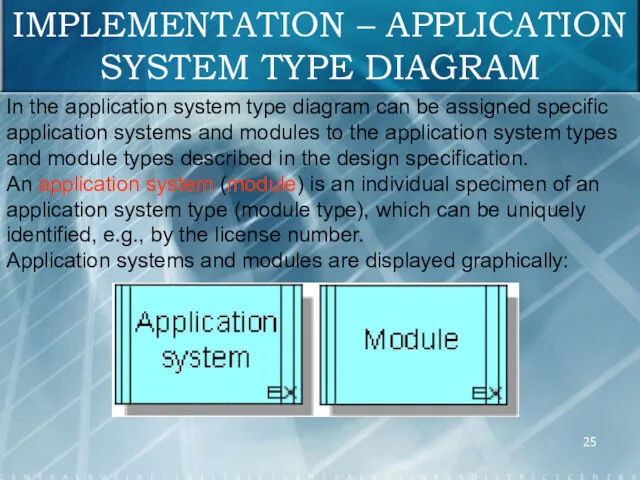
IMPLEMENTATION – APPLICATION SYSTEM TYPE DIAGRAM
In the application system type diagram
IMPLEMENTATION – APPLICATION SYSTEM TYPE DIAGRAM
In the application system type diagram
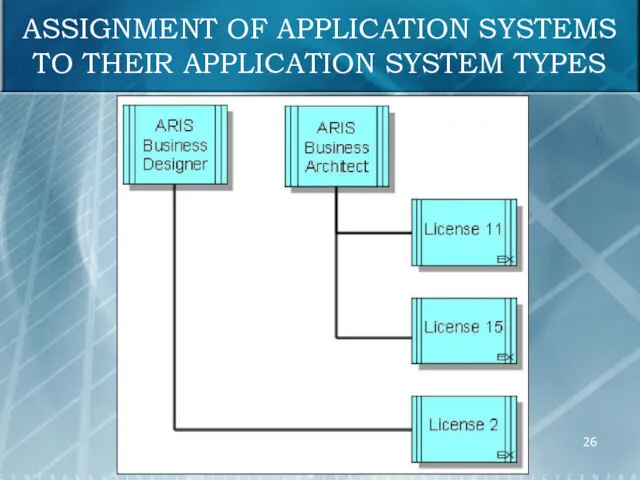
ASSIGNMENT OF APPLICATION SYSTEMS TO THEIR APPLICATION SYSTEM TYPES
ASSIGNMENT OF APPLICATION SYSTEMS TO THEIR APPLICATION SYSTEM TYPES
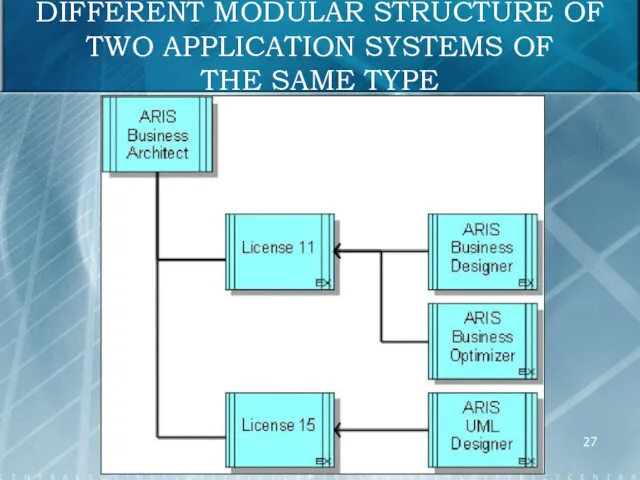
DIFFERENT MODULAR STRUCTURE OF TWO APPLICATION SYSTEMS OF
THE SAME TYPE
DIFFERENT MODULAR STRUCTURE OF TWO APPLICATION SYSTEMS OF
THE SAME TYPE
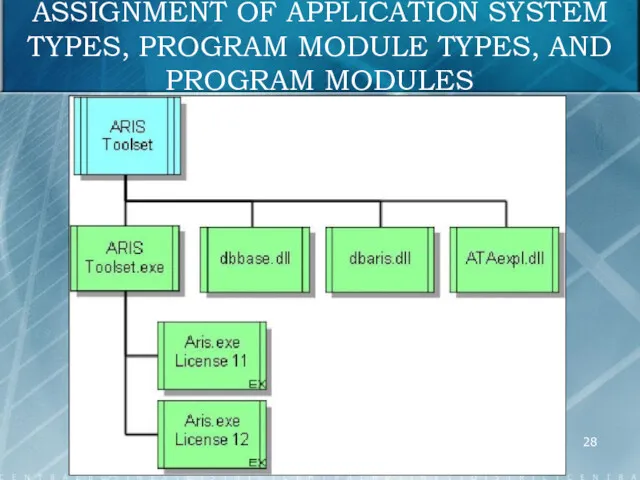
ASSIGNMENT OF APPLICATION SYSTEM TYPES, PROGRAM MODULE TYPES, AND PROGRAM MODULES
ASSIGNMENT OF APPLICATION SYSTEM TYPES, PROGRAM MODULE TYPES, AND PROGRAM MODULES
DATA VIEW
The requirements definition of the data view includes a description
DATA VIEW
The requirements definition of the data view includes a description
ENTITY-RELATIONSHIP MODEL (ERM)
Entity-Relationship Model (ERM) is the most widely used designing
ENTITY-RELATIONSHIP MODEL (ERM)
Entity-Relationship Model (ERM) is the most widely used designing
ENTITIES
Entities are real or abstract objects that are relevant for the
ENTITIES
Entities are real or abstract objects that are relevant for the
ATTRIBUTES
Attributes are properties describing entity types. Attribute occurrences are specific values
ATTRIBUTES
Attributes are properties describing entity types. Attribute occurrences are specific values
RELATIONSHIPS
A relationship is a logical link between entities. Therefore, the existence
RELATIONSHIPS
A relationship is a logical link between entities. Therefore, the existence
CARDINALITIES OF RELATIONSHIPS BETWEEN TWO ENTITY TYPES
Four different types of relationships
CARDINALITIES OF RELATIONSHIPS BETWEEN TWO ENTITY TYPES
Four different types of relationships
CARDINALITIES OF RELATIONSHIPS BETWEEN TWO ENTITY TYPES
CARDINALITIES OF RELATIONSHIPS BETWEEN TWO ENTITY TYPES
REPRESENTATION OF CARDINALITIES IN THE ERM
REPRESENTATION OF CARDINALITIES IN THE ERM
REPRESENTATION OF CARDINALITIES IN THE ERM
Due to the fact that relationships
REPRESENTATION OF CARDINALITIES IN THE ERM
Due to the fact that relationships
REPRESENTATION OF CARDINALITIES IN THE ERM
REPRESENTATION OF CARDINALITIES IN THE ERM
eERM EXTENSIONS
For extending ERM modeling, four basic design operators have become
eERM EXTENSIONS
For extending ERM modeling, four basic design operators have become
CLASSIFICATION
Through classification, objects (entities) of the same type are identified and
CLASSIFICATION
Through classification, objects (entities) of the same type are identified and
GENERALIZATION /
SPECIALIZATION
Generalization means that similar object types are grouped under a
GENERALIZATION /
SPECIALIZATION
Generalization means that similar object types are grouped under a
GENERALIZATION /
SPECIALIZATION
GENERALIZATION /
SPECIALIZATION
AGGREGATION
Aggregation is the formation of new object types by combining existing
AGGREGATION
Aggregation is the formation of new object types by combining existing
DATA CLUSTER
In an ERM, a complex structural context is split into
DATA CLUSTER
In an ERM, a complex structural context is split into
DATA CLUSTER VIEW OF MULTIPLE OBJECTS
DATA CLUSTER VIEW OF MULTIPLE OBJECTS
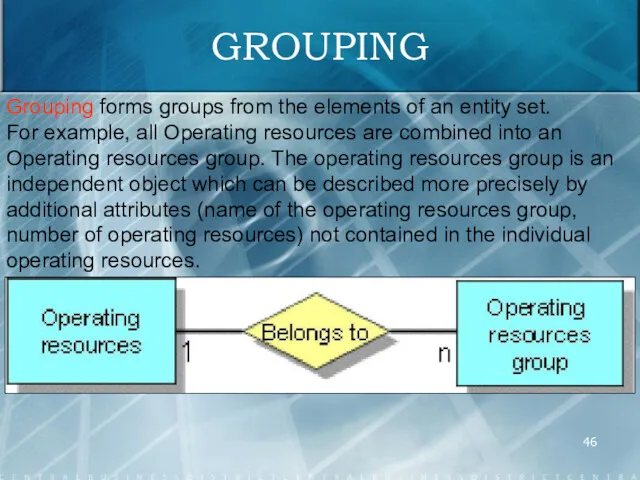
GROUPING
Grouping forms groups from the elements of an entity set.
For example,
GROUPING
Grouping forms groups from the elements of an entity set.
For example,
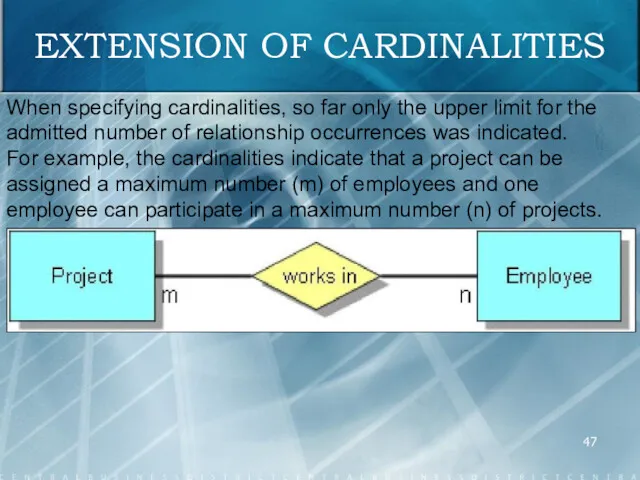
EXTENSION OF CARDINALITIES
When specifying cardinalities, so far only the upper limit
EXTENSION OF CARDINALITIES
When specifying cardinalities, so far only the upper limit
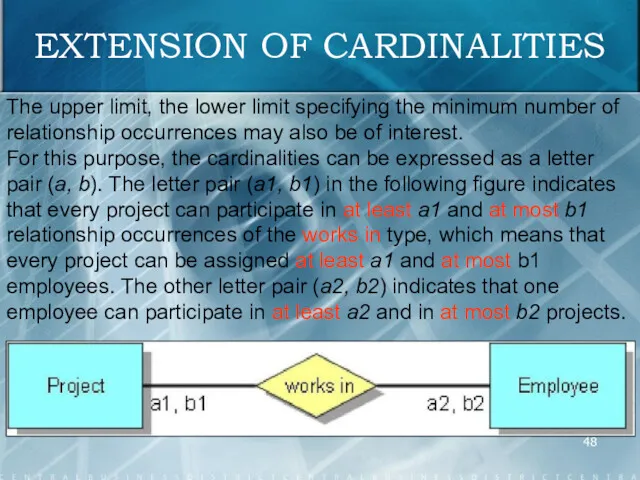
EXTENSION OF CARDINALITIES
The upper limit, the lower limit specifying the minimum
EXTENSION OF CARDINALITIES
The upper limit, the lower limit specifying the minimum
EXTENSION OF CARDINALITIES
Every relationship is defined by two degrees of complexity
EXTENSION OF CARDINALITIES
Every relationship is defined by two degrees of complexity
EXTENSION OF CARDINALITIES
In the example, the lower limits indicate that an
EXTENSION OF CARDINALITIES
In the example, the lower limits indicate that an
TECHNICAL TERMS MODEL
Technical terms model can be used to manage the
TECHNICAL TERMS MODEL
Technical terms model can be used to manage the
TECHNICAL TERMS MODEL
TECHNICAL TERMS MODEL
eERM ATTRIBUTE ALLOCATION DIAGRAM
eERM attribute allocation diagrams enable to assign ERM
eERM ATTRIBUTE ALLOCATION DIAGRAM
eERM attribute allocation diagrams enable to assign ERM
SAP SERM
The modeling technique developed by SAP AG. In this context,
SAP SERM
The modeling technique developed by SAP AG. In this context,
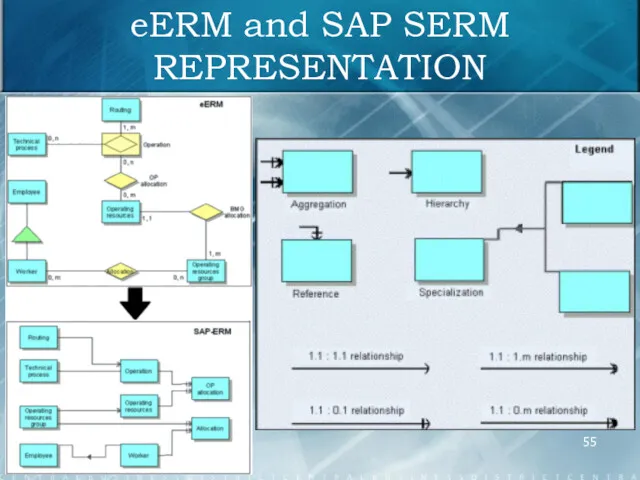
eERM and SAP SERM REPRESENTATION
eERM and SAP SERM REPRESENTATION
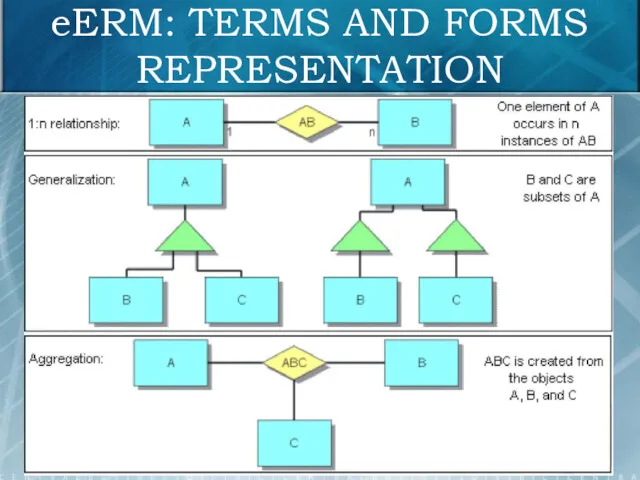
eERM: TERMS AND FORMS REPRESENTATION
eERM: TERMS AND FORMS REPRESENTATION
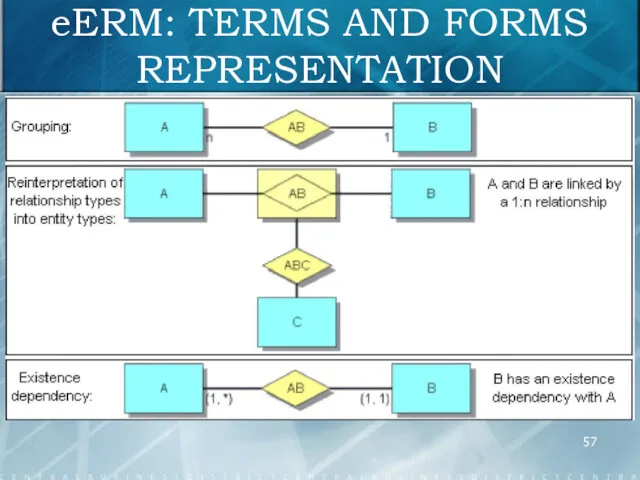
eERM: TERMS AND FORMS REPRESENTATION
eERM: TERMS AND FORMS REPRESENTATION
DOCUMENT TYPE DEFINITION
A model of the DTD (Document Type Definition) type
DOCUMENT TYPE DEFINITION
A model of the DTD (Document Type Definition) type
MATERIAL FLOW MODELING – MATERIAL DIAGRAM
To illustrate the material flow in
MATERIAL FLOW MODELING – MATERIAL DIAGRAM
To illustrate the material flow in
MATERIAL FLOW MODELING – MATERIAL DIAGRAM
Packaging material types can also be
MATERIAL FLOW MODELING – MATERIAL DIAGRAM
Packaging material types can also be
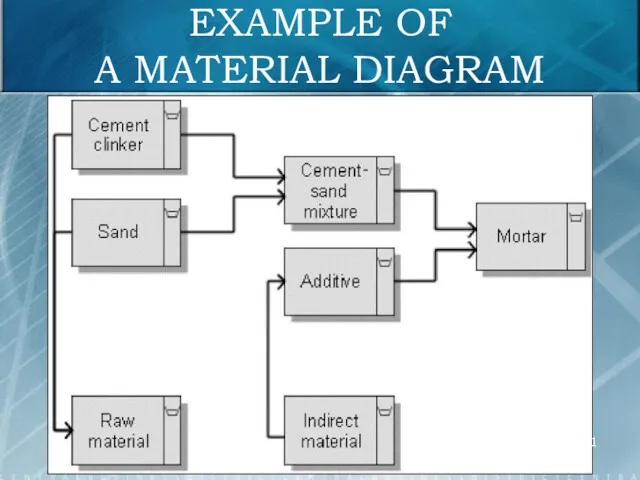
EXAMPLE OF
A MATERIAL DIAGRAM
EXAMPLE OF
A MATERIAL DIAGRAM
MODELING THE DATA WAREHOUSE STRUCTURE
The Data Warehouse structure diagram describes
MODELING THE DATA WAREHOUSE STRUCTURE
The Data Warehouse structure diagram describes
DATA WAREHOUSE
IN THE STAR SCHEMA
DATA WAREHOUSE
IN THE STAR SCHEMA
AUTHORIZATION HIERARCHY
The authorization hierarchy diagram is used in role modeling and
AUTHORIZATION HIERARCHY
The authorization hierarchy diagram is used in role modeling and
AUTHORIZATION HIERARCHY
AUTHORIZATION HIERARCHY
COST DRIVER DIAGRAM
The CD diagram (cost driver diagram) is used in
COST DRIVER DIAGRAM
The CD diagram (cost driver diagram) is used in
COST DRIVER DIAGRAM
Cost drivers can be defined only for performance amount-variable
COST DRIVER DIAGRAM
Cost drivers can be defined only for performance amount-variable
COST DRIVER DIAGRAM
COST DRIVER DIAGRAM
COST CATEGORY DIAGRAM
The cost category diagram is used in process cost
COST CATEGORY DIAGRAM
The cost category diagram is used in process cost
COST CATEGORY DIAGRAM
COST CATEGORY DIAGRAM
RELATIONS DIAGRAM
In the design specification, the logical data structures designed in
RELATIONS DIAGRAM
In the design specification, the logical data structures designed in
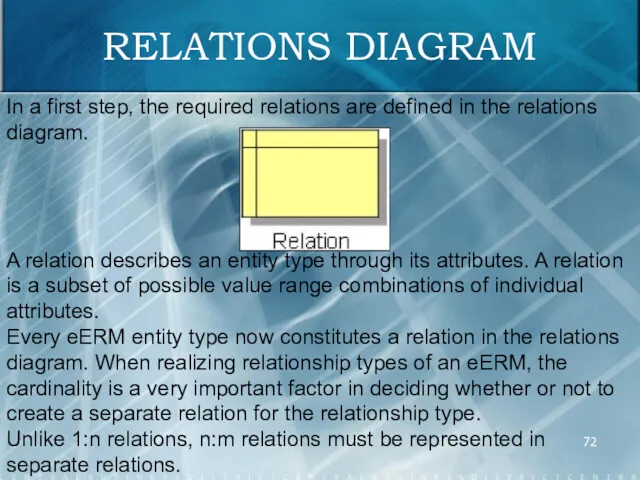
RELATIONS DIAGRAM
In a first step, the required relations are defined in
RELATIONS DIAGRAM
In a first step, the required relations are defined in
RELATIONS DIAGRAM
In a second step, the relations diagram can indicate for
RELATIONS DIAGRAM
In a second step, the relations diagram can indicate for
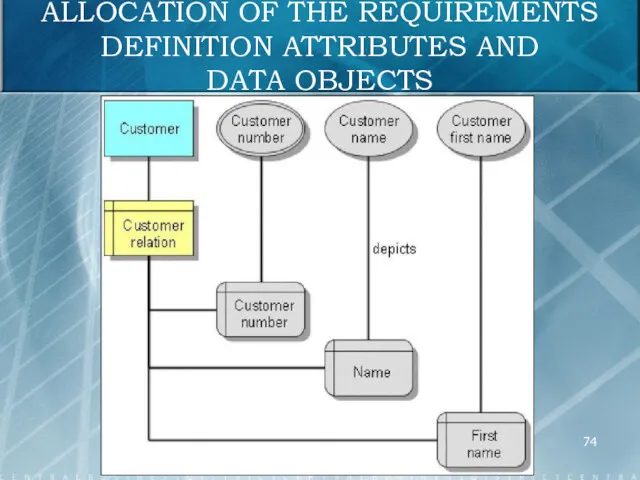
ALLOCATION OF THE REQUIREMENTS DEFINITION ATTRIBUTES AND
DATA OBJECTS
ALLOCATION OF THE REQUIREMENTS DEFINITION ATTRIBUTES AND
DATA OBJECTS
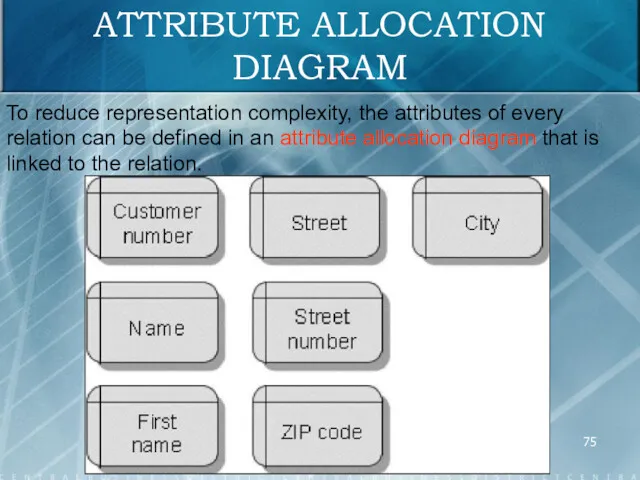
ATTRIBUTE ALLOCATION DIAGRAM
To reduce representation complexity, the attributes of every relation
ATTRIBUTE ALLOCATION DIAGRAM
To reduce representation complexity, the attributes of every relation
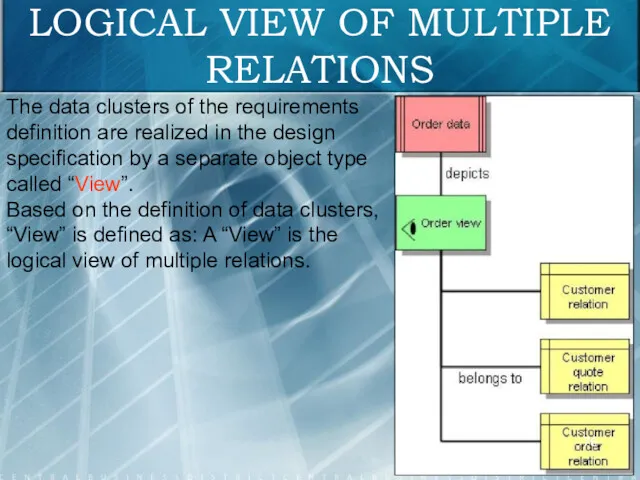
LOGICAL VIEW OF MULTIPLE RELATIONS
The data clusters of the requirements definition
LOGICAL VIEW OF MULTIPLE RELATIONS
The data clusters of the requirements definition
SYSTEM ATTRIBUTES MODEL
The System attributes model type is primarily designed to
SYSTEM ATTRIBUTES MODEL
The System attributes model type is primarily designed to
EXAMPLE OF
A “SYSTEM ATTRIBUTES” MODEL
EXAMPLE OF
A “SYSTEM ATTRIBUTES” MODEL
SYSTEM ATTRIBUTE DOMAIN
The System attribute domain model type is used to
SYSTEM ATTRIBUTE DOMAIN
The System attribute domain model type is used to
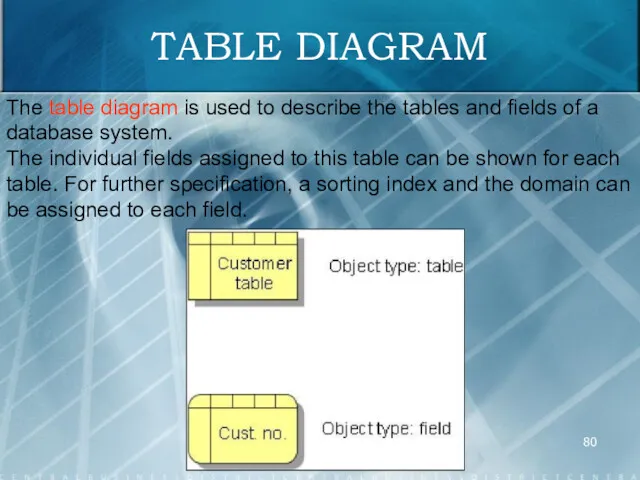
TABLE DIAGRAM
The table diagram is used to describe the tables and
TABLE DIAGRAM
The table diagram is used to describe the tables and
FIELD ALLOCATIONS
FIELD ALLOCATIONS
ALLOCATION OF
REQUIREMENTS DEFINITION AND
DESIGN SPECIFICATION OBJECTS
As relations of a relations diagram
ALLOCATION OF
REQUIREMENTS DEFINITION AND
DESIGN SPECIFICATION OBJECTS
As relations of a relations diagram
Due to the fact that converting or documenting database tables and
Due to the fact that converting or documenting database tables and
ALLOCATION OF
REQUIREMENTS DEFINITION AND
DESIGN SPECIFICATION OBJECTS
ALLOCATION OF
REQUIREMENTS DEFINITION AND
DESIGN SPECIFICATION OBJECTS
To be able to define the exact location of specific tables
To be able to define the exact location of specific tables
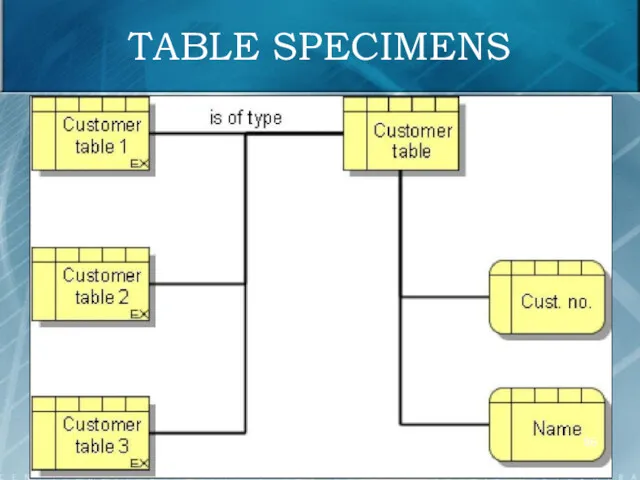
TABLE SPECIMENS
TABLE SPECIMENS
Companies are complex social structures that are divided into manageable units.
Companies are complex social structures that are divided into manageable units.
The design of an ideal company organization with the aim of
The design of an ideal company organization with the aim of
A typical way of representing organizational structures is the organizational chart.
A typical way of representing organizational structures is the organizational chart.
The Position object type is provided to represent individual positions within
The Position object type is provided to represent individual positions within
ORGANIZATIONAL CHART WITH
POSITION AND PERSON ASSIGNMENT
ORGANIZATIONAL CHART WITH
POSITION AND PERSON ASSIGNMENT
PERSON TYPES
Using these object types enables to depict general business rules
PERSON TYPES
Using these object types enables to depict general business rules
LOCATION ASSIGNMENTS
The modeling of the organizational structure of the company is
LOCATION ASSIGNMENTS
The modeling of the organizational structure of the company is
LOCATION ASSIGNMENTS
LOCATION ASSIGNMENTS
LOCATION HIERARCHIES
LOCATION HIERARCHIES
SHIFT CALENDAR
A shift calendar is the total number of shift cycles
SHIFT CALENDAR
A shift calendar is the total number of shift cycles
NETWORK TOPOLOGY
The structural requirements for these information systems can generally be
NETWORK TOPOLOGY
The structural requirements for these information systems can generally be
NETWORK TOPOLOGY
The link between network topology and the objects of the
NETWORK TOPOLOGY
The link between network topology and the objects of the
NETWORK TOPOLOGY
NETWORK TOPOLOGY
NETWORK DIAGRAM
The network diagram illustrates the realization of the network topology
NETWORK DIAGRAM
The network diagram illustrates the realization of the network topology
NETWORK DIAGRAM WITH LOCATION ASSIGNMENT
NETWORK DIAGRAM WITH LOCATION ASSIGNMENT
NETWORK DIAGRAM
WITH HARDWARE COMPONENTS AND LOCATION ASSIGNMENT
NETWORK DIAGRAM
WITH HARDWARE COMPONENTS AND LOCATION ASSIGNMENT
MATERIAL FLOW MODELING – TECHNICAL RESOURCES
To illustrate the material flow in
MATERIAL FLOW MODELING – TECHNICAL RESOURCES
To illustrate the material flow in
MATERIAL FLOW MODELING – TECHNICAL RESOURCES
In the Technical resources model type
MATERIAL FLOW MODELING – TECHNICAL RESOURCES
In the Technical resources model type
MATERIAL FLOW MODELING – TECHNICAL RESOURCES
Operating resource class. Similar operating resource
MATERIAL FLOW MODELING – TECHNICAL RESOURCES
Operating resource class. Similar operating resource
MATERIAL FLOW MODELING – TECHNICAL RESOURCES
Warehouse equipment class. Similar warehouse equipment
MATERIAL FLOW MODELING – TECHNICAL RESOURCES
Warehouse equipment class. Similar warehouse equipment
MATERIAL FLOW MODELING – TECHNICAL RESOURCES
Technical operating supply class. Similar technical
MATERIAL FLOW MODELING – TECHNICAL RESOURCES
Technical operating supply class. Similar technical
MATERIAL FLOW MODELING – TECHNICAL RESOURCES
Transport system class. Similar transport system
MATERIAL FLOW MODELING – TECHNICAL RESOURCES
Transport system class. Similar transport system
EXAMPLE OF A “TECHNICAL RESOURCES” MODEL
EXAMPLE OF A “TECHNICAL RESOURCES” MODEL
PROCESS VIEW / CONTROL VIEW
The relationships between the objects of the
PROCESS VIEW / CONTROL VIEW
The relationships between the objects of the

LINKING FUNCTIONS WITH ORGANIZATION
Linking the function view with the organization view
LINKING FUNCTIONS WITH ORGANIZATION
Linking the function view with the organization view
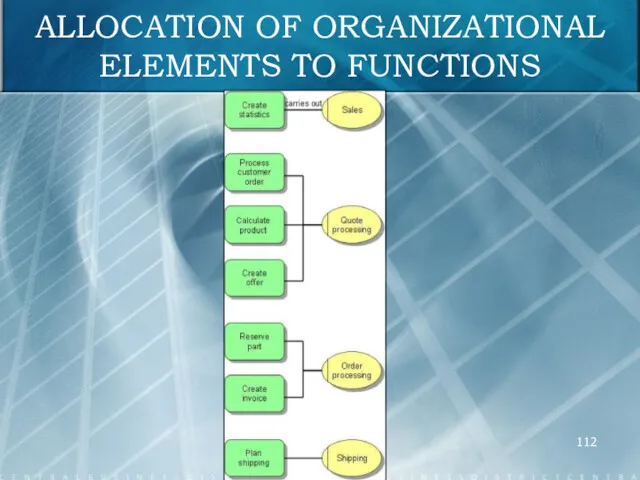
ALLOCATION OF ORGANIZATIONAL ELEMENTS TO FUNCTIONS
ALLOCATION OF ORGANIZATIONAL ELEMENTS TO FUNCTIONS
EVENT-DRIVEN PROCESS CHAIN (EPC)
Linking the function view with the organization view
EVENT-DRIVEN PROCESS CHAIN (EPC)
Linking the function view with the organization view
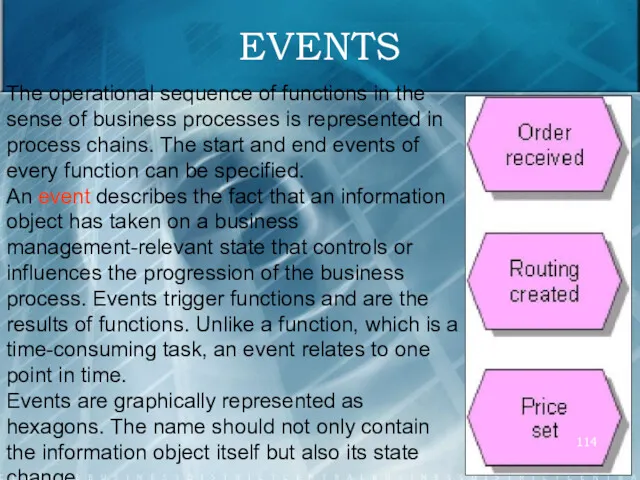
EVENTS
The operational sequence of functions in the sense of business processes
EVENTS
The operational sequence of functions in the sense of business processes
EVENT-DRIVEN PROCESS CHAIN (EPC)
Events trigger functions and are the results of
EVENT-DRIVEN PROCESS CHAIN (EPC)
Events trigger functions and are the results of
EVENT-DRIVEN PROCESS CHAIN (EPC)
EVENT-DRIVEN PROCESS CHAIN (EPC)
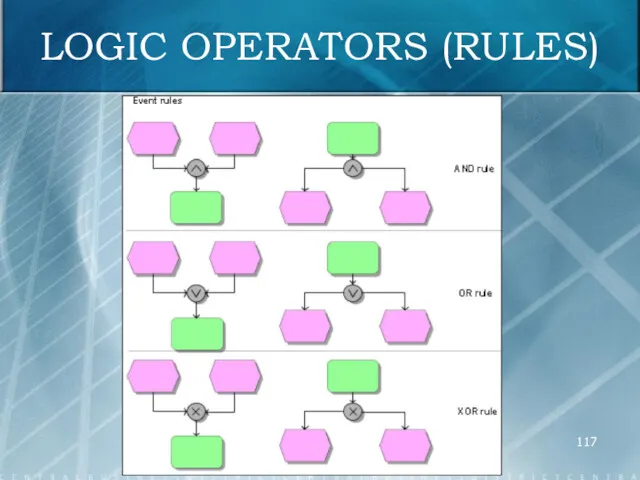
LOGIC OPERATORS (RULES)
LOGIC OPERATORS (RULES)
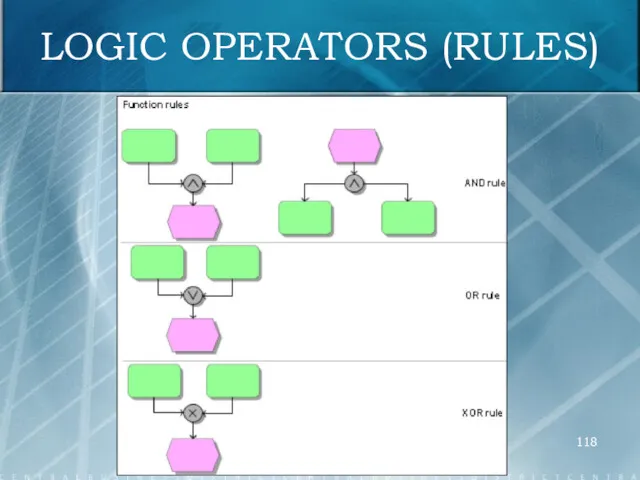
LOGIC OPERATORS (RULES)
LOGIC OPERATORS (RULES)
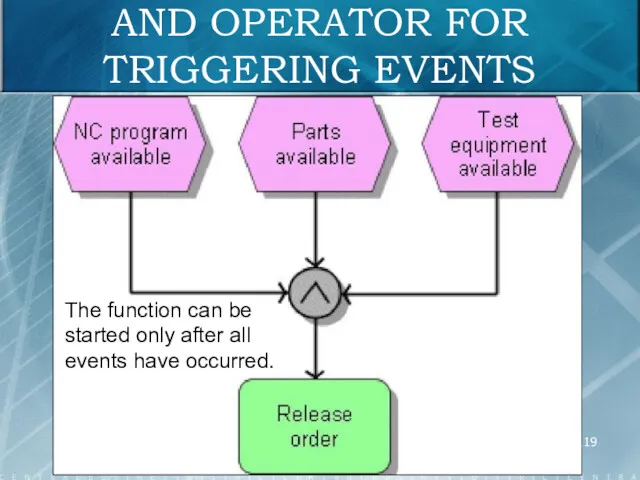
AND OPERATOR FOR TRIGGERING EVENTS
The function can be started only after
AND OPERATOR FOR TRIGGERING EVENTS
The function can be started only after
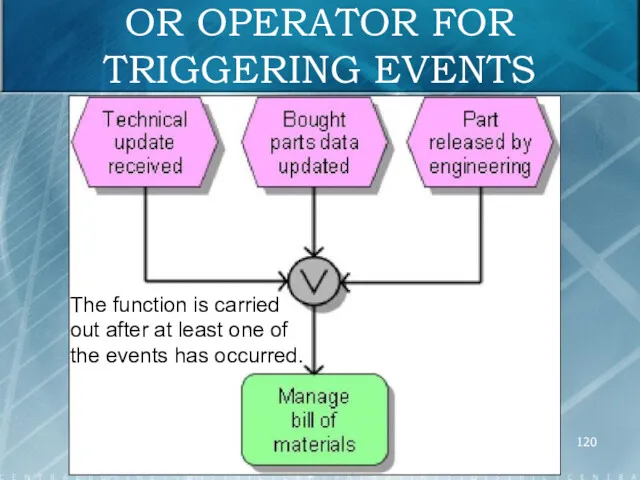
OR OPERATOR FOR TRIGGERING EVENTS
The function is carried out after at
OR OPERATOR FOR TRIGGERING EVENTS
The function is carried out after at
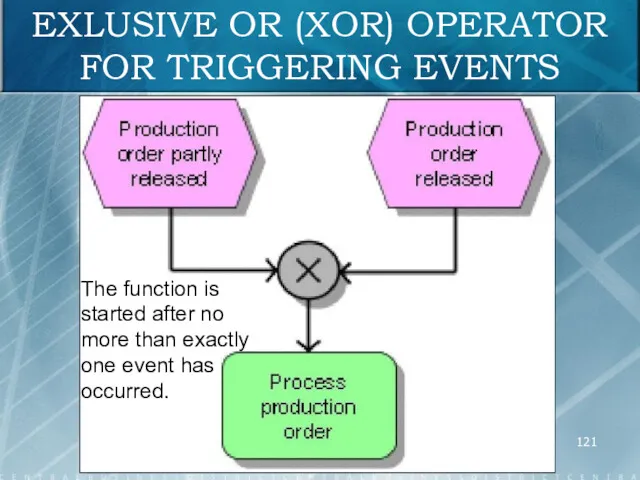
EXLUSIVE OR (XOR) OPERATOR FOR TRIGGERING EVENTS
The function is started after
EXLUSIVE OR (XOR) OPERATOR FOR TRIGGERING EVENTS
The function is started after
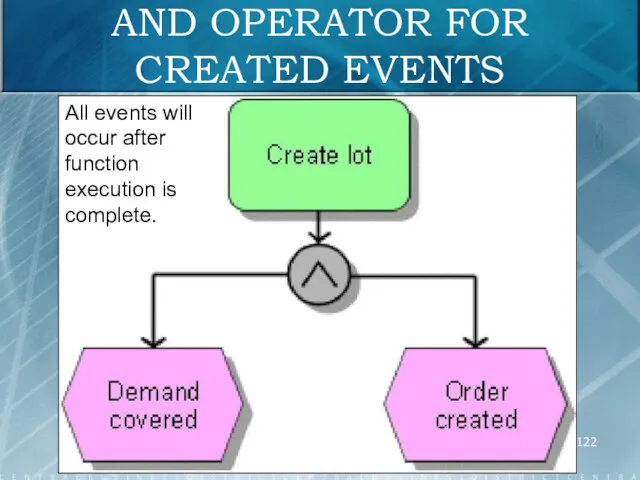
AND OPERATOR FOR
CREATED EVENTS
All events will occur after function execution is
AND OPERATOR FOR
CREATED EVENTS
All events will occur after function execution is
OR OPERATOR FOR
CREATED EVENTS
At least one of the events will occur
OR OPERATOR FOR
CREATED EVENTS
At least one of the events will occur
EXLUSIVE OR (XOR) OPERATOR FOR CREATED EVENTS
No more than one event
EXLUSIVE OR (XOR) OPERATOR FOR CREATED EVENTS
No more than one event
AND OPERATOR OF FUNCTIONS WITH CREATED EVENTS
The event occurs only after
AND OPERATOR OF FUNCTIONS WITH CREATED EVENTS
The event occurs only after
OR OPERATOR OF FUNCTIONS WITH CREATED EVENTS
The event occurs after at
OR OPERATOR OF FUNCTIONS WITH CREATED EVENTS
The event occurs after at
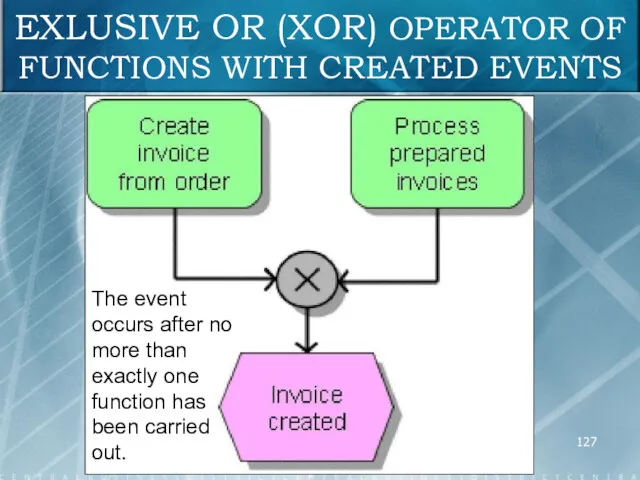
EXLUSIVE OR (XOR) OPERATOR OF FUNCTIONS WITH CREATED EVENTS
The event occurs
EXLUSIVE OR (XOR) OPERATOR OF FUNCTIONS WITH CREATED EVENTS
The event occurs
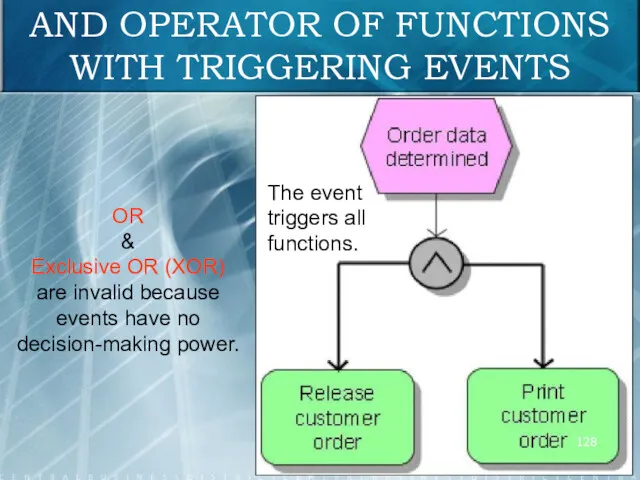
AND OPERATOR OF FUNCTIONS WITH TRIGGERING EVENTS
The event triggers all functions.
AND OPERATOR OF FUNCTIONS WITH TRIGGERING EVENTS
The event triggers all functions.
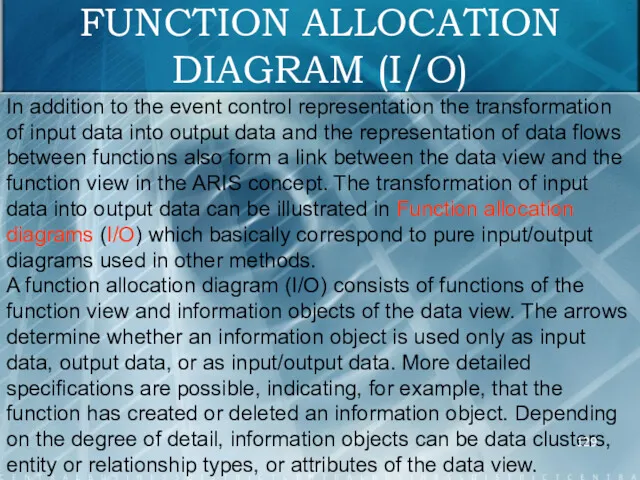
FUNCTION ALLOCATION DIAGRAM (I/O)
In addition to the event control representation the
FUNCTION ALLOCATION DIAGRAM (I/O)
In addition to the event control representation the
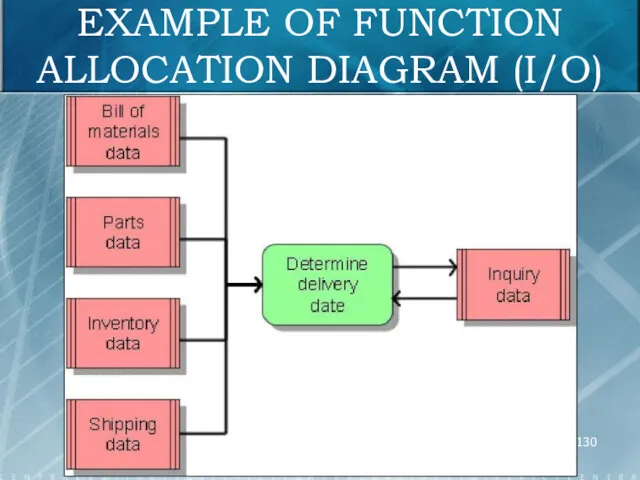
EXAMPLE OF FUNCTION ALLOCATION DIAGRAM (I/O)
EXAMPLE OF FUNCTION ALLOCATION DIAGRAM (I/O)
FUNCTION ALLOCATION DIAGRAM (I/O)
Besides a function's input/output data, events and all
FUNCTION ALLOCATION DIAGRAM (I/O)
Besides a function's input/output data, events and all
DETAILED REPRESENTATION OF THE FUNCTION ALLOCATION DIAGRAM
DETAILED REPRESENTATION OF THE FUNCTION ALLOCATION DIAGRAM
EPC WITH
INPUT/OUTPUT DATA
Besides this method of representing data transformation in the
EPC WITH
INPUT/OUTPUT DATA
Besides this method of representing data transformation in the
EPC WITH
INPUT/OUTPUT DATA
EPC WITH
INPUT/OUTPUT DATA
EPC WITH
INPUT/OUTPUT DATA
In the PCD (process chain diagram), objects have to
EPC WITH
INPUT/OUTPUT DATA
In the PCD (process chain diagram), objects have to
EPC WITH
INPUT/OUTPUT DATA
EPC WITH
INPUT/OUTPUT DATA
INDUSTRIAL PROCESS & OFFICE PROCESS
The Industrial process and Office process model
INDUSTRIAL PROCESS & OFFICE PROCESS
The Industrial process and Office process model
INDUSTRIAL PROCESS & OFFICE PROCESS
To maximize the identification with symbols, two
INDUSTRIAL PROCESS & OFFICE PROCESS
To maximize the identification with symbols, two
INDUSTRIAL PROCESS & OFFICE PROCESS
INDUSTRIAL PROCESS & OFFICE PROCESS
INDUSTRIAL PROCESS & OFFICE PROCESS
INDUSTRIAL PROCESS & OFFICE PROCESS
INDUSTRIAL PROCESS & OFFICE PROCESS
INDUSTRIAL PROCESS & OFFICE PROCESS
INDUSTRIAL PROCESS & OFFICE PROCESS
INDUSTRIAL PROCESS & OFFICE PROCESS
 Реляційні бази даних, їхні об’єкти. Ключі й зовнішні ключ
 Бесплатные антивирусные программы
 Сетевые атаки
 Организация работы психолога в удаленном режиме
 Дебаты: порядок организации и проведения
 Visual Basic
 Архітектура, розроблення та експлуатація інформаційних систем корпоративного і національного рівнів
 Welcome To ZyXEL Router Customer Care Center. How to Install a ZyXEL Router
 Методика підготовки інформаційно-аналітичних продуктів
 Основные возможности Footprint Factory
 HTML. Введение в CSS. Подготовка графики
 Внеклассное мероприятие по информатике Игра воображения
 Web-дизайн. Последовательность разработки вебориентированных приложений
 Средства массовой информации
 Інформаційна система обліку матеріалів складу технічного обладнання Хлібокомбінату
 Управление центральным процессором. Тенденции развития современных процессоров
 Программные средства реализации информационных процессов в интернет-магазине AllSoft
 Pascal Модуль GraphABC
 Табличное решение логических задач
 использование игр на уроке информатики в начальной школе
 Информатика 10 класс тема Информация, информационные процессы и измерение информации
 Системы счисления и представление данных в компьютере
 Оформление социальных сетей. Чек-лист
 Конструктор игр
 Awesome outfits with gears
 Методика разработки flash-игр
 Информация. Информационная грамотность и информационная культура. Информация и информационные процессы
 Информационная и художественная природа телевизионного изображения