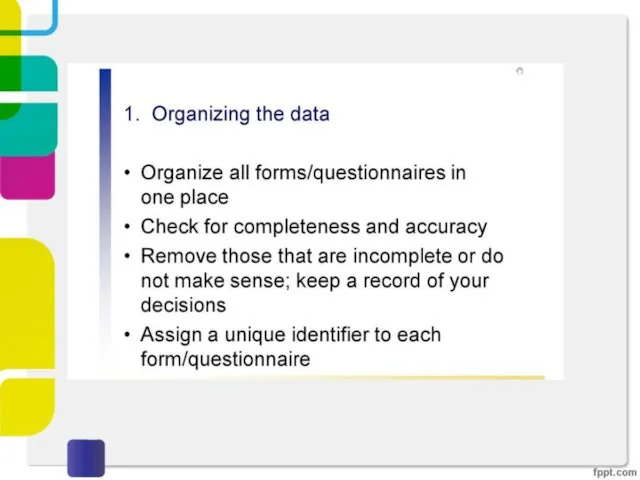
- Data analysis

Содержание
- 2. OVERVIEW Qualitative and quantitative Simple quantitative analysis Simple qualitative analysis Tools to support data analysis Theoretical
- 3. SCALES OF MEASUREMENT into a non- Many people are confused about what type of analysis to
- 4. When using a quantitative methodology, you are normally testing theory through the testing of a hypothesis.
- 13. GRAPHICAL REPRESENTATIONS give overview of data Number of errors made 4.5 4 3.5 3 2.5 2
- 14. Visualizing log data Interaction profiles of players in online game Log of web page activity
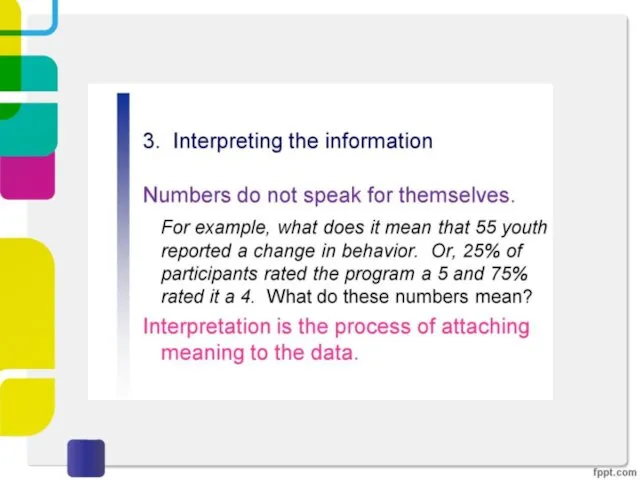
- 15. QUALITATIVE ANALYSIS "Data analysis is the process of bringing order, structure and meaning to the mass
- 16. Simple qualitative analysis Unstructured - are not directed by a script. Rich but not replicable. Structured
- 17. Simple qualitative analysis Recurring patterns or themes Emergent from data, dependent on observation framework if used
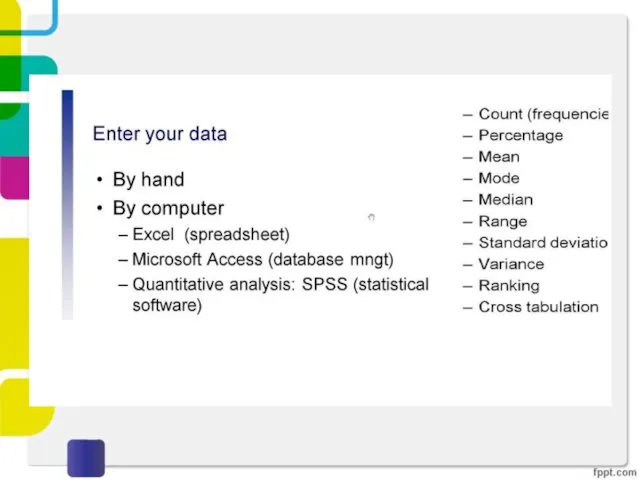
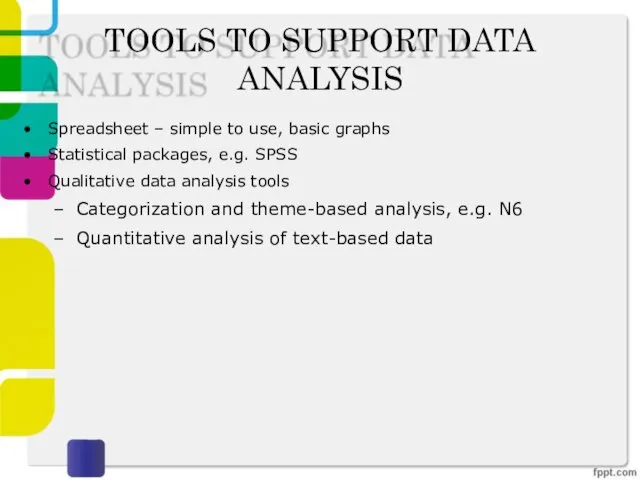
- 18. TOOLS TO SUPPORT DATA ANALYSIS Spreadsheet – simple to use, basic graphs Statistical packages, e.g. SPSS
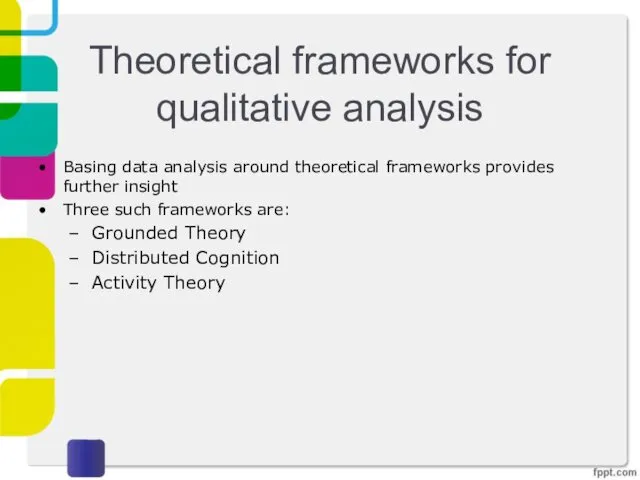
- 19. Theoretical frameworks for qualitative analysis Basing data analysis around theoretical frameworks provides further insight Three such
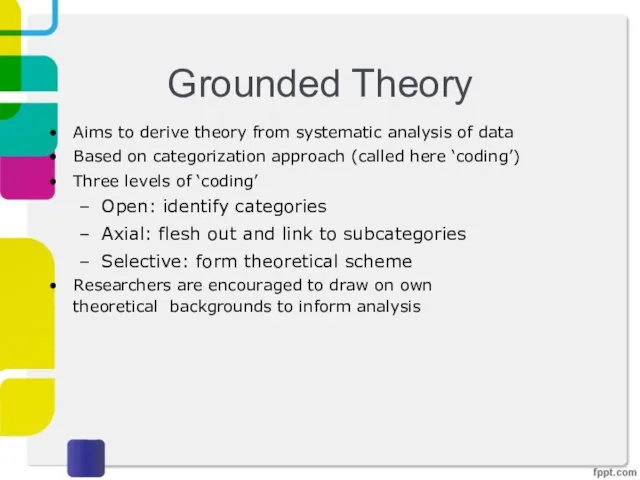
- 20. Grounded Theory Aims to derive theory from systematic analysis of data Based on categorization approach (called
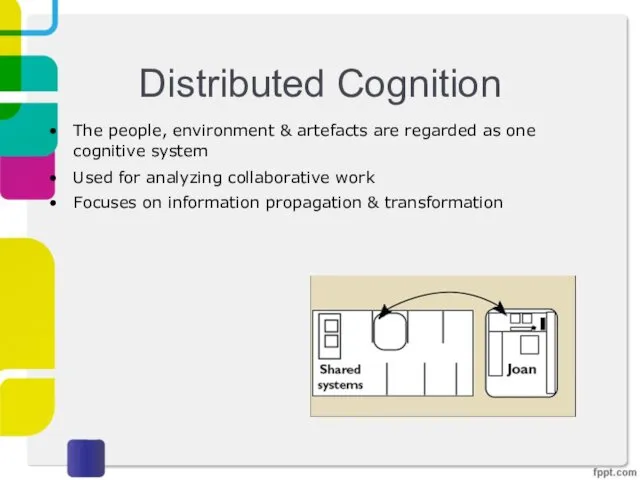
- 21. Distributed Cognition The people, environment & artefacts are regarded as one cognitive system Used for analyzing
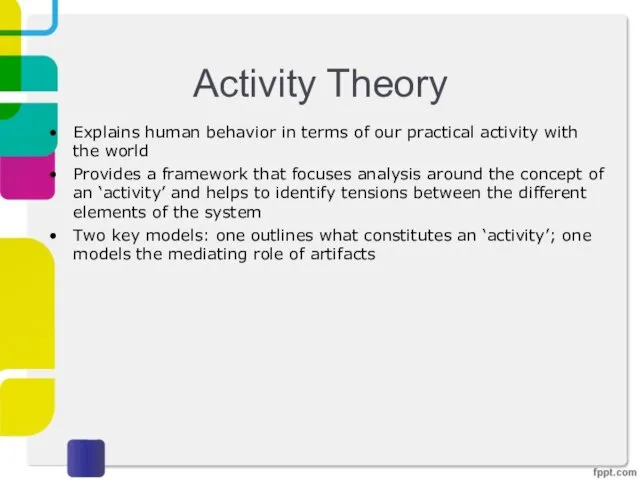
- 22. Activity Theory Explains human behavior in terms of our practical activity with the world Provides a
- 23. Individual model
- 24. Engeström’s (1999) activity system model
- 26. Скачать презентацию
OVERVIEW
Qualitative and quantitative
Simple quantitative analysis
Simple qualitative analysis
Tools to support data analysis
Theoretical
OVERVIEW
Qualitative and quantitative
Simple quantitative analysis
Simple qualitative analysis
Tools to support data analysis
Theoretical
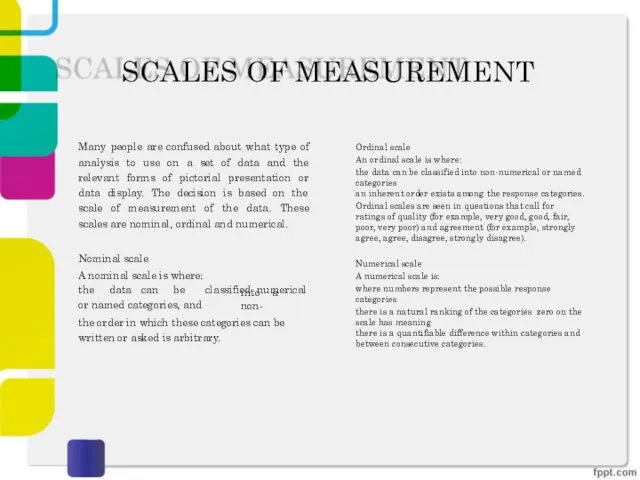
SCALES OF MEASUREMENT
into a non-
Many people are confused about what type of analysis
SCALES OF MEASUREMENT
into a non-
Many people are confused about what type of analysis
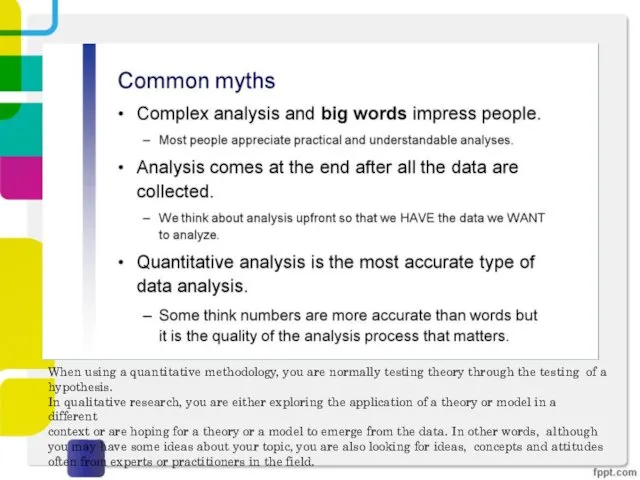
When using a quantitative methodology, you are normally testing theory through
When using a quantitative methodology, you are normally testing theory through
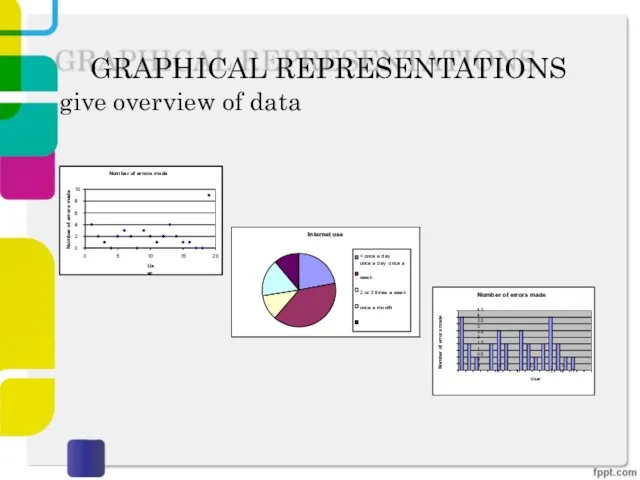
GRAPHICAL REPRESENTATIONS
give overview of data
Number of errors made
4.5
4
3.5
3
2.5
2
1.5
1
0.5
0
1 3 5 7 9 11 13 15 17
User
Number of
GRAPHICAL REPRESENTATIONS
give overview of data
Number of errors made
4.5
4
3.5
3
2.5
2
1.5
1
0.5
0
1 3 5 7 9 11 13 15 17
User
Number of
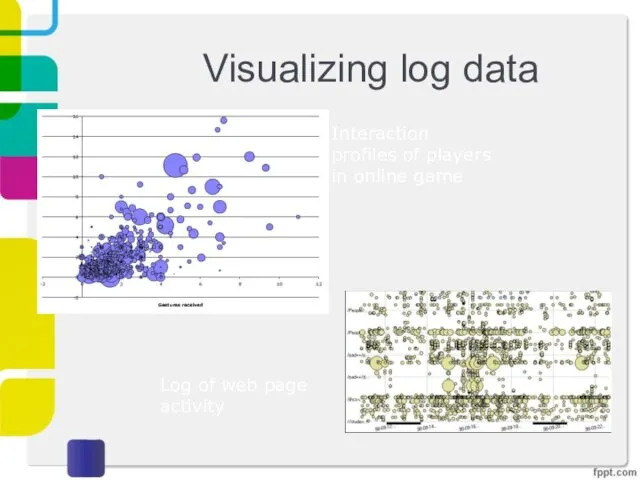
Visualizing log data
Interaction profiles of players in online game
Log of web
Visualizing log data
Interaction profiles of players in online game
Log of web
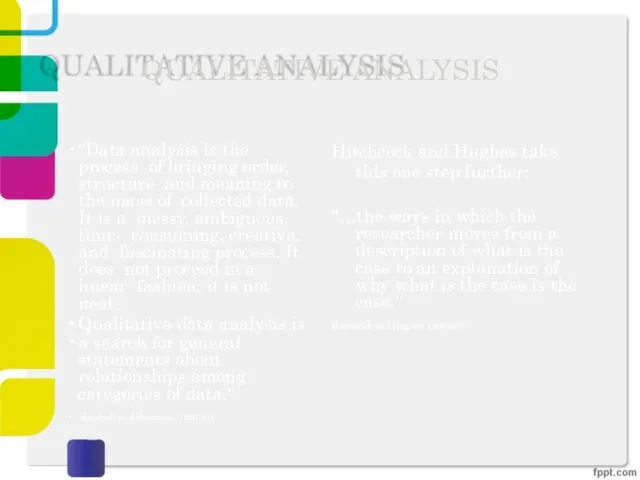
QUALITATIVE ANALYSIS
"Data analysis is the process of bringing order, structure and
QUALITATIVE ANALYSIS
"Data analysis is the process of bringing order, structure and
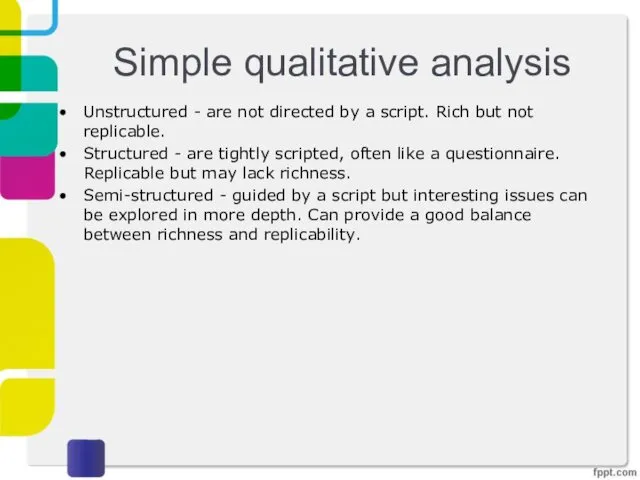
Simple qualitative analysis
Unstructured - are not directed by a script. Rich
Simple qualitative analysis
Unstructured - are not directed by a script. Rich
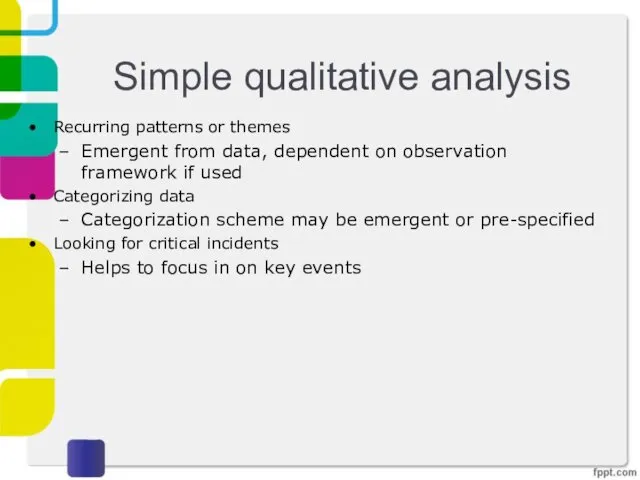
Simple qualitative analysis
Recurring patterns or themes
Emergent from data, dependent on observation
Simple qualitative analysis
Recurring patterns or themes
Emergent from data, dependent on observation
TOOLS TO SUPPORT DATA
ANALYSIS
Spreadsheet – simple to use, basic graphs
Statistical packages,
TOOLS TO SUPPORT DATA
ANALYSIS
Spreadsheet – simple to use, basic graphs
Statistical packages,
Theoretical frameworks for
qualitative analysis
Basing data analysis around theoretical frameworks provides further
Theoretical frameworks for
qualitative analysis
Basing data analysis around theoretical frameworks provides further
Grounded Theory
Aims to derive theory from systematic analysis of data
Based on
Grounded Theory
Aims to derive theory from systematic analysis of data
Based on
Distributed Cognition
The people, environment & artefacts are regarded as one cognitive
Distributed Cognition
The people, environment & artefacts are regarded as one cognitive
Activity Theory
Explains human behavior in terms of our practical activity with
Activity Theory
Explains human behavior in terms of our practical activity with
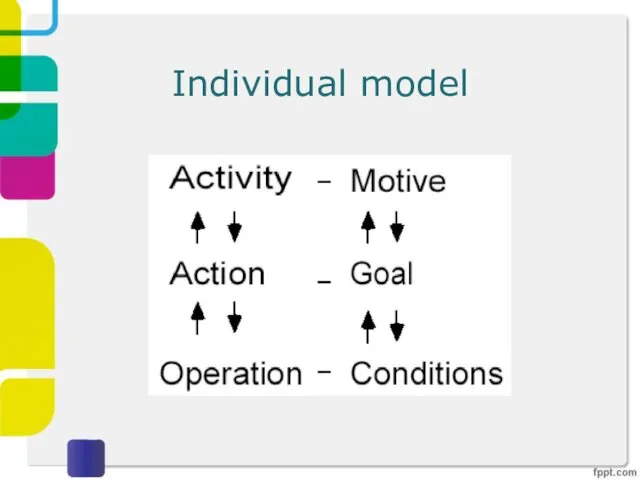
Individual model
Individual model
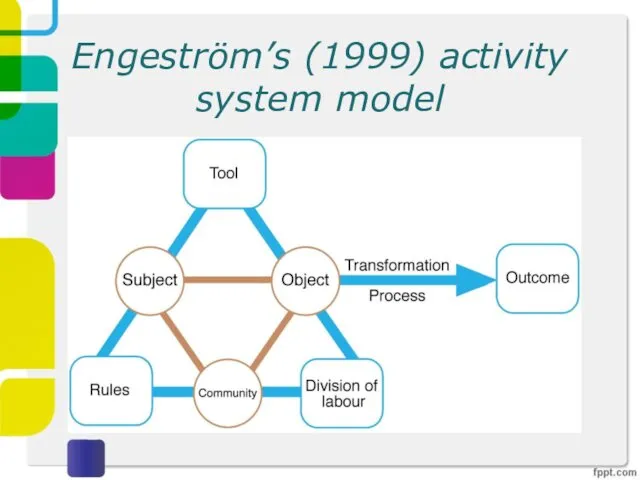
Engeström’s (1999) activity
system model
Engeström’s (1999) activity
system model
 Операционная система os/2
 Основы SQL
 Текстові редактори
 Прикладное программное обеспечение. Электронные таблицы MS Excel 2007
 Ищем потерянный трафик
 Хранение и выборка данных
 Измерение информации. Информация и информационные процессы. Информатика. 7 класс
 Мониторинг сайтов образовательных организаций г.о. Самара
 Электронные таблицы. Программа MS Excel
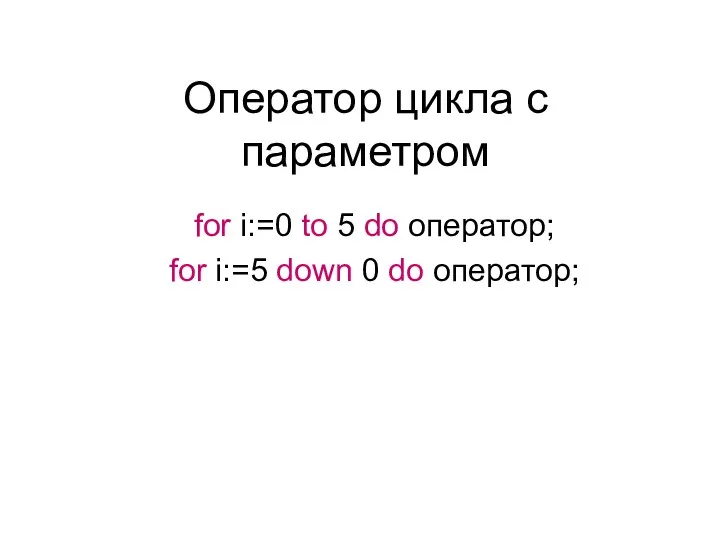 Оператор цикла с параметром
 Знакомство с графическим редактором Adobe Fhotoshop
 Разработка информационной системы Магазин продуктов. Информационные системы
 Системы счисления
 Кибербезопасность для младших школьников
 Создание веб-сайтов
 История развития вычислительной техники
 CCC releases
 Применение Matlab для обработки данных, полученных от детекторов космических излучений
 Система дистанционного обучения УГАТУ
 История вычислительной техники
 Компьютерная графика
 Компьютерные сети, Интернет и мультимедиа технологии. Основы сетей передачи данных
 Информационные технологии и управление образовательной деятельностью
 Культура электронного общения
 Биометрическая система контроля и управления доступом БиоСКУД Сонда Эксперт
 Создание формы для базы данных
 Зачем нужны социальные сети
 Классификация современных компьютеров