- Assignment #2

Содержание
- 2. #1
- 3. #2
- 4. #3-1 # Simple linear regression model (mpg ~ cylinders) # Cylinders have statistically significant relationship to
- 5. #3-2 # Multiple linear regression model (mpg ~ . – name) # Displacement, weight, year and
- 6. #4 # Residuals versus Fitted graph seems like U-shaped, that means mpg has non-linear relationship with
- 8. Скачать презентацию
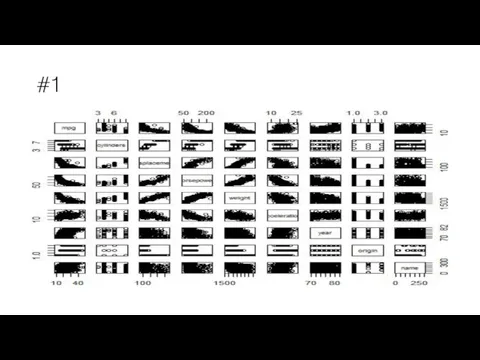
#1
#1
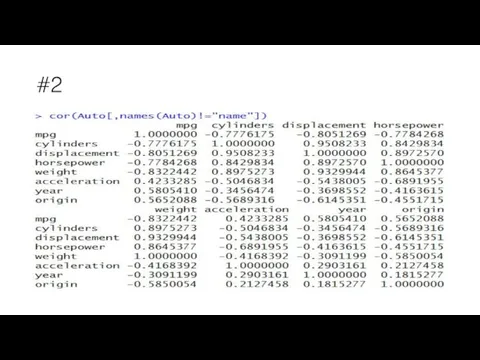
#2
#2
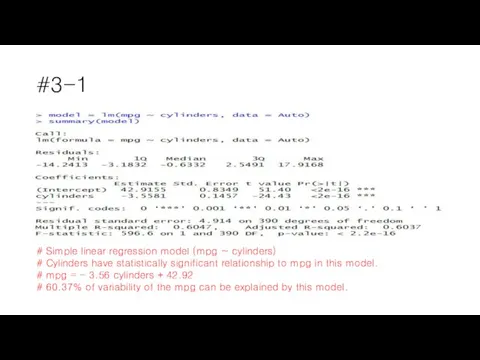
#3-1
# Simple linear regression model (mpg ~ cylinders)
# Cylinders have statistically
#3-1
# Simple linear regression model (mpg ~ cylinders)
# Cylinders have statistically
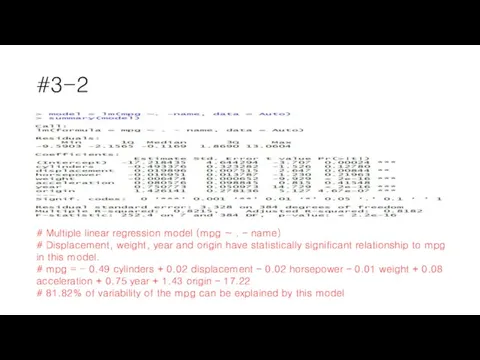
#3-2
# Multiple linear regression model (mpg ~ . – name)
# Displacement,
#3-2
# Multiple linear regression model (mpg ~ . – name)
# Displacement,
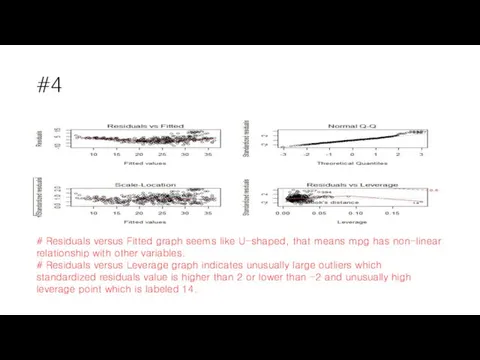
#4
# Residuals versus Fitted graph seems like U-shaped, that means mpg
#4
# Residuals versus Fitted graph seems like U-shaped, that means mpg
 Признаки параллельности двух прямых
 Свойства диагоналей четырехугольников
 Взаимно обратные числа
 Геометрияның негізгі ұғымдары
 Деление. Знак деления
 Вычитание числа 4
 Сравнение по модулю m
 История числа и цифры 1
 Умножение обыкновенных дробей. Правила умножения
 Занимательная математика для детей (устный счёт + учимся писать цифры)
 История математики. Развитие и становление. Возникновение арифметики и геометрии
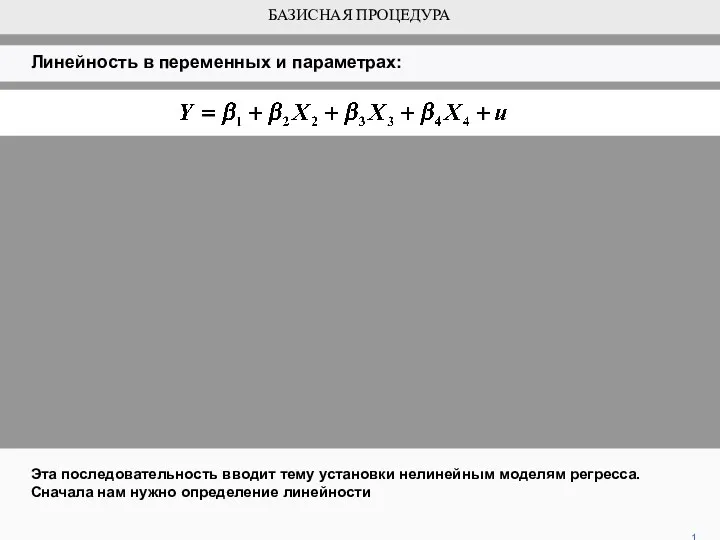 Базисная процедура. Линейность в переменных и параметрах
 Дискретные структуры. Теория множеств. Отношения
 Сложение и вычитание смешанных чисел
 Көпжақтар
 Неизвестное об известных квадратных уравнениях
 Средства измерений. Метрологические характеристики. Метрологические характеристики средств измерений
 Кому нужна математика
 Тела вращения
 Математические отношения
 Циліндр, його елементи. Переріз площинами
 Разложение многочлена на множители с помощью комбинации различных приемов
 Случаи вычитания 15 -
 Математика. Решение задач. 2 класс Школа России
 Презентация Урок математики в 4 классе
 Элементы дифференциального исчисления. Производые. Исследование (лекция 2)
 Третий признак равенства треугольников. Урок 21
 Координатная плоскость