Calculating the probability of a continuous random variable – Normal Distribution. Week 9 (1) презентация
- Calculating the probability of a continuous random variable – Normal Distribution. Week 9 (1)

Содержание
- 2. Mid-term exam statistics Copyright ©2015 Pearson Education, Inc. DR SUSANNE HANSEN SARAL
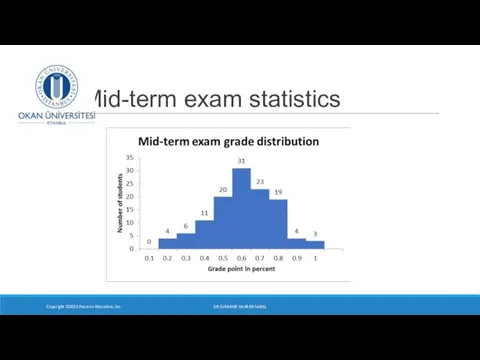
- 3. Copyright ©2015 Pearson Education, Inc. DR SUSANNE HANSEN SARAL Mid-term exam statistics
- 4. Continuous random variable A continuous random variable can assume any value in an interval on the
- 5. Calculating probabilities of continuous random variables COPYRIGHT © 2013 PEARSON EDUCATION, INC. PUBLISHING AS PRENTICE HALL
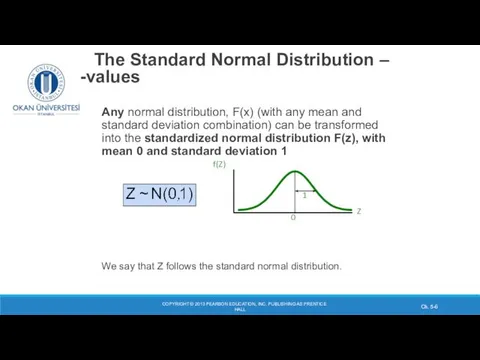
- 6. COPYRIGHT © 2013 PEARSON EDUCATION, INC. PUBLISHING AS PRENTICE HALL Ch. 5- The Standard Normal Distribution
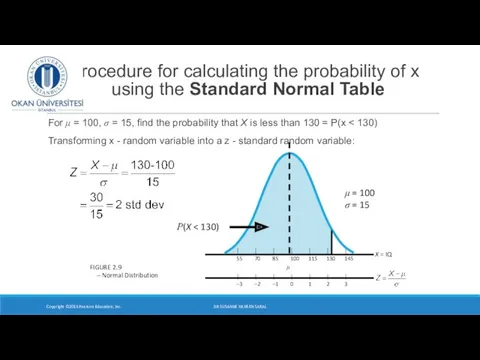
- 7. Procedure for calculating the probability of x using the Standard Normal Table For μ = 100,
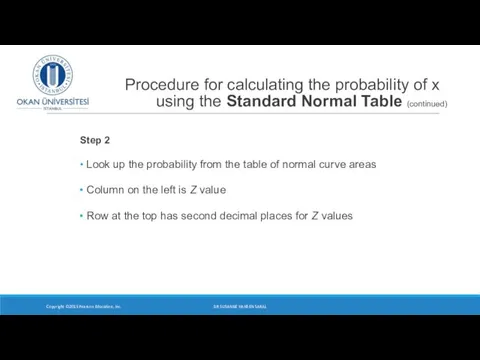
- 8. Procedure for calculating the probability of x using the Standard Normal Table (continued) Step 2 Look
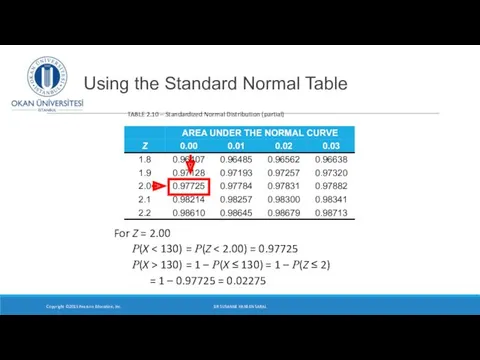
- 9. Using the Standard Normal Table Copyright ©2015 Pearson Education, Inc. TABLE 2.10 – Standardized Normal Distribution
- 10. P(z -2) = .9772 In probability terms, a z-score of -2.0 and +2.0 has the same
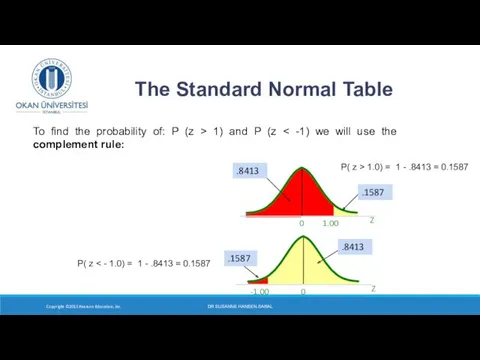
- 11. DR SUSANNE HANSEN SARAL Z 0 -1.00 Z 0 1.00 .8413 .1587 .8413 .1587 The Standard
- 12. Finding the probability of z-scores with two decimals and graph the probability P ( z P
- 13. Determine for shampoo filling machine 1 the proportion of bottles that:
- 15. Solution: Contain more than 505 ml
- 16. P ( z P (z > -1.05 ) = P (z P (z > - 3.34)
- 17. P ( z P (z > -1.05 ) = 0.8531 or 85.31 % P (z P
- 18. Haynes Construction Company Example Copyright ©2015 Pearson Education, Inc. FIGURE 2.10 DR SUSANNE HANSEN SARAL
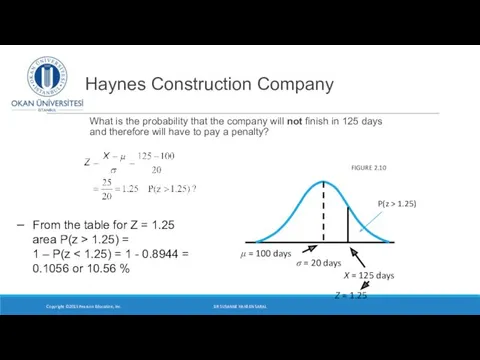
- 19. Haynes Construction Company Compute Z: Copyright ©2015 Pearson Education, Inc. FIGURE 2.10 From the table for
- 20. Compute Z Haynes Construction Company Copyright ©2015 Pearson Education, Inc. FIGURE 2.10 From the table for
- 21. Haynes Construction Company Copyright ©2015 Pearson Education, Inc. FIGURE 2.10 P(z > 1.25) DR SUSANNE HANSEN
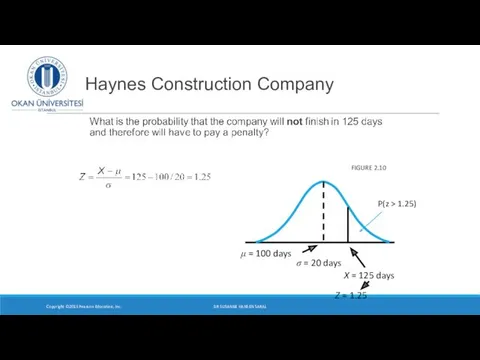
- 22. Haynes Construction Company What is the probability that the company will not finish in 125 days
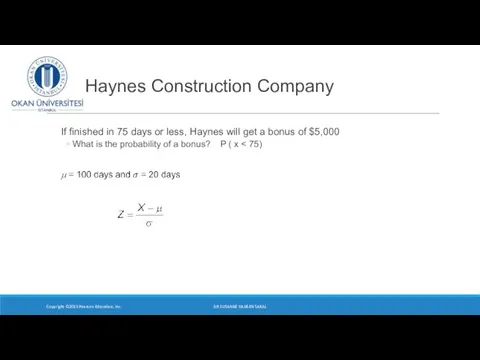
- 23. Haynes Construction Company If finished in 75 days or less, Haynes will get a bonus of
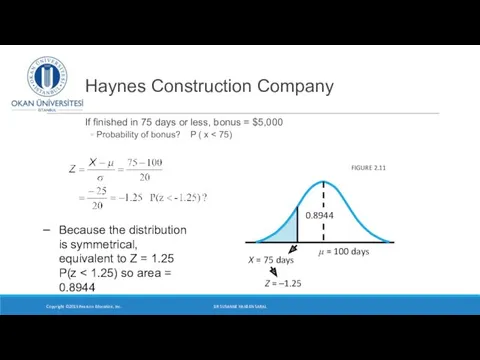
- 24. Haynes Construction Company If finished in 75 days or less, bonus = $5,000 Probability of bonus?
- 25. If finished in 75 days or less, bonus = $5,000 Probability of bonus? Haynes Construction Company
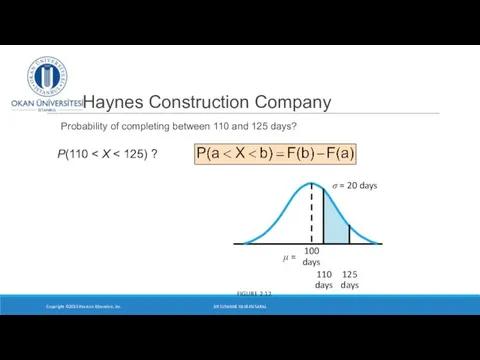
- 26. Haynes Construction Company Probability of completing between 110 and 125 days? Copyright ©2015 Pearson Education, Inc.
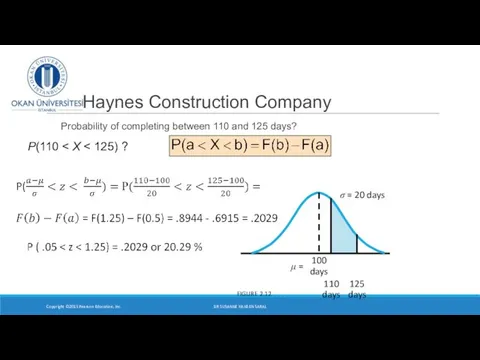
- 27. Haynes Construction Company Probability of completing between 110 and 125 days? Copyright ©2015 Pearson Education, Inc.
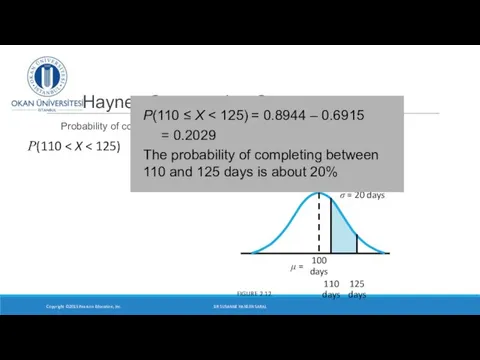
- 28. Haynes Construction Company Probability of completing between 110 and 125 days? Copyright ©2015 Pearson Education, Inc.
- 30. Скачать презентацию
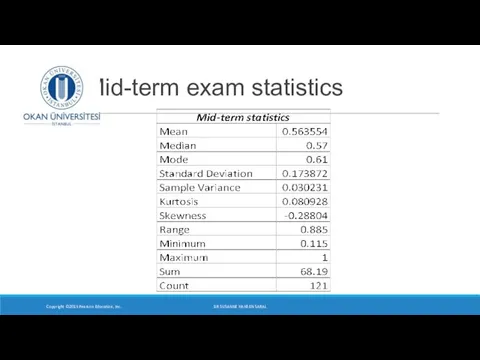
Mid-term exam statistics
Copyright ©2015 Pearson Education, Inc.
DR SUSANNE HANSEN SARAL
Mid-term exam statistics
Copyright ©2015 Pearson Education, Inc.
DR SUSANNE HANSEN SARAL
Copyright ©2015 Pearson Education, Inc.
DR SUSANNE HANSEN SARAL
Mid-term exam statistics
Copyright ©2015 Pearson Education, Inc.
DR SUSANNE HANSEN SARAL
Mid-term exam statistics
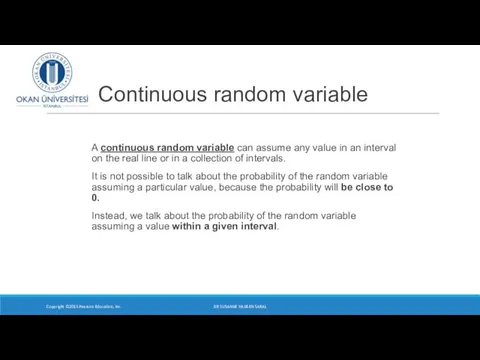
Continuous random variable
A continuous random variable can assume any value in
Continuous random variable
A continuous random variable can assume any value in
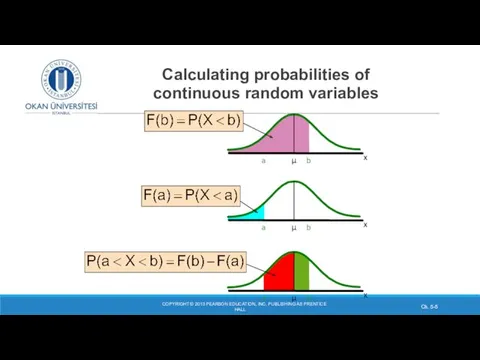
Calculating probabilities of
continuous random variables
COPYRIGHT © 2013
Calculating probabilities of
continuous random variables
COPYRIGHT © 2013
COPYRIGHT © 2013 PEARSON EDUCATION, INC. PUBLISHING AS PRENTICE HALL
Ch.
COPYRIGHT © 2013 PEARSON EDUCATION, INC. PUBLISHING AS PRENTICE HALL
Ch.
Procedure for calculating the probability of x
using the Standard Normal
Procedure for calculating the probability of x using the Standard Normal
Procedure for calculating the probability of x
using the Standard
Procedure for calculating the probability of x using the Standard
Using the Standard Normal Table
Copyright ©2015 Pearson Education, Inc.
TABLE 2.10 –
Using the Standard Normal Table
Copyright ©2015 Pearson Education, Inc.
TABLE 2.10 –
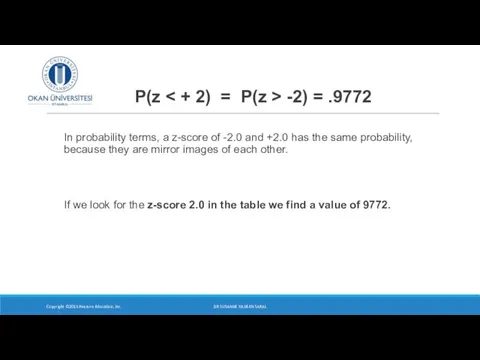
P(z < + 2) = P(z > -2) = .9772
In
P(z < + 2) = P(z > -2) = .9772
In
DR SUSANNE HANSEN SARAL
Z
0
-1.00
Z
0
1.00
.8413
.1587
.8413
.1587
The Standard Normal Table
Copyright ©2015 Pearson Education,
DR SUSANNE HANSEN SARAL
Z
0
-1.00
Z
0
1.00
.8413
.1587
.8413
.1587
The Standard Normal Table
Copyright ©2015 Pearson Education,
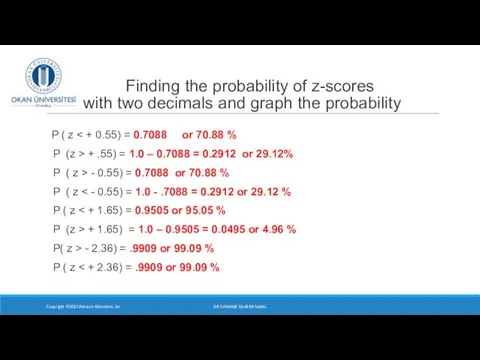
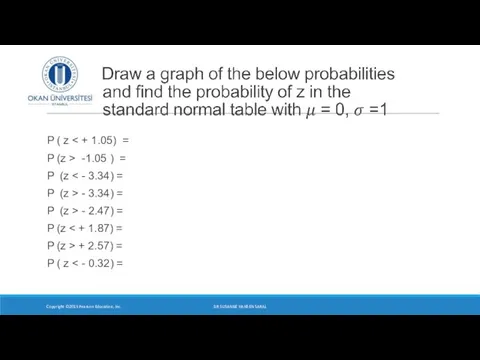
Finding the probability of z-scores with two decimals and graph
Finding the probability of z-scores with two decimals and graph
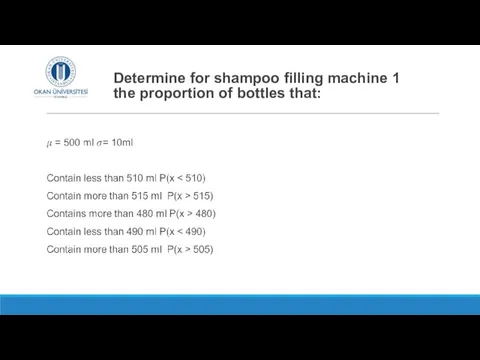
Determine for shampoo filling machine 1 the proportion of bottles that:
Determine for shampoo filling machine 1 the proportion of bottles that:
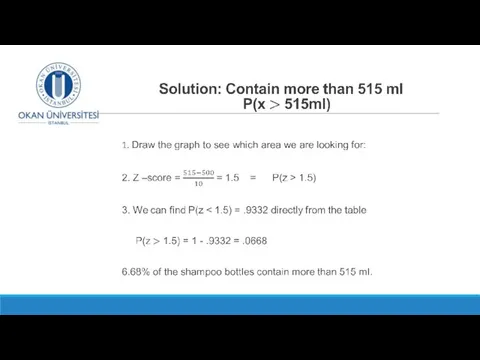
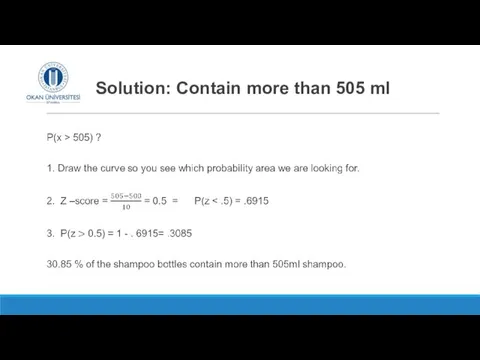
Solution: Contain more than 505 ml
Solution: Contain more than 505 ml
P ( z < + 1.05) =
P (z > -1.05 )
P ( z < + 1.05) =
P (z > -1.05 )
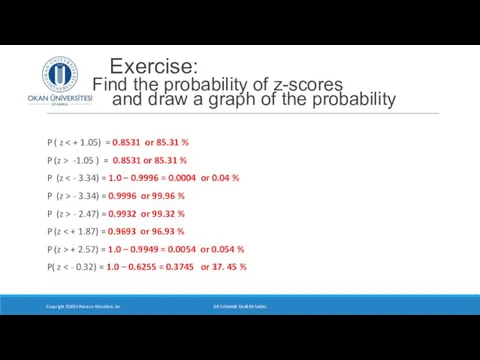
P ( z < + 1.05) = 0.8531 or 85.31
P ( z < + 1.05) = 0.8531 or 85.31
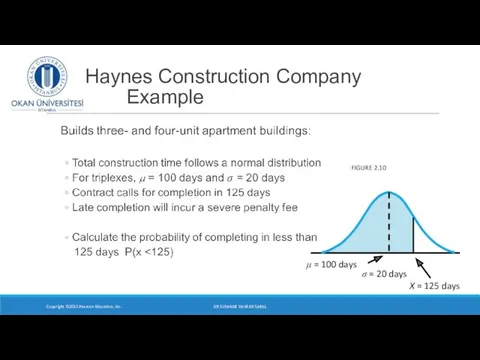
Haynes Construction Company
Example
Copyright ©2015 Pearson Education, Inc.
FIGURE 2.10
DR SUSANNE
Haynes Construction Company
Example
Copyright ©2015 Pearson Education, Inc.
FIGURE 2.10
DR SUSANNE
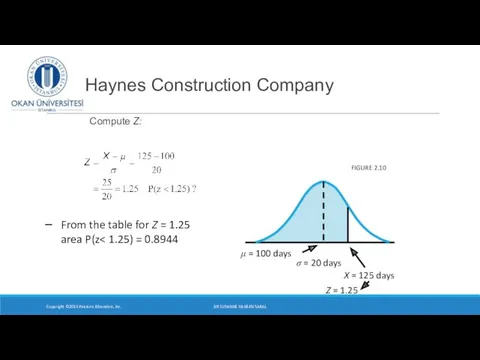
Haynes Construction Company
Compute Z:
Copyright ©2015 Pearson Education, Inc.
FIGURE 2.10
From the
Haynes Construction Company
Compute Z:
Copyright ©2015 Pearson Education, Inc.
FIGURE 2.10
From the
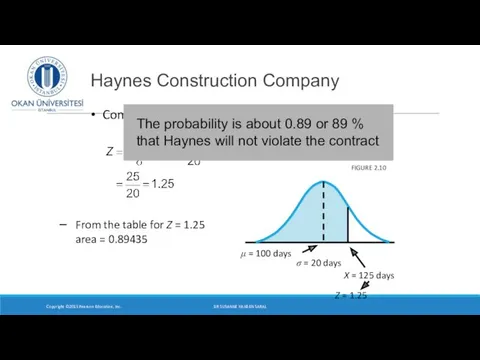
Compute Z
Haynes Construction Company
Copyright ©2015 Pearson Education, Inc.
FIGURE 2.10
From the
Compute Z
Haynes Construction Company
Copyright ©2015 Pearson Education, Inc.
FIGURE 2.10
From the
Haynes Construction Company
Copyright ©2015 Pearson Education, Inc.
FIGURE 2.10
P(z > 1.25)
Haynes Construction Company
Copyright ©2015 Pearson Education, Inc.
FIGURE 2.10
P(z > 1.25)
Haynes Construction Company
What is the probability that the company will
Haynes Construction Company
What is the probability that the company will
Haynes Construction Company
If finished in 75 days or less, Haynes
Haynes Construction Company
If finished in 75 days or less, Haynes
Haynes Construction Company
If finished in 75 days or less, bonus
Haynes Construction Company
If finished in 75 days or less, bonus
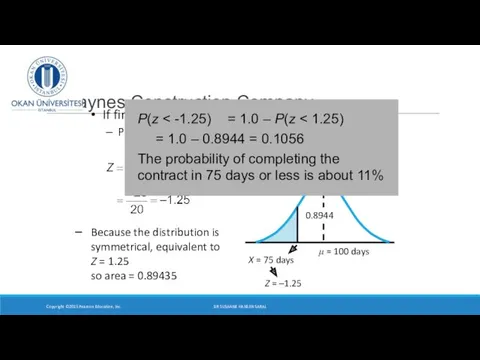
If finished in 75 days or less, bonus = $5,000
Probability of
If finished in 75 days or less, bonus = $5,000
Probability of
Haynes Construction Company
Probability of completing between 110 and 125 days?
Copyright
Haynes Construction Company
Probability of completing between 110 and 125 days?
Copyright
Haynes Construction Company
Probability of completing between 110 and 125 days?
Copyright
Haynes Construction Company
Probability of completing between 110 and 125 days?
Copyright
Haynes Construction Company
Probability of completing between 110 and 125 days?
Copyright
Haynes Construction Company
Probability of completing between 110 and 125 days?
Copyright
 Действие с многочленами. 7 класс
 Бесконечно малые, бесконечно большие функции, их свойства. Теоремы о пределе функции, замечательные пределы
 Математическое моделирование автоматических систем регулирования
 Задача и алгоритм Прима
 Электрорадиоизмерения и метрология. Урок №5. Тема 1.3. Средства измерений
 Задача по математике (4 класс)
 Задания типа С5
 Многоугольники. Примеры многоугольников
 Показательная функция, ее свойства и график
 Графический диктант 6. 5 класс
 Урок математики во 2 классе Свойства умножения и деления. Площадь прямоугольника
 Процесс решения задачи, как вид деятельности учащихся
 Теория вероятностей
 Преобразование графиков функций
 Параллельность в пространстве. (Графическая работа 2)
 Таралым параметрлерінің физикалық мағынасы
 Эконометрика. Эконометрическое моделирование
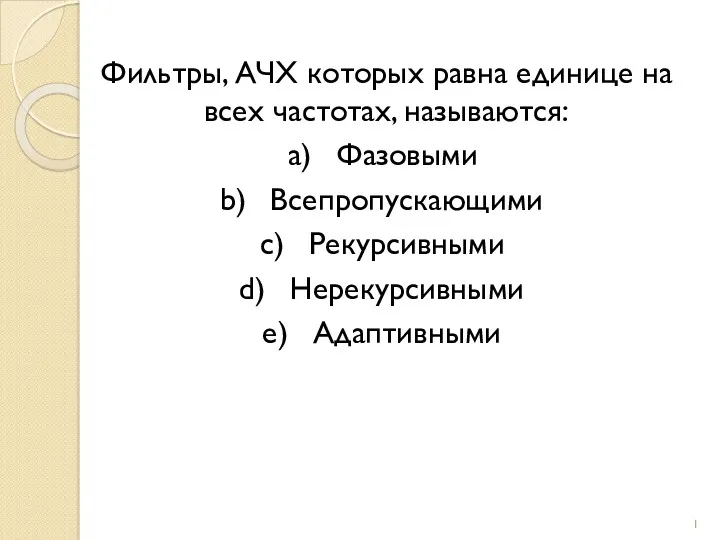 Преобразования. Оконное преобразование Фурье. Области применения и ограничения оконного преобразования Фурье
 Тест по теме Сложение и вычитание с поддержкой макроса
 Задачи на смекалку
 Решение уравнений. 2 класс
 Площадь прямоугольника. Площадь параллелограмма и ромба
 Симметрия. Урок математики для учащихся 4 класса
 Правила построения рядов динамики
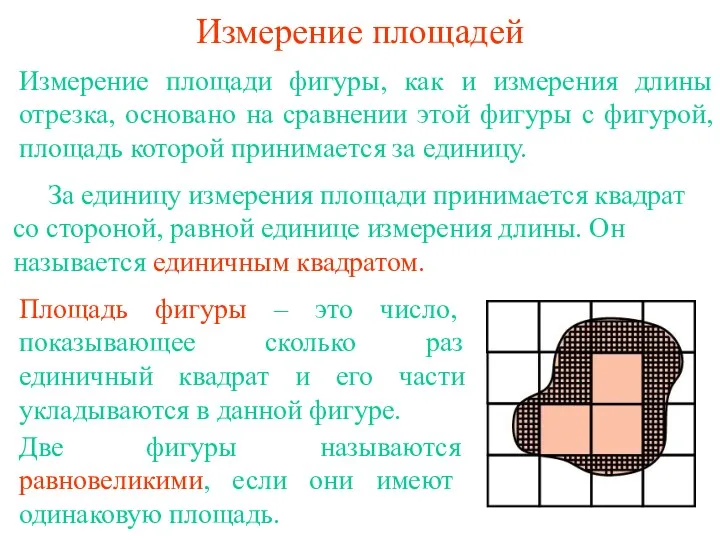 Измерение площадей
 Урок математики в 1 классе по системе Л. В. Занкова Верные и неверные равенства и неравенства
 Конспект занятия по ФЭМП (+ презентация)
 Решение систем уравнений второй степени