- Intro to machine learning

Содержание
- 2. Recap What is machine learning? Why learn/estimate? Predictors and response variables Types of learning Regression and
- 3. Today’s Objectives What is linear regression? Why study linear regression? What can we use it for?
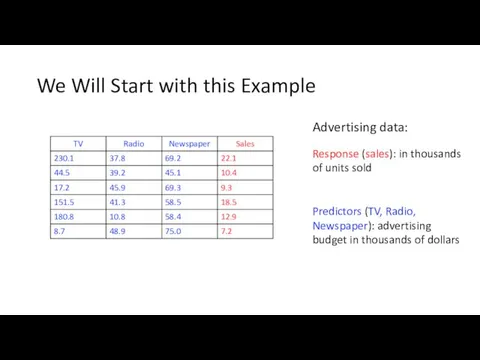
- 4. We Will Start with this Example Advertising data: Response (sales): in thousands of units sold Predictors
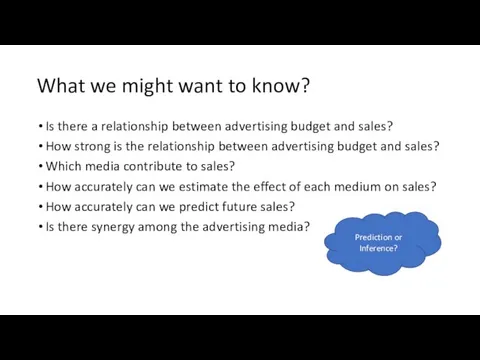
- 5. What we might want to know? Is there a relationship between advertising budget and sales? How
- 6. What we might want to know? Is there a relationship between advertising budget and sales? How
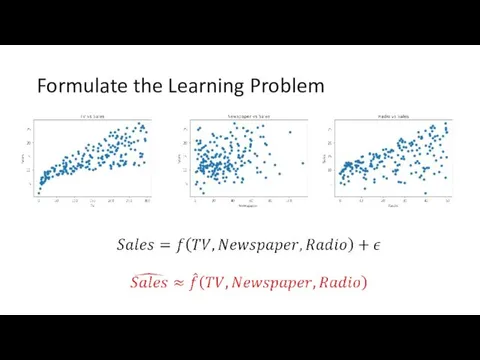
- 7. Formulate the Learning Problem
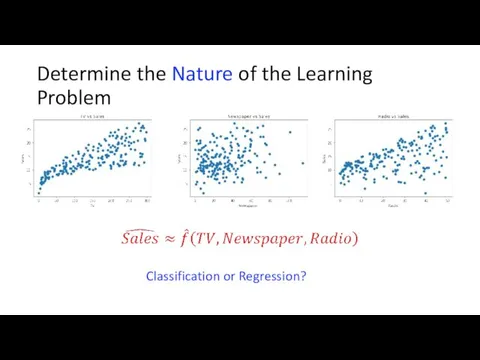
- 8. Determine the Nature of the Learning Problem Classification or Regression?
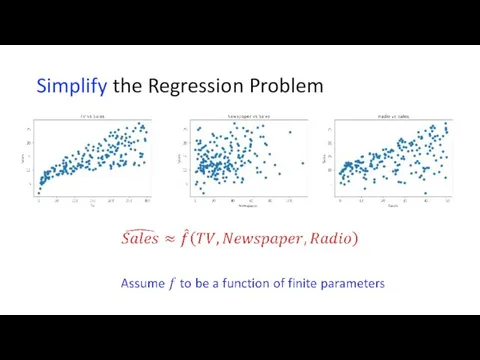
- 9. Simplify the Regression Problem
- 10. Further Simplify the Regression Problem
- 11. Which Brings us to Linear Regression! Linear Regression
- 12. Linear Regression A simple supervised learning approach Assumes a linear relationship between the predictors and the
- 13. Why study linear regression? Although it may seem overly simplistic, linear regression is extremely useful both
- 14. Estimating LR Parameters by Least Squares (1)
- 15. Estimating Parameters by Least Squares (2) Residual sum of squares
- 16. Estimating Parameters by Least Squares (3)
- 17. Estimating Parameters by Least Squares (4) Contour and three-dimensional plots of the RSS
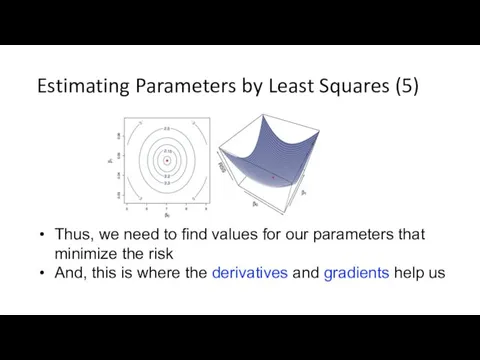
- 18. Estimating Parameters by Least Squares (5) Thus, we need to find values for our parameters that
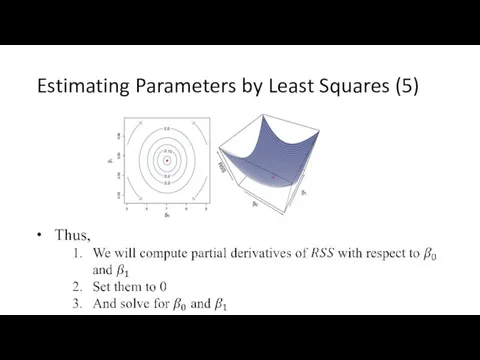
- 19. Estimating Parameters by Least Squares (5)
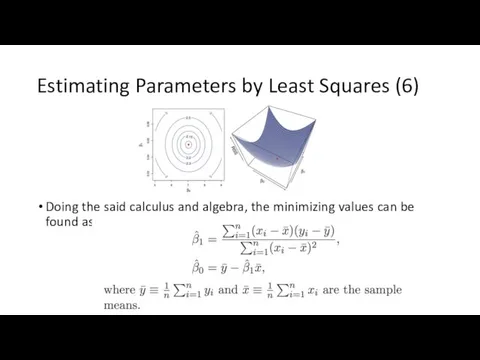
- 20. Estimating Parameters by Least Squares (6) Doing the said calculus and algebra, the minimizing values can
- 21. See it for the Intercept. For ease I did not use the hat symbol
- 22. Geometry of Least Square Regression
- 23. For our Sales Example
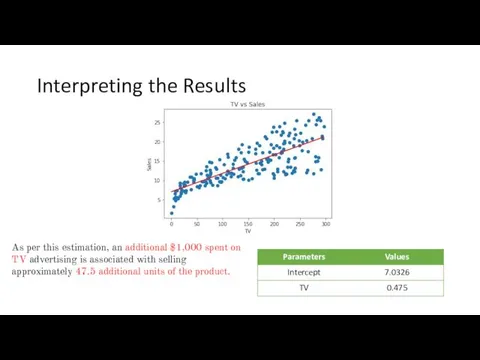
- 24. Interpreting the Results As per this estimation, an additional $1,000 spent on TV advertising is associated
- 25. Now that we have the estimates, what is next? Goodness of fit Goodness of estimate
- 26. Now that we have estimates, what is next? Goodness of fit (How best does the chosen
- 27. Goodness of Estimate (1) Is there really a relationship between sales (response) and TV (predictor)? Mathematically
- 28. Goodness of Estimate (2) Is there really a relationship between sales (response) and TV (predictor)? For
- 29. Aside: SE
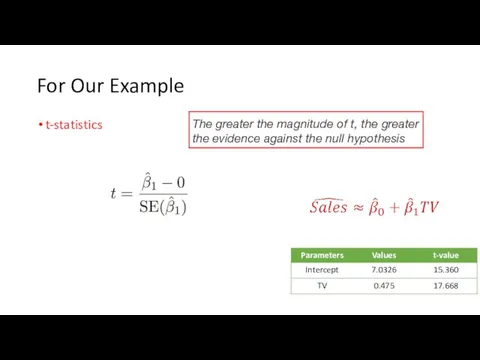
- 30. For Our Example t-statistics The greater the magnitude of t, the greater the evidence against the
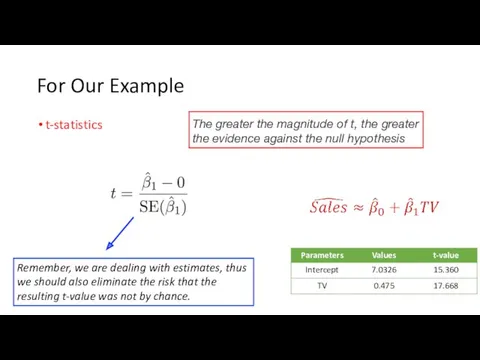
- 31. For Our Example t-statistics The greater the magnitude of t, the greater the evidence against the
- 32. Chances of getting the Resulting t-value
- 33. Was our Assumption about the Model Correct?
- 34. R-squared: how much do we gain by using the learned models instead of using the mean
- 35. For Our Example
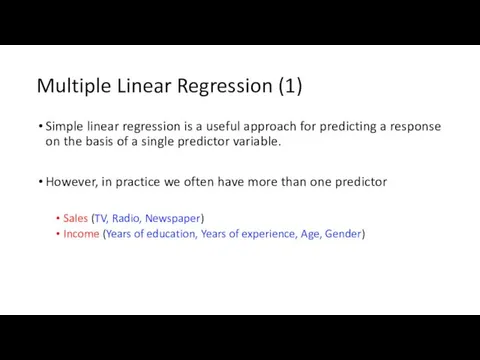
- 36. Multiple Linear Regression (1) Simple linear regression is a useful approach for predicting a response on
- 37. Multiple Linear Regression (2)
- 38. Multiple Linear Regression (3)
- 39. Multiple Linear Regression (4)
- 40. Multiple Linear Regression (5) For two predictors, the regression might look as follows
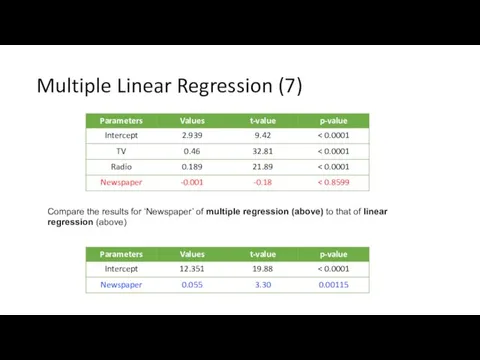
- 41. For the Advertising data, least squares coefficient estimates of the multiple linear regression of number of
- 42. Compare the results for ‘Newspaper’ of multiple regression (above) to that of linear regression (above) Multiple
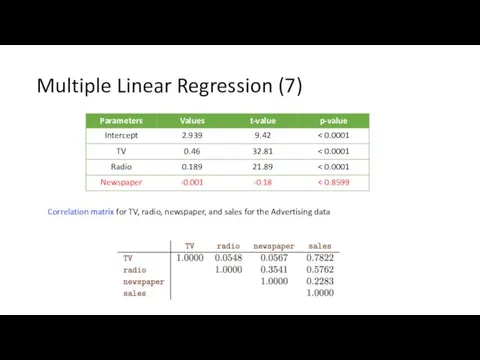
- 43. Correlation matrix for TV, radio, newspaper, and sales for the Advertising data Multiple Linear Regression (7)
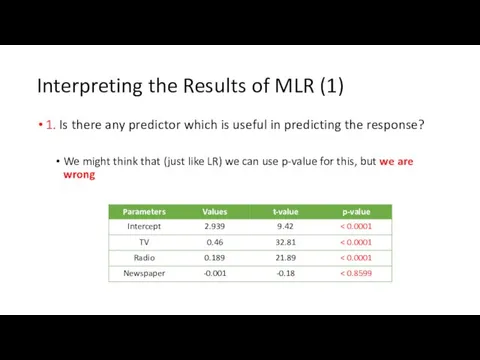
- 44. Interpreting the Results of MLR (1) 1. Is there any predictor which is useful in predicting
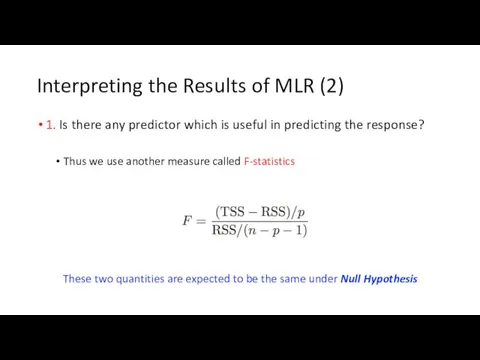
- 45. Interpreting the Results of MLR (2) 1. Is there any predictor which is useful in predicting
- 46. Interpreting the Results of MLR (3) 1. Is there any predictor which is useful in predicting
- 47. Interpreting the Results of MLR (4) 1. Is there any predictor which is useful in predicting
- 48. Interpreting the Results of MLR (5) 2. Do all the predictors help explain the response or
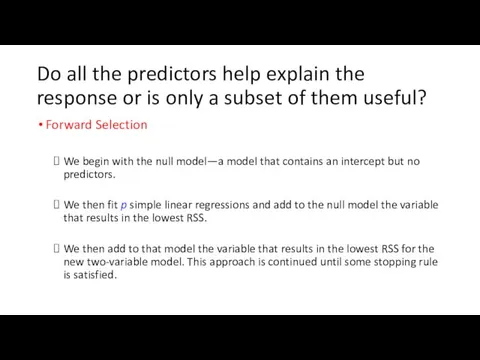
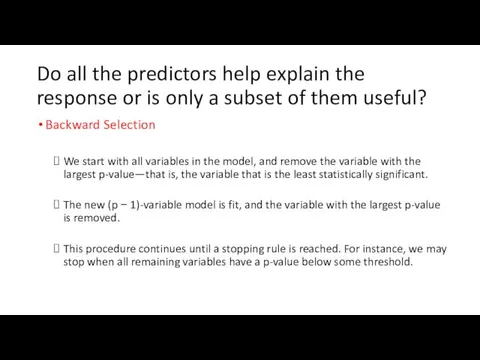
- 49. Do all the predictors help explain the response or is only a subset of them useful?
- 50. Do all the predictors help explain the response or is only a subset of them useful?
- 51. Do all the predictors help explain the response or is only a subset of them useful?
- 52. Interpreting the Results of MLR (6) 3. How well does the model fit the data? Same
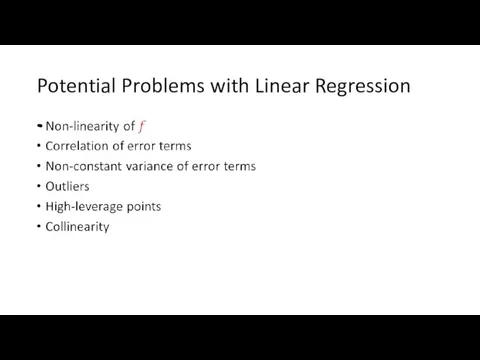
- 53. Potential Problems with Linear Regression
- 55. Скачать презентацию
Recap
What is machine learning?
Why learn/estimate?
Predictors and response variables
Types of learning
Regression and
Recap
What is machine learning?
Why learn/estimate?
Predictors and response variables
Types of learning
Regression and
Today’s Objectives
What is linear regression?
Why study linear regression?
What can we use
Today’s Objectives
What is linear regression?
Why study linear regression?
What can we use
We Will Start with this Example
Advertising data:
Response (sales): in thousands
We Will Start with this Example
Advertising data:
Response (sales): in thousands
What we might want to know?
Is there a relationship between advertising
What we might want to know?
Is there a relationship between advertising
What we might want to know?
Is there a relationship between advertising
What we might want to know?
Is there a relationship between advertising
Formulate the Learning Problem
Formulate the Learning Problem
Determine the Nature of the Learning Problem
Classification or Regression?
Determine the Nature of the Learning Problem
Classification or Regression?
Simplify the Regression Problem
Simplify the Regression Problem
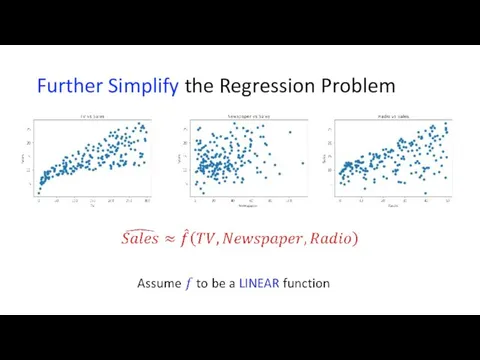
Further Simplify the Regression Problem
Further Simplify the Regression Problem
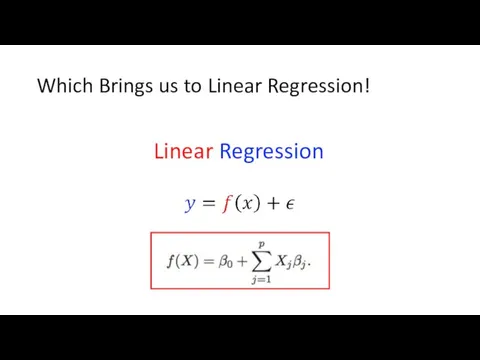
Which Brings us to Linear Regression!
Linear Regression
Which Brings us to Linear Regression!
Linear Regression
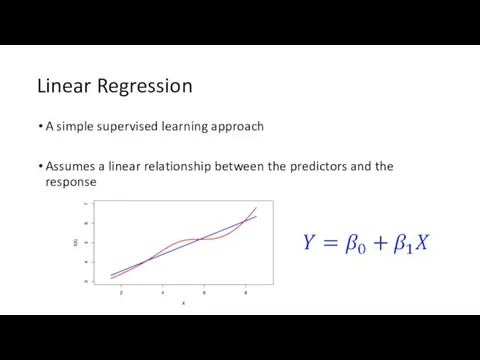
Linear Regression
A simple supervised learning approach
Assumes a linear relationship between the
Linear Regression
A simple supervised learning approach
Assumes a linear relationship between the
Why study linear regression?
Although it may seem overly simplistic, linear regression
Why study linear regression?
Although it may seem overly simplistic, linear regression
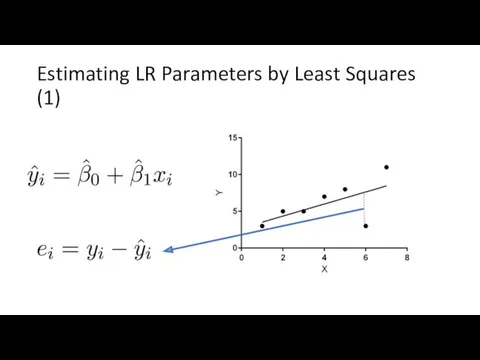
Estimating LR Parameters by Least Squares (1)
Estimating LR Parameters by Least Squares (1)
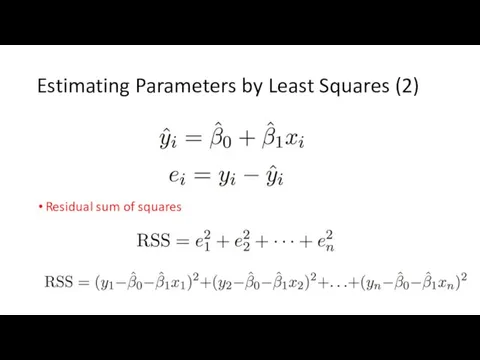
Estimating Parameters by Least Squares (2)
Residual sum of squares
Estimating Parameters by Least Squares (2)
Residual sum of squares
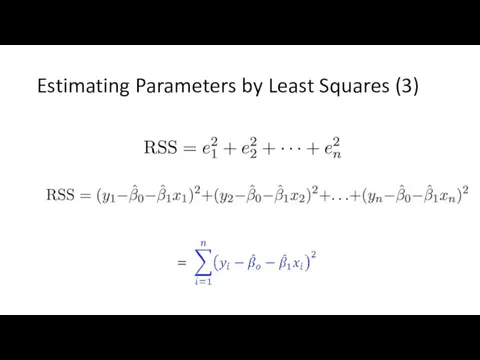
Estimating Parameters by Least Squares (3)
Estimating Parameters by Least Squares (3)
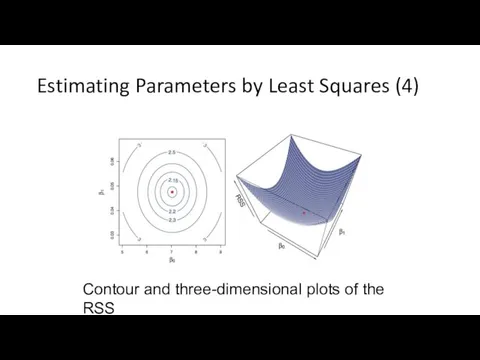
Estimating Parameters by Least Squares (4)
Contour and three-dimensional plots of the
Estimating Parameters by Least Squares (4)
Contour and three-dimensional plots of the
Estimating Parameters by Least Squares (5)
Thus, we need to find values
Estimating Parameters by Least Squares (5)
Thus, we need to find values
Estimating Parameters by Least Squares (5)
Estimating Parameters by Least Squares (5)
Estimating Parameters by Least Squares (6)
Doing the said calculus and algebra,
Estimating Parameters by Least Squares (6)
Doing the said calculus and algebra,
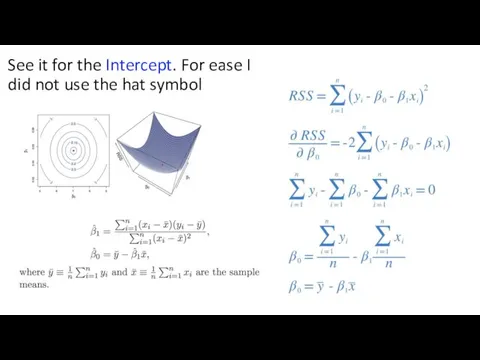
See it for the Intercept. For ease I did not use
See it for the Intercept. For ease I did not use
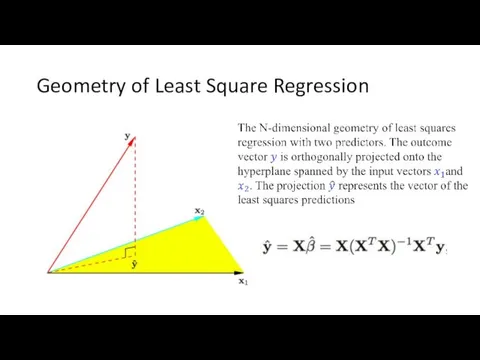
Geometry of Least Square Regression
Geometry of Least Square Regression
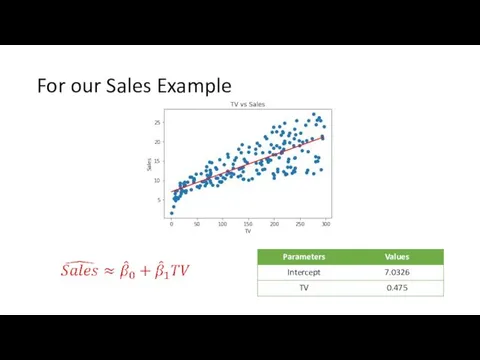
For our Sales Example
For our Sales Example
Interpreting the Results
As per this estimation, an additional $1,000 spent on
Interpreting the Results
As per this estimation, an additional $1,000 spent on
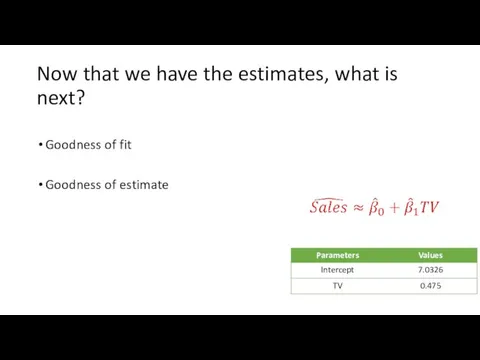
Now that we have the estimates, what is next?
Goodness of fit
Goodness
Now that we have the estimates, what is next?
Goodness of fit
Goodness
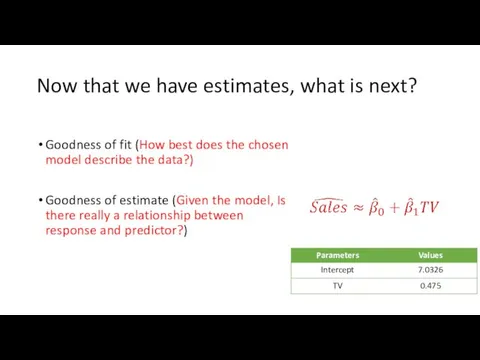
Now that we have estimates, what is next?
Goodness of fit (How
Now that we have estimates, what is next?
Goodness of fit (How
Goodness of Estimate (1)
Is there really a relationship between sales (response)
Goodness of Estimate (1)
Is there really a relationship between sales (response)
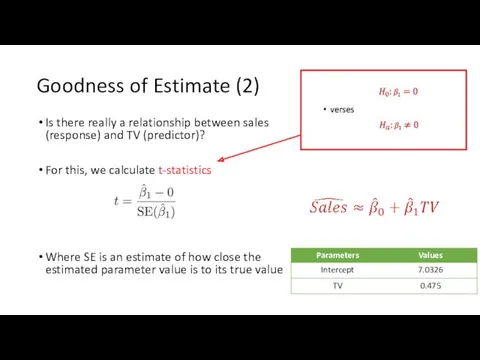
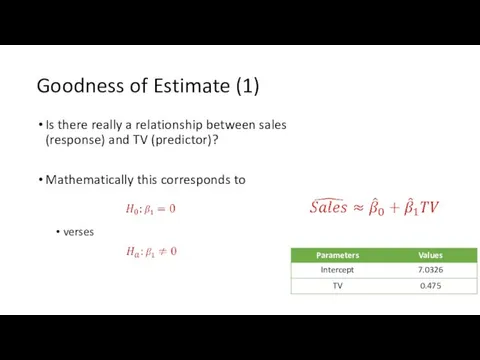
Goodness of Estimate (2)
Is there really a relationship between sales (response)
Goodness of Estimate (2)
Is there really a relationship between sales (response)
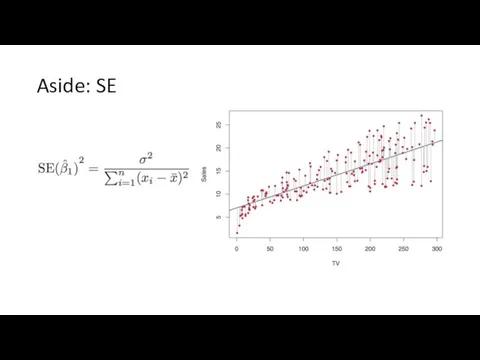
Aside: SE
Aside: SE
For Our Example
t-statistics
The greater the magnitude of t, the greater the
For Our Example
t-statistics
The greater the magnitude of t, the greater the
For Our Example
t-statistics
The greater the magnitude of t, the greater the
For Our Example
t-statistics
The greater the magnitude of t, the greater the
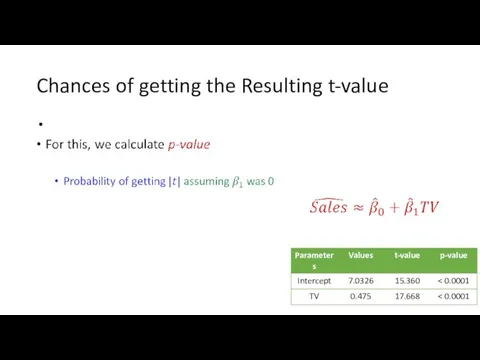
Chances of getting the Resulting t-value
Chances of getting the Resulting t-value
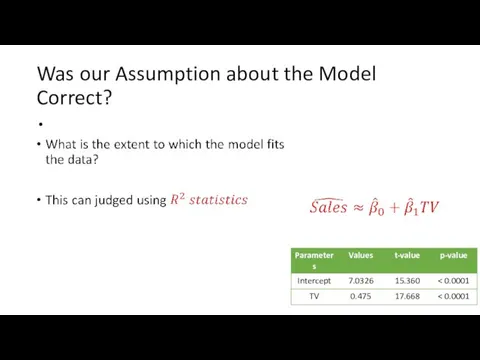
Was our Assumption about the Model Correct?
Was our Assumption about the Model Correct?
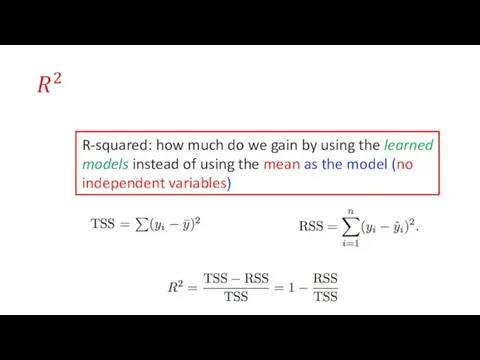
R-squared: how much do we gain by using the learned models
R-squared: how much do we gain by using the learned models
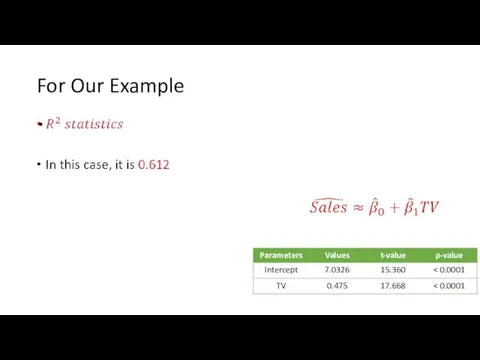
For Our Example
For Our Example
Multiple Linear Regression (1)
Simple linear regression is a useful approach for
Multiple Linear Regression (1)
Simple linear regression is a useful approach for
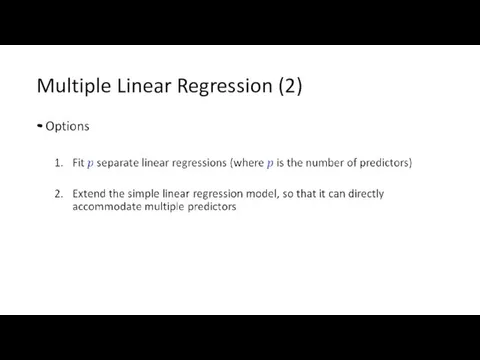
Multiple Linear Regression (2)
Multiple Linear Regression (2)
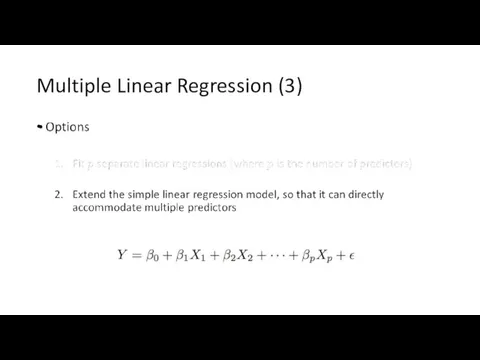
Multiple Linear Regression (3)
Multiple Linear Regression (3)
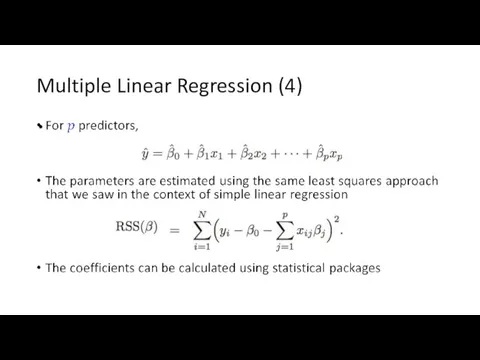
Multiple Linear Regression (4)
Multiple Linear Regression (4)
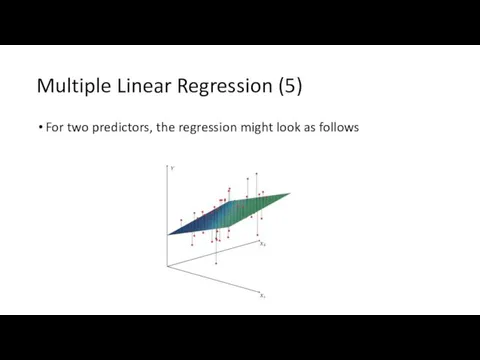
Multiple Linear Regression (5)
For two predictors, the regression might look as
Multiple Linear Regression (5)
For two predictors, the regression might look as
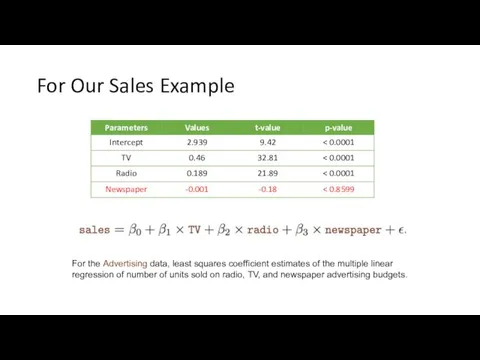
For the Advertising data, least squares coefficient estimates of the multiple
For the Advertising data, least squares coefficient estimates of the multiple
Compare the results for ‘Newspaper’ of multiple regression (above) to that
Compare the results for ‘Newspaper’ of multiple regression (above) to that
Correlation matrix for TV, radio, newspaper, and sales for the Advertising
Correlation matrix for TV, radio, newspaper, and sales for the Advertising
Interpreting the Results of MLR (1)
1. Is there any predictor which
Interpreting the Results of MLR (1)
1. Is there any predictor which
Interpreting the Results of MLR (2)
1. Is there any predictor which
Interpreting the Results of MLR (2)
1. Is there any predictor which
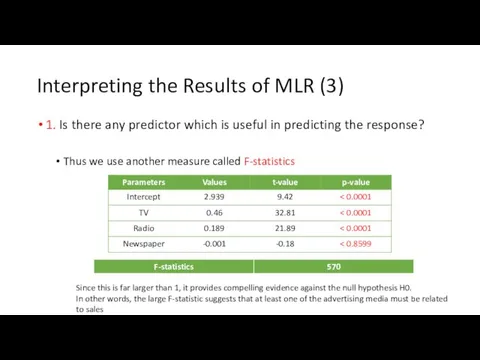
Interpreting the Results of MLR (3)
1. Is there any predictor which
Interpreting the Results of MLR (3)
1. Is there any predictor which
Interpreting the Results of MLR (4)
1. Is there any predictor which
Interpreting the Results of MLR (4)
1. Is there any predictor which
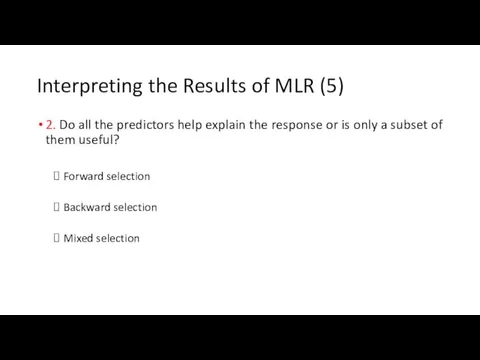
Interpreting the Results of MLR (5)
2. Do all the predictors help
Interpreting the Results of MLR (5)
2. Do all the predictors help
Do all the predictors help explain the response or is only
Do all the predictors help explain the response or is only
Do all the predictors help explain the response or is only
Do all the predictors help explain the response or is only
Do all the predictors help explain the response or is only
Do all the predictors help explain the response or is only
Interpreting the Results of MLR (6)
3. How well does the model
Interpreting the Results of MLR (6)
3. How well does the model
Potential Problems with Linear Regression
Potential Problems with Linear Regression
 Системы уравнений с двумя переменными. Часть 8
 Вероятность и статистика на ЕГЭ. Типовые задания
 Дидактическая игра на уроке математики в 1 классе
 Приёмы письменного деления на однозначное число
 Разработка урока+презентация по теме Сложение и вычитание в пределах 10 (обобщение знаний)1 класс
 Корреляционный и регрессионный анализ
 synus_kosynus_tangens_gostrogo_kuta_pryamokutnogo_trykutnyka
 Задачи на движение. Скорость
 Действия с десятичными дробями
 Четыре замечательные точки треугольника
 Виды треугольников
 Устный счет для 2 класса по УМК Начальная школа 21 века
 Умножение натуральных чисел
 урок фгос 4 класс Решение задач
 Возможности программ динамической геометрии в проведении учебного исследования и проекта по математике
 Презентация и конспект урока по теме: Квадрат и куб
 Прямоугольник, ромб, квадрат
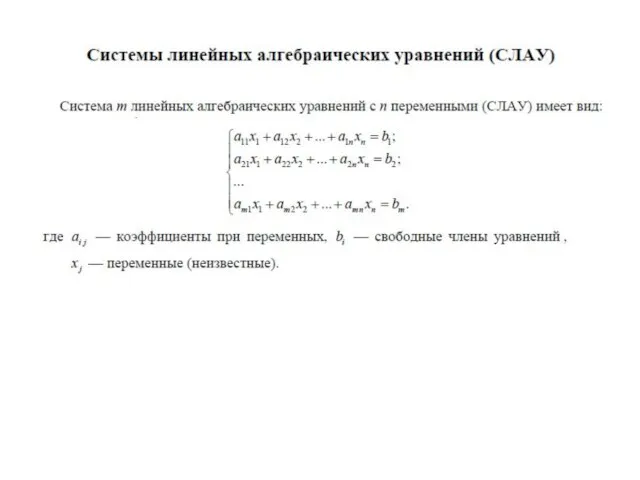 Системы линейных алгебраических уравнений (СЛАУ)
 Информатика в задачах теплоэнергетики
 Умножение десятичных дробей
 Сложение и вычитание вида 26±10
 Презентация к уроку математики в 4 классе
 Презентация к уроку в 1-м классе Сложение и вычитание отрезков
 Тікбұрышты параллелепипед көлемі
 Деление десятичной дроби на десятичную дробь
 Решение показательных уравнений
 Умножение на двузначное число. Площадь прямоугольника
 Решение задач по теме Площадь