- Introductory Statistics 1. AP Statistics

Содержание
- 2. Statistics – a definition Statistics is the science and, arguably, also the art of learning from
- 3. Variables A variable is a characteristic or condition that can change or take on different values.
- 4. Population The entire group of individuals is called the population. For example, a researcher may be
- 5. Sample Usually populations are so large that a researcher cannot examine the entire group. Therefore, a
- 7. Types of Variables Variables can be classified as discrete or continuous. Discrete variables (such as class
- 8. Measuring Variables To establish relationships between variables, researchers must observe the variables and record their observations.
- 9. 4 Types of Measurement Scales A nominal scale is an unordered set of categories identified only
- 10. 4 Types of Measurement Scales 3. An interval scale is an ordered series of equal-sized categories.
- 11. Quantitative versus qualitative variables Quantitative means it can be counted, like “number of people per square
- 12. Quantitative versus qualitative variables (2) Simplest way to decide: can you add them? - can you
- 13. A little break from statistics – practical organization of course The course is given by two
- 14. Practical organization (2) Mr. Daukeev will give you homework to do I may also give you
- 15. Practical organization (3) I will also give surprise quizzes – be prepared all the time. Course
- 16. Practical organization – self study Seek out self-study guides, and help online Stattrek.com – AP tutorials
- 17. Practical organization (4) Your grade will depend on Your presence, your participation (have nametags in front
- 18. Practical organization (5) I do not accept doctor’s notes. (I do not know if Mr. Daukeev
- 19. Back to Statistics – visual representation of data: Bar Charts Horizontal rectangles (bars) chart in which
- 20. Bar charts (2) – an example Further examples given on the board. Example 1: temperature in
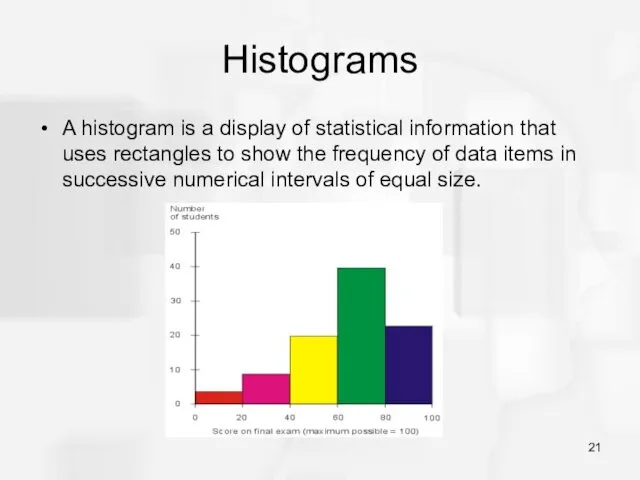
- 21. Histograms A histogram is a display of statistical information that uses rectangles to show the frequency
- 22. Histograms (2) It differs from a bar graph, in the sense that a bar graph relates
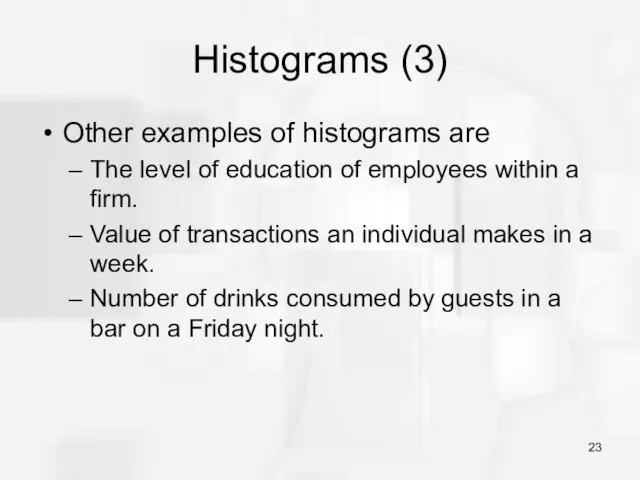
- 23. Histograms (3) Other examples of histograms are The level of education of employees within a firm.
- 24. Frequency As you can see, histograms are a good representation of frequency. Definition: frequency is the
- 25. Relative frequency Definition: how often an event happens divided by the sum of all possibilities. Example:
- 26. Cumulative frequency You’re interested in studying a population to find out a “more” or “less” question.
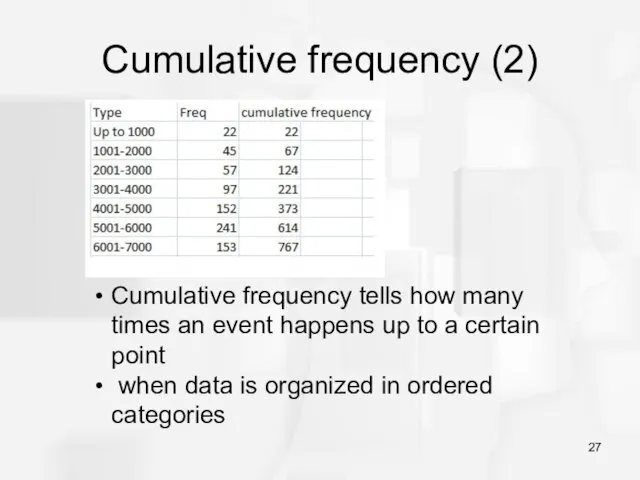
- 27. Cumulative frequency (2) Cumulative frequency tells how many times an event happens up to a certain
- 29. Скачать презентацию
Statistics – a definition
Statistics is the science and, arguably, also the
Statistics – a definition
Statistics is the science and, arguably, also the

Variables
A variable is a characteristic or condition that can change or
Variables
A variable is a characteristic or condition that can change or
Population
The entire group of individuals is called the population.
For example,
Population
The entire group of individuals is called the population.
For example,
Sample
Usually populations are so large that a researcher cannot examine the
Sample
Usually populations are so large that a researcher cannot examine the

Types of Variables
Variables can be classified as discrete or continuous.
Types of Variables
Variables can be classified as discrete or continuous.
Measuring Variables
To establish relationships between variables, researchers must observe the variables
Measuring Variables
To establish relationships between variables, researchers must observe the variables
4 Types of Measurement Scales
A nominal scale is an unordered set
4 Types of Measurement Scales
A nominal scale is an unordered set

4 Types of Measurement Scales
3. An interval scale is an ordered
4 Types of Measurement Scales
3. An interval scale is an ordered

Quantitative versus qualitative variables
Quantitative means it can be counted, like “number
Quantitative versus qualitative variables
Quantitative means it can be counted, like “number

Quantitative versus qualitative variables (2)
Simplest way to decide: can you
Quantitative versus qualitative variables (2)
Simplest way to decide: can you

A little break from statistics – practical organization of course
The course
A little break from statistics – practical organization of course
The course

Practical organization (2)
Mr. Daukeev will give you homework to do
I may
Practical organization (2)
Mr. Daukeev will give you homework to do
I may
Practical organization (3)
I will also give surprise quizzes – be prepared
Practical organization (3)
I will also give surprise quizzes – be prepared
Practical organization – self study
Seek out self-study guides, and help online
Stattrek.com
Practical organization – self study
Seek out self-study guides, and help online
Stattrek.com

Practical organization (4)
Your grade will depend on
Your presence, your participation (have
Practical organization (4)
Your grade will depend on
Your presence, your participation (have
Practical organization (5)
I do not accept doctor’s notes. (I do not
Practical organization (5)
I do not accept doctor’s notes. (I do not
Back to Statistics – visual representation of data: Bar Charts
Horizontal rectangles
Back to Statistics – visual representation of data: Bar Charts
Horizontal rectangles

Bar charts (2) – an example
Further examples given on the board.
Example
Bar charts (2) – an example
Further examples given on the board.
Example
Histograms
A histogram is a display of statistical information that uses rectangles
Histograms
A histogram is a display of statistical information that uses rectangles
Histograms (2)
It differs from a bar graph, in the sense that a
Histograms (2)
It differs from a bar graph, in the sense that a
Histograms (3)
Other examples of histograms are
The level of education of employees
Histograms (3)
Other examples of histograms are
The level of education of employees
Frequency
As you can see, histograms are a good representation of frequency.
Frequency
As you can see, histograms are a good representation of frequency.

Relative frequency
Definition: how often an event happens divided by the sum
Relative frequency
Definition: how often an event happens divided by the sum
Cumulative frequency
You’re interested in studying a population to find out a
Cumulative frequency
You’re interested in studying a population to find out a
Cumulative frequency (2)
Cumulative frequency tells how many times an event happens
Cumulative frequency (2)
Cumulative frequency tells how many times an event happens
 Приложения определенного интеграла к решению физических задач
 Теория вероятности
 Сложение и вычитание положительных и отрицательных чисел. Тест. 6 класс
 Степенные ряды
 Построение треугольника по трём элементам
 Статистические данные
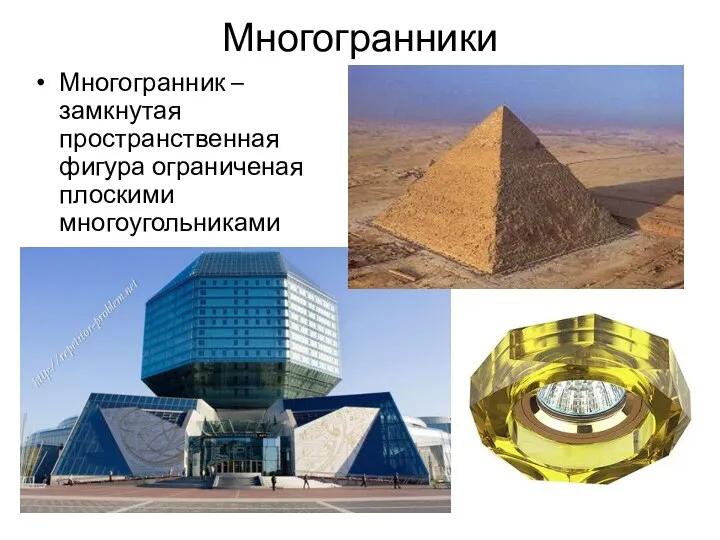 Многогранники
 Тайна простых чисел
 Методическая система обучения математике в 1-6 классах
 Площадь треугольника. 8 класс
 Простые проценты. (Тема 2)
 Тригонометричні функції суми та різниці двох кутів, подвійного аргументу. Сума та різниця синусів і косинусів. Лекція №13
 Отношения (концентрация)
 Геометрические фигуры. Занятие для дошкольников
 Занятие №24 по программе Раз - ступенька, два - ступенька Л.Г.Петерсона, Н.П.Холиной переложенное для использования интерактивной доски.
 Метр — одиниця довжини. Наступне і попереднє числа
 Потоки викликів
 Образование групп из отдельных предметов и выделение из группы одного предмета. Диск
 Решение линейных уравнений. 7 класс
 Задачи, раскрывающие смысл действия деления
 Приведение формул к совершенным нормальным формам. Упрощение формул логики до минимальной ДНФ
 Тесты по математике
 Измерение углов. Транспортир
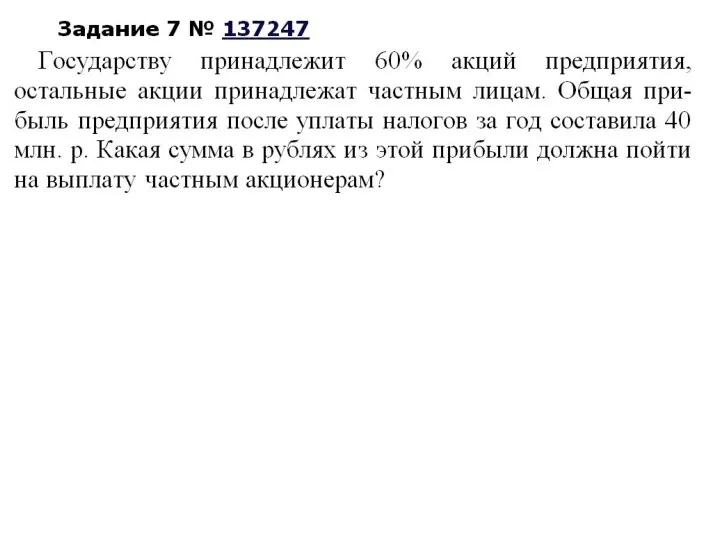 Задание №7
 Линейное уравнение с двумя переменными
 Урок математики в 1 классе
 Решение задач на признаки подобия треугольников
 Правильные многоугольники