- Measures of location (Lecture 2)

Содержание
- 2. LECTURE 2 MEASURES OF LOCATION Temur Makhkamov Indira Khadjieva QM Module Leaders tmakhkamov@wiut.uz i.khadjieva@wiut.uz Office hours:
- 3. Learning Outcomes Upon successful completion of session, students are able to Identify and calculate various measures
- 4. Measures of location Mean – the arithmetic average value Median – the middle value in the
- 5. Untabulated Data Def: Untabulated data – data given as a sequence of numbers or figures Example
- 6. Sigma notation
- 7. Mean
- 8. Median 7, 13, 13, 15, 20, 24, 27
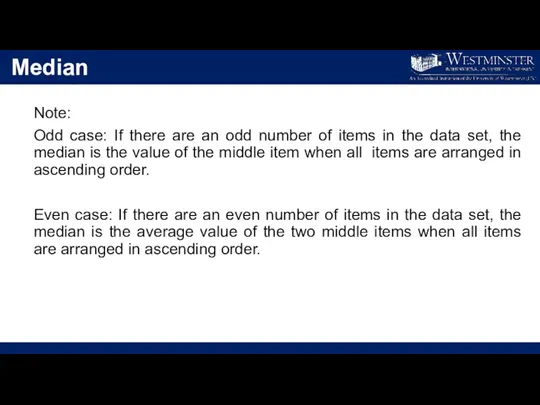
- 9. Median Note: Odd case: If there are an odd number of items in the data set,
- 10. Mode 20, 15, 13, 13, 27, 24, 7 Mode = 13, because there are two 13s
- 11. Lower quartile
- 12. Upper quartile
- 13. Tabulated (ungrouped) data
- 14. Tabulated (ungrouped) data
- 15. Mean (for ungrouped data)
- 16. Median (for ungrouped data)
- 17. Mode (for ungrouped data)
- 18. Tabulated (grouped) data
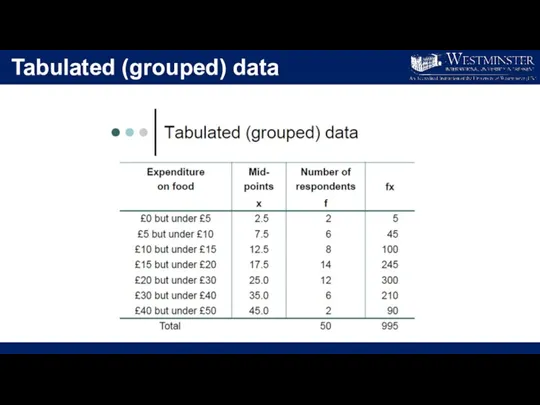
- 19. Tabulated (grouped) data
- 20. Mean for tabulated (grouped) data
- 21. Median for tabulated (grouped) data
- 22. Mode for tabulated (grouped) data
- 23. Lower quartile for tabulated grouped data
- 24. Upper quartile for tabulated grouped data
- 25. Types of distribution (1) Normal distribution – mean = median = mode Also called: Bell shaped
- 26. Types of distribution (2) Positively skewed distribution – when Mean > Median > Mode Also called,
- 27. Types of distribution (3) Negatively skewed distribution – when Mean Also called, left-skewed and looks like
- 28. Concluding remarks: Today, You learnt: the analysis of tabulated and untabulated, grouped and ungrouped data; the
- 30. Скачать презентацию
LECTURE 2
MEASURES OF LOCATION
Temur Makhkamov
Indira Khadjieva
QM Module Leaders
tmakhkamov@wiut.uz
i.khadjieva@wiut.uz
Office hours:
LECTURE 2
MEASURES OF LOCATION
Temur Makhkamov
Indira Khadjieva
QM Module Leaders
tmakhkamov@wiut.uz
i.khadjieva@wiut.uz
Office hours:
Learning Outcomes
Upon successful completion of session, students are able to
Learning Outcomes
Upon successful completion of session, students are able to
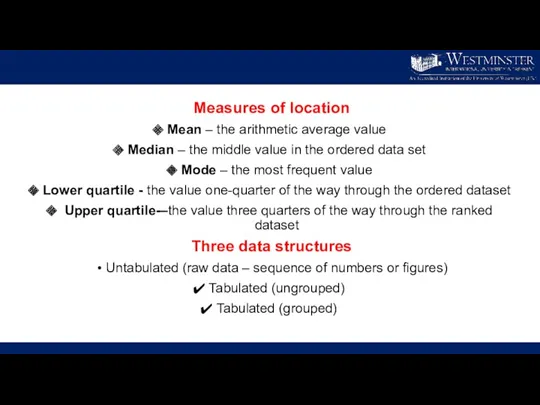
Measures of location
Mean – the arithmetic average value
Median – the middle
Measures of location
Mean – the arithmetic average value
Median – the middle
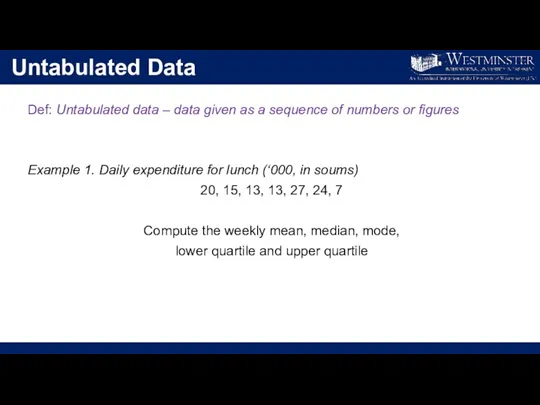
Untabulated Data
Def: Untabulated data – data given as a sequence of
Untabulated Data
Def: Untabulated data – data given as a sequence of
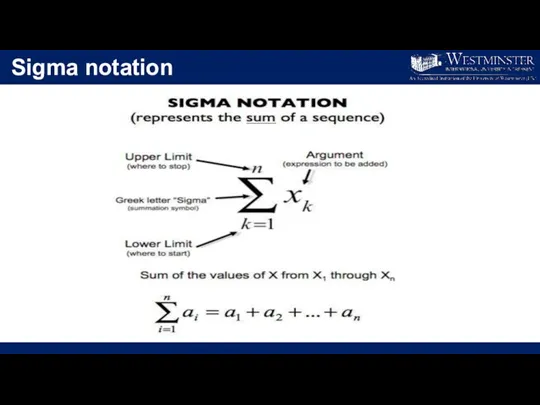
Sigma notation
Sigma notation
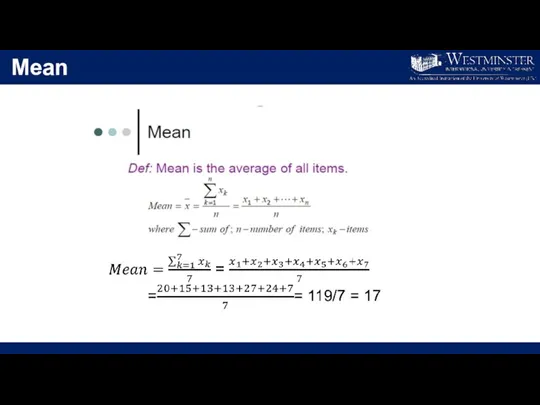
Mean
Mean
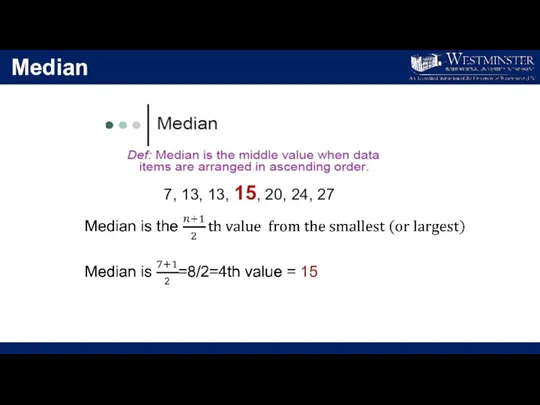
Median
7, 13, 13, 15, 20, 24, 27
Median
7, 13, 13, 15, 20, 24, 27
Median
Note:
Odd case: If there are an odd number of items
Median
Note:
Odd case: If there are an odd number of items
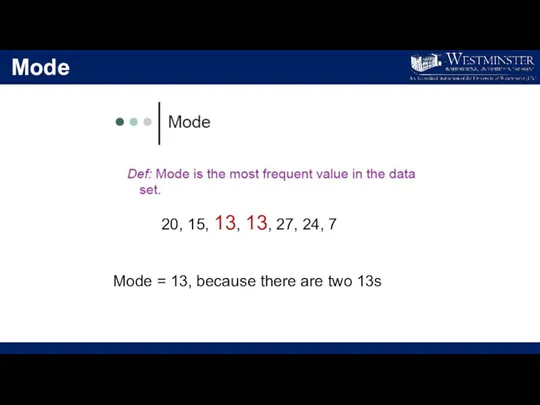
Mode
20, 15, 13, 13, 27, 24, 7
Mode = 13, because
Mode
20, 15, 13, 13, 27, 24, 7
Mode = 13, because
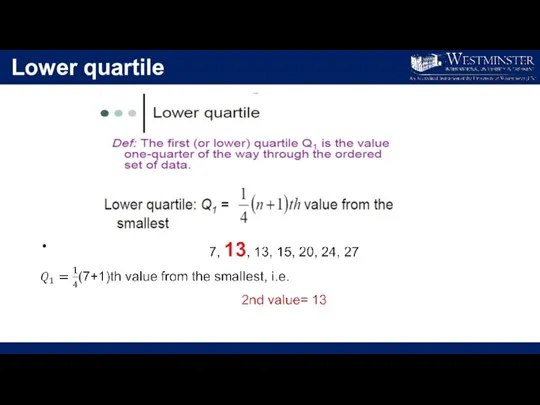
Lower quartile
Lower quartile
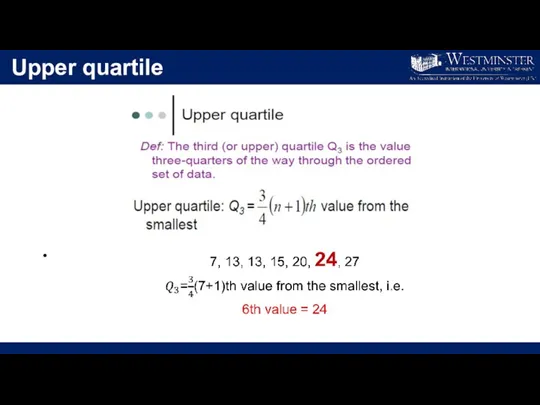
Upper quartile
Upper quartile
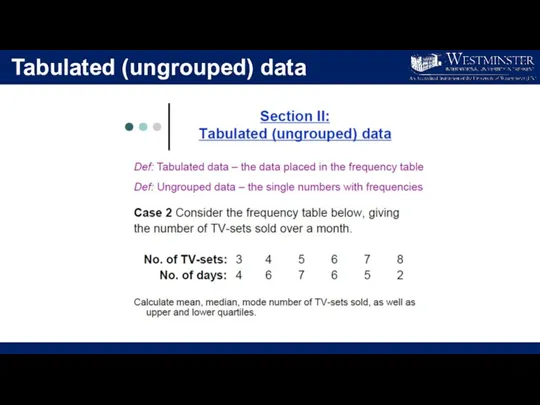
Tabulated (ungrouped) data
Tabulated (ungrouped) data
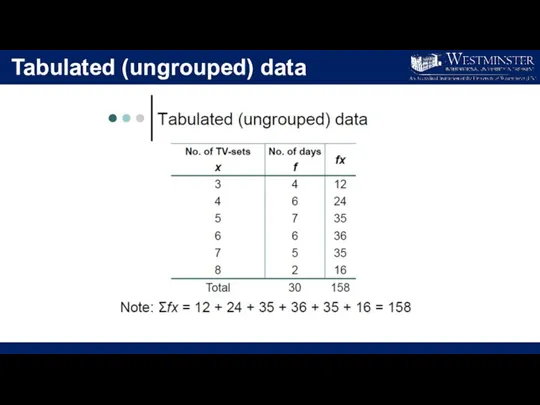
Tabulated (ungrouped) data
Tabulated (ungrouped) data
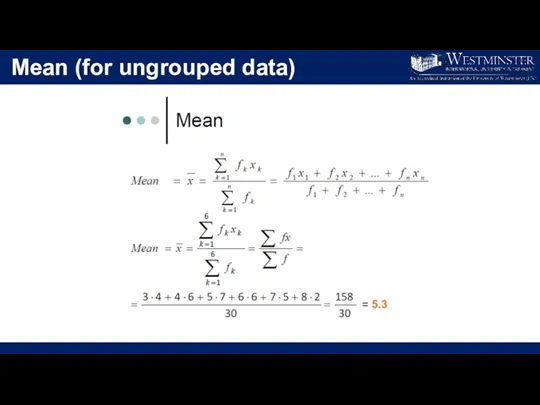
Mean (for ungrouped data)
Mean (for ungrouped data)
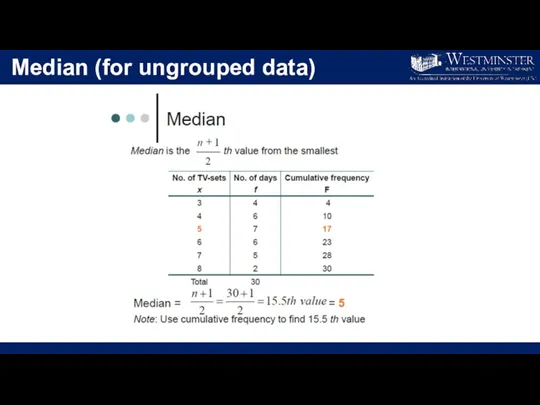
Median (for ungrouped data)
Median (for ungrouped data)
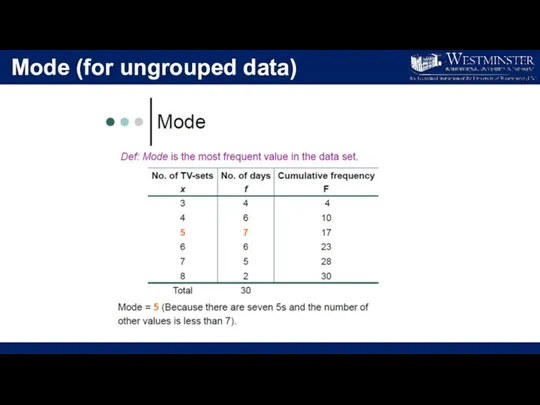
Mode (for ungrouped data)
Mode (for ungrouped data)
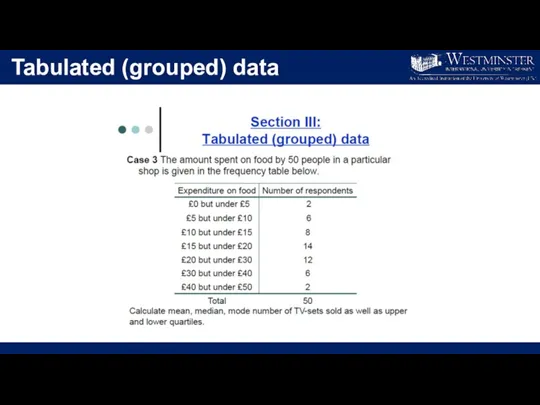
Tabulated (grouped) data
Tabulated (grouped) data
Tabulated (grouped) data
Tabulated (grouped) data
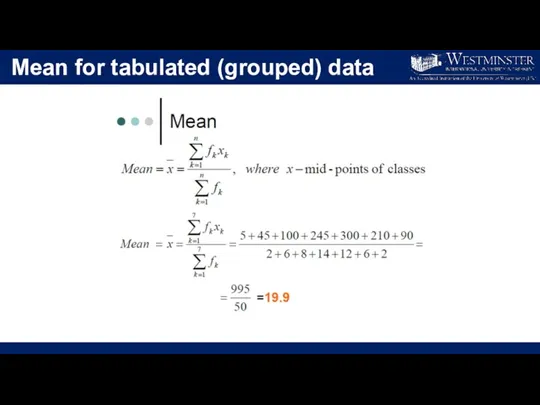
Mean for tabulated (grouped) data
Mean for tabulated (grouped) data
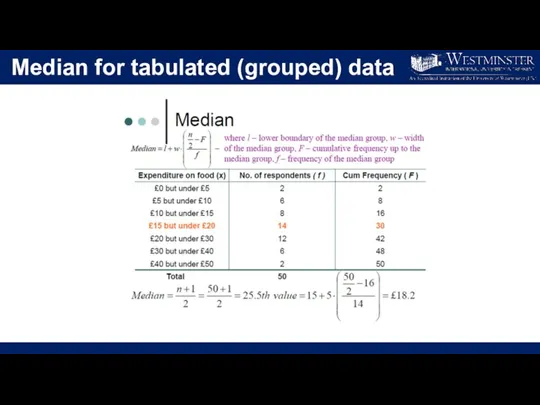
Median for tabulated (grouped) data
Median for tabulated (grouped) data
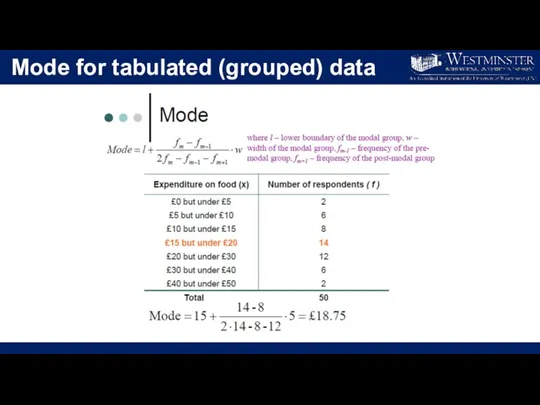
Mode for tabulated (grouped) data
Mode for tabulated (grouped) data
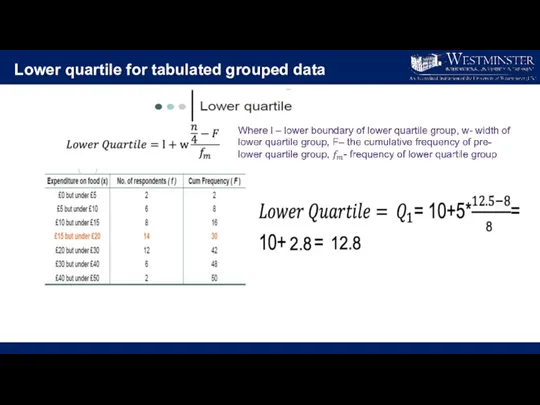
Lower quartile for tabulated grouped data
Lower quartile for tabulated grouped data
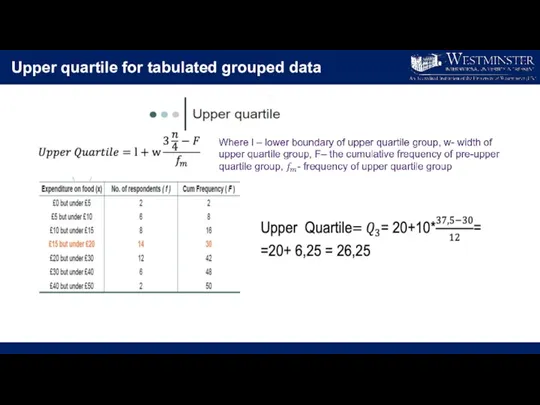
Upper quartile for tabulated grouped data
Upper quartile for tabulated grouped data
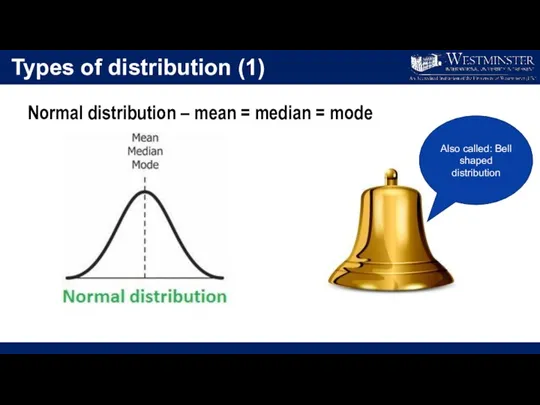
Types of distribution (1)
Normal distribution – mean = median = mode
Also
Types of distribution (1)
Normal distribution – mean = median = mode
Also

Types of distribution (2)
Positively skewed distribution – when Mean > Median
Types of distribution (2)
Positively skewed distribution – when Mean > Median
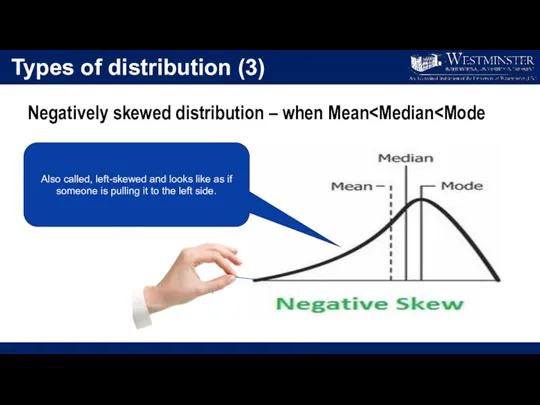
Types of distribution (3)
Negatively skewed distribution – when MeanAlso called,
Types of distribution (3)
Negatively skewed distribution – when Mean Also called,
Concluding remarks:
Today, You learnt:
the analysis of tabulated and untabulated, grouped and
Concluding remarks:
Today, You learnt:
the analysis of tabulated and untabulated, grouped and
 урок по математике Письменное сложение трехзначных чисел
 Додавання і віднімання чисел у межах 20. Задачі на різницеве порівняння. Урок 3
 Квадратні рівняння. Розв’язування неповних квадратних рівнянь
 Цыфра 7. Число 7.
 Деятельностный подход в обучении математике
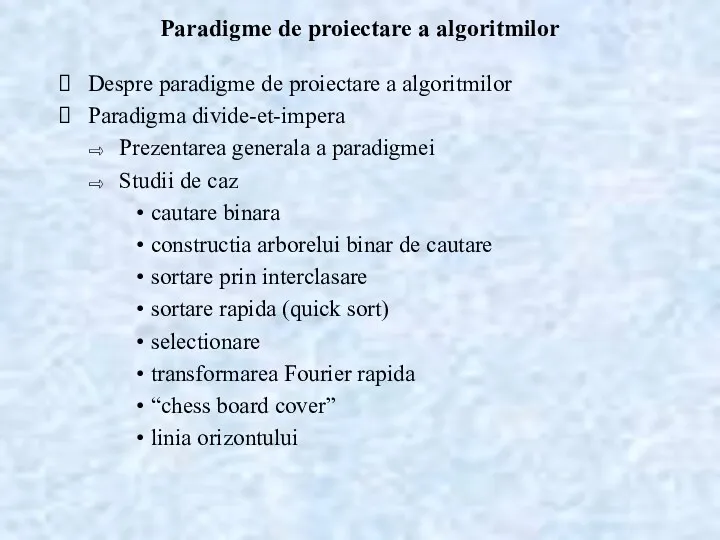 Paradigme de proiectare a algoritmilor
 Основы математического анализа
 Здоровьесберегающие технологии. Задачи о фруктах.
 Решение треугольников. 9 класс
 Китайская система счисления
 Движение. Симметрия. Поворот. Параллельный перенос. Осевая симметрия. Центральная симметрия
 Презентация Считалочка
 Свойства сторон прямоугольника 2 класс
 Системи лінійних рівнянь, умови їх сумісності і визначенності. Метод Гаусса
 Методическая разработка - технологическая карта урока математики в 3 классе по теме Проверка умножения. ФГОС
 Квадратные уравнения и способы их решения
 Сложение и вычитание обыкновенных дробей
 Дидактические игры по математике
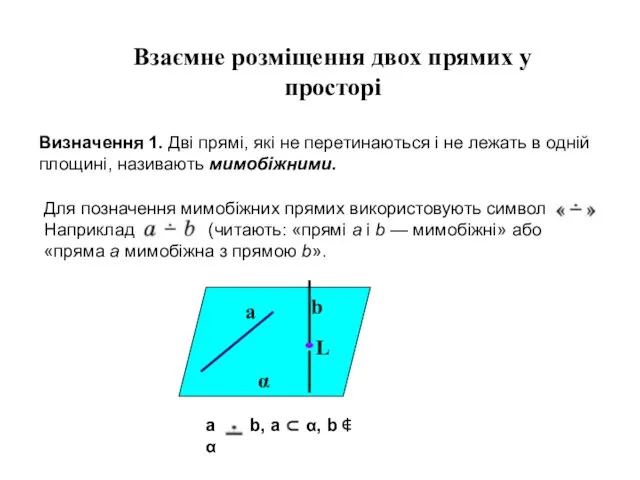 Взаємне розміщення двох прямих у просторі
 Алгоритм отыскания наибольшего и наименьшего значения функции
 Презентация к фрагменту урока в 1 классе. Тема Число и цифра 3
 Земная кора. Сложение и вычитание десятичных дробей
 Уменьшаемое. Вычитаемое. Разность
 Урок математики 1 класс
 Теорема о площади треугольника
 Прямая и плоскость в пространстве
 Образование чисел из одного десятка
 Дифференциальное исчисление функции нескольких переменных. Основные понятия функции нескольких переменных