- Basics of EKG Interpretation

Содержание
- 2. Outline Review of the conduction system QRS breakdown Rate Axis Rhythms
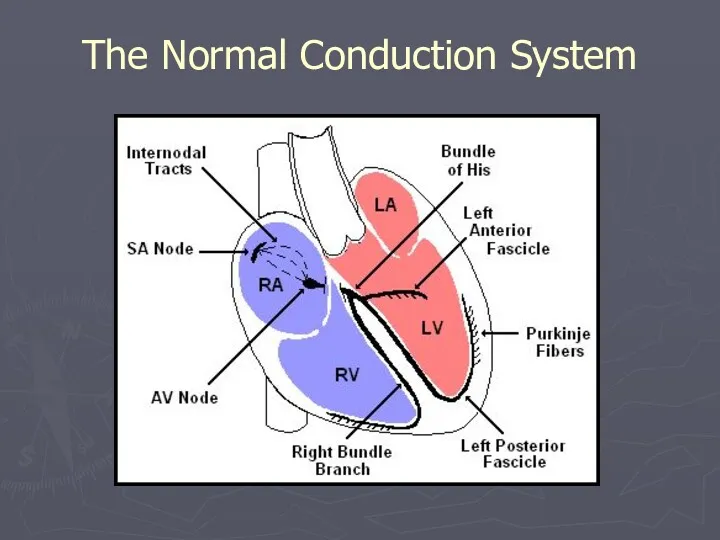
- 3. The Normal Conduction System
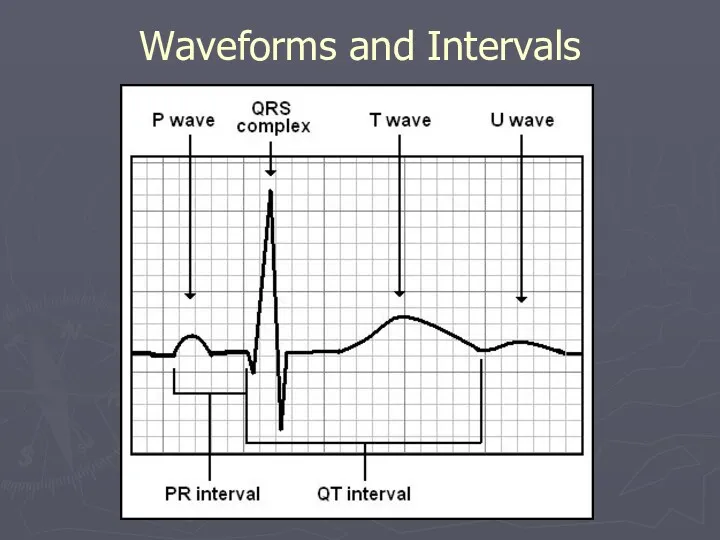
- 4. Waveforms and Intervals
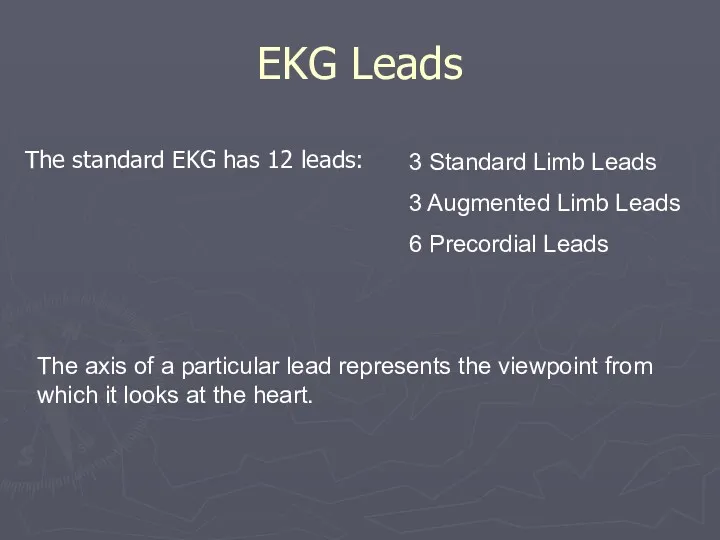
- 5. EKG Leads The standard EKG has 12 leads: 3 Standard Limb Leads 3 Augmented Limb Leads
- 6. Standard Limb Leads
- 7. All Limb Leads
- 8. Precordial Leads Adapted from: www.numed.co.uk/electrodepl.html
- 9. Precordial Leads
- 10. Anatomic Groups (Summary)
- 11. Rate Rule of 300 10 Second Rule
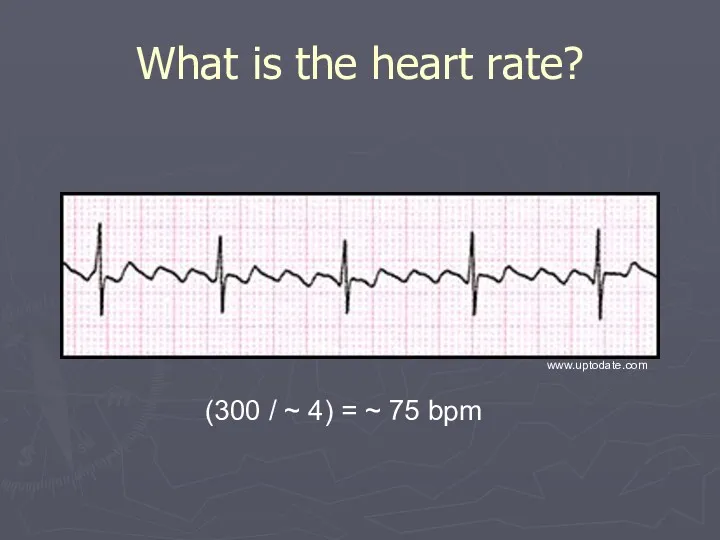
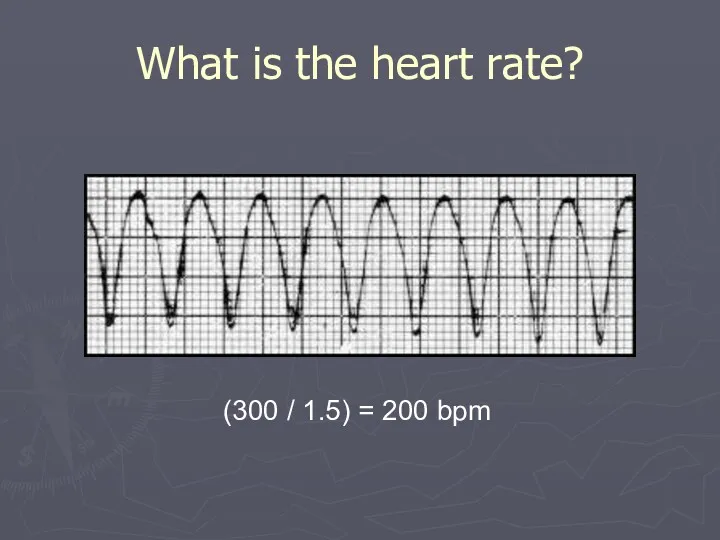
- 12. Rule of 300 Take the number of “big boxes” between neighboring QRS complexes, and divide this
- 13. What is the heart rate? (300 / 6) = 50 bpm www.uptodate.com
- 14. What is the heart rate? (300 / ~ 4) = ~ 75 bpm www.uptodate.com
- 15. What is the heart rate? (300 / 1.5) = 200 bpm
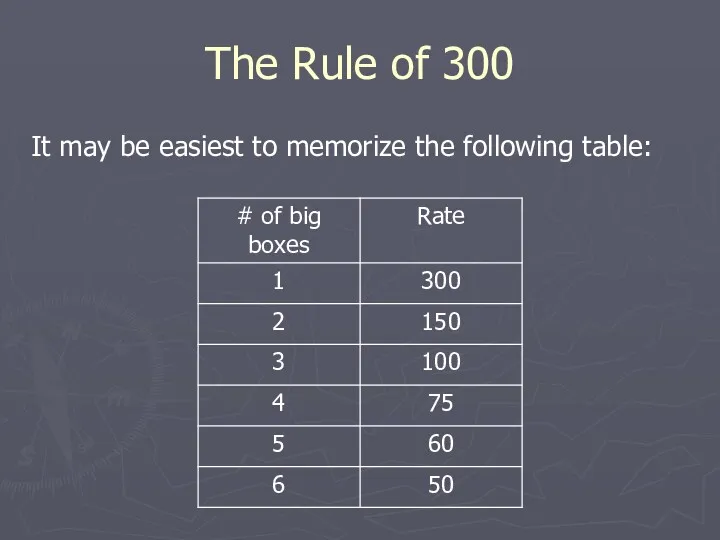
- 16. The Rule of 300 It may be easiest to memorize the following table:
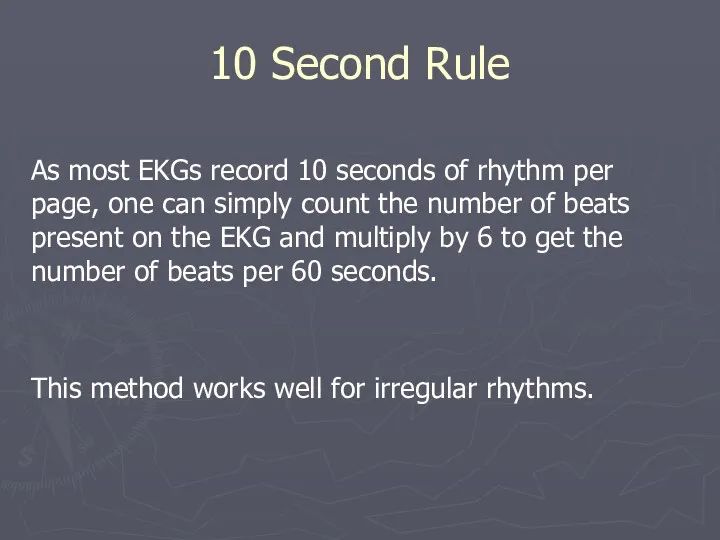
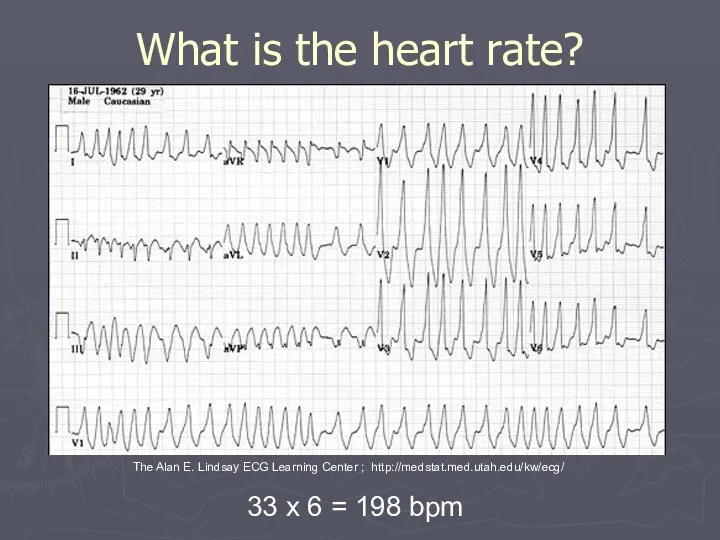
- 17. 10 Second Rule As most EKGs record 10 seconds of rhythm per page, one can simply
- 18. What is the heart rate? 33 x 6 = 198 bpm The Alan E. Lindsay ECG
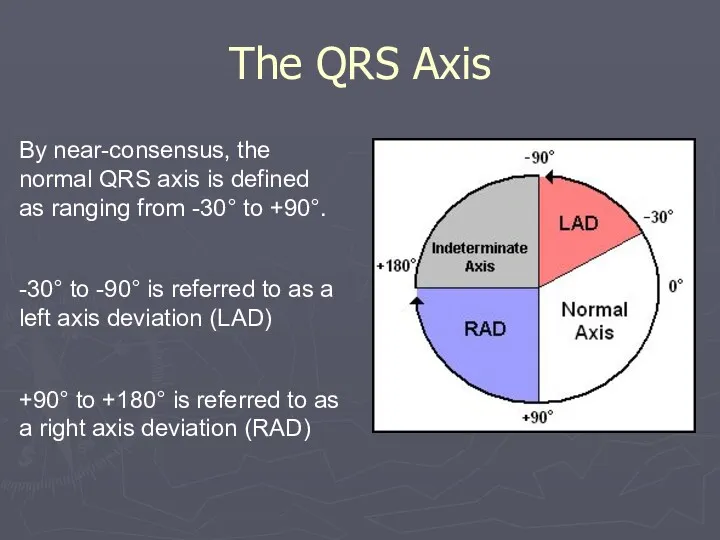
- 19. The QRS Axis By near-consensus, the normal QRS axis is defined as ranging from -30° to
- 20. Determining the Axis The Quadrant Approach The Equiphasic Approach
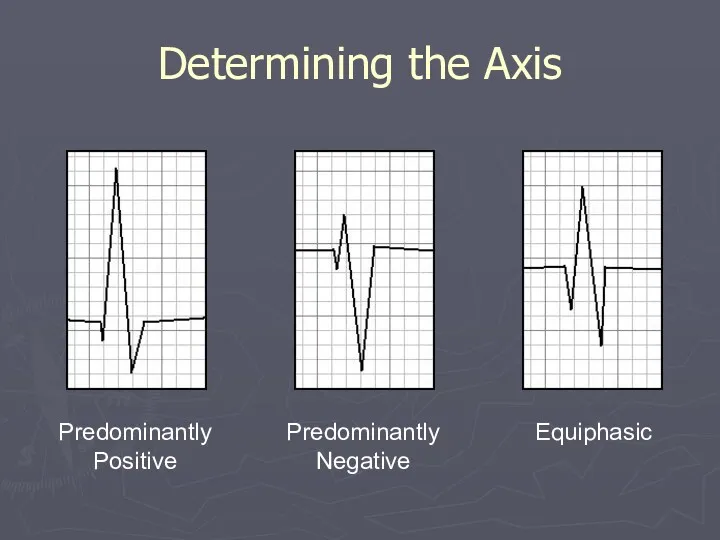
- 21. Determining the Axis Predominantly Positive Predominantly Negative Equiphasic
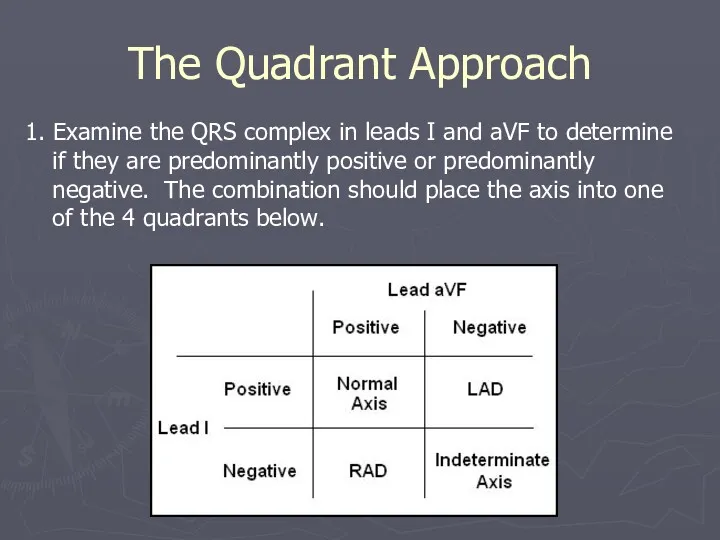
- 22. The Quadrant Approach 1. Examine the QRS complex in leads I and aVF to determine if
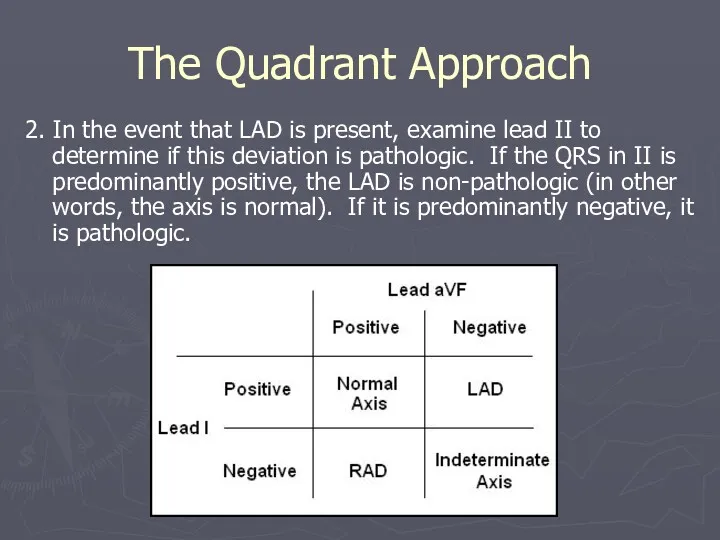
- 23. The Quadrant Approach 2. In the event that LAD is present, examine lead II to determine
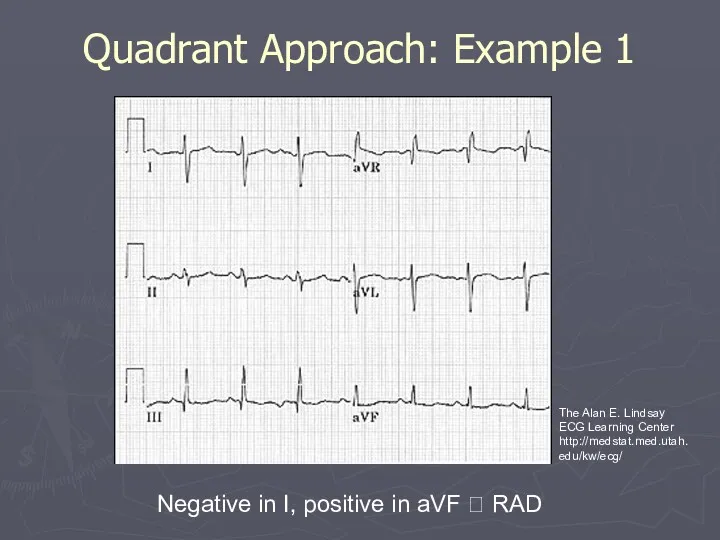
- 24. Quadrant Approach: Example 1 Negative in I, positive in aVF ? RAD The Alan E. Lindsay
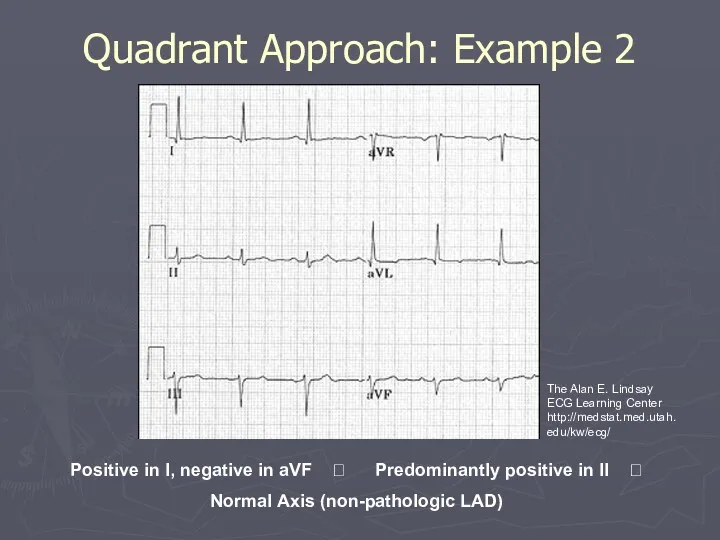
- 25. Quadrant Approach: Example 2 Positive in I, negative in aVF ? Predominantly positive in II ?
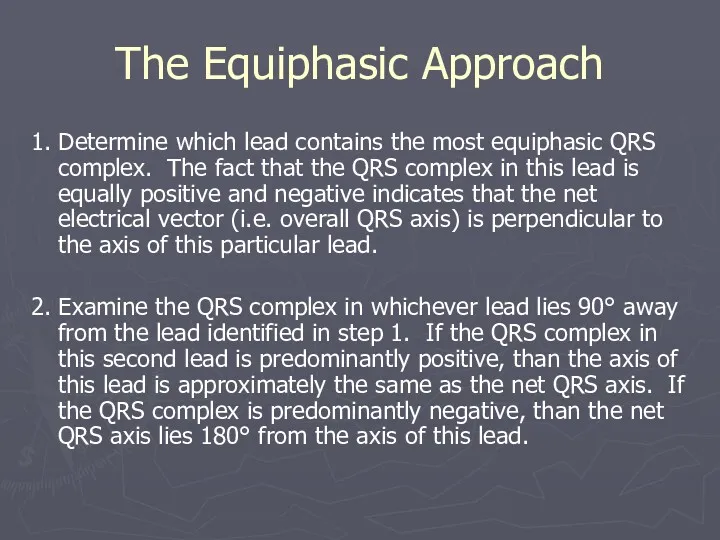
- 26. The Equiphasic Approach 1. Determine which lead contains the most equiphasic QRS complex. The fact that
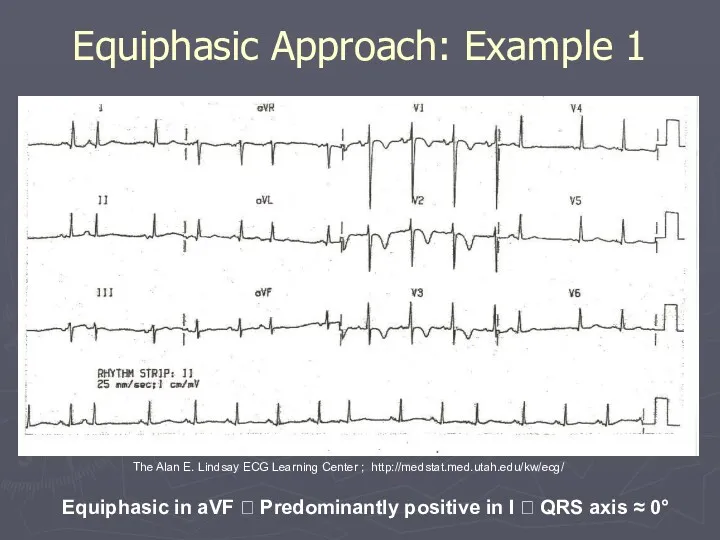
- 27. Equiphasic Approach: Example 1 Equiphasic in aVF ? Predominantly positive in I ? QRS axis ≈
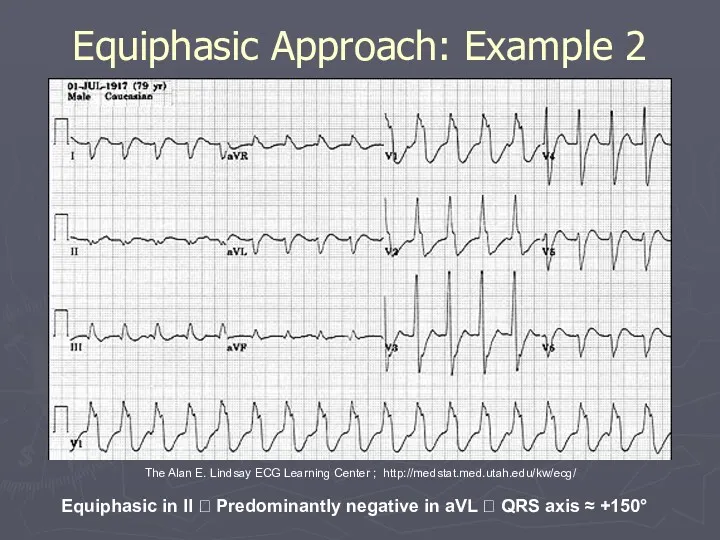
- 28. Equiphasic Approach: Example 2 Equiphasic in II ? Predominantly negative in aVL ? QRS axis ≈
- 29. Systematic Approach Rate Rhythm Axis Wave Morphology P, T, and U waves and QRS complex Intervals
- 30. Rhythms/Arrhythmias Sinus Atrial Junctional Ventricular
- 31. Sinus Rhythms: Criteria/Types P waves upright in I, II, aVF Constant P-P/R-R interval Rate Narrow QRS
- 32. Sinus Arrhythmias: Criteria/Types Normal Sinus Rhythm Sinus Bradycardia Sinus Tachycardia Sinus Arrhythmia
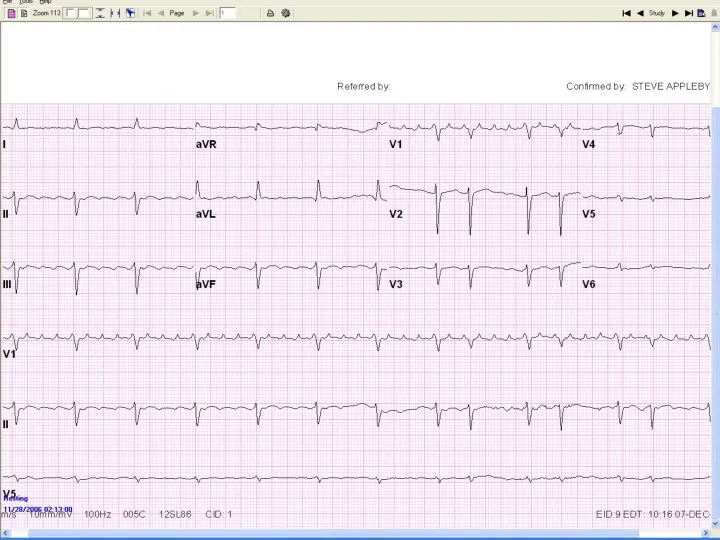
- 33. Normal Sinus Rhythm Rate is 60 to 100
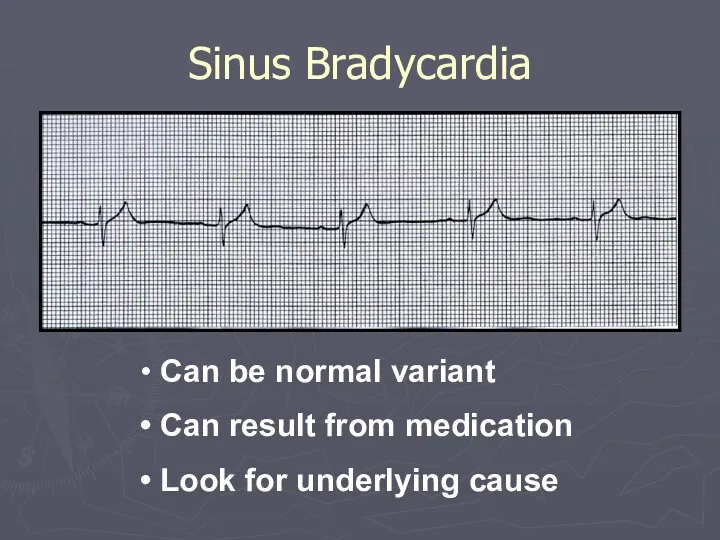
- 34. Sinus Bradycardia Can be normal variant Can result from medication Look for underlying cause
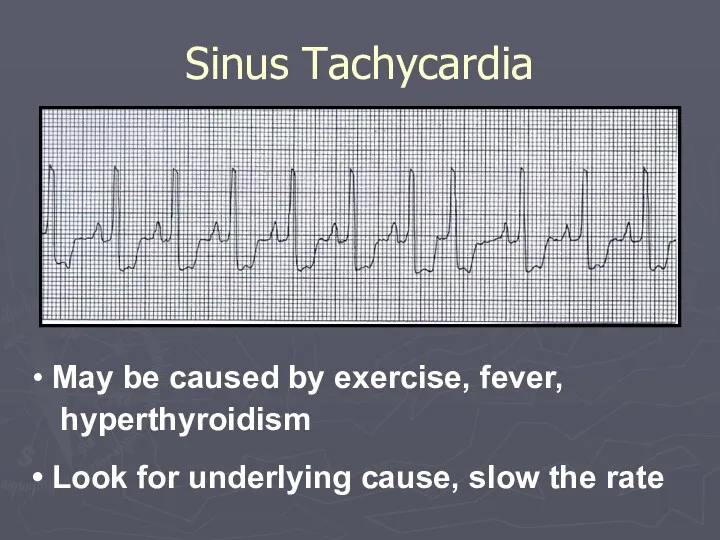
- 35. Sinus Tachycardia May be caused by exercise, fever, hyperthyroidism Look for underlying cause, slow the rate
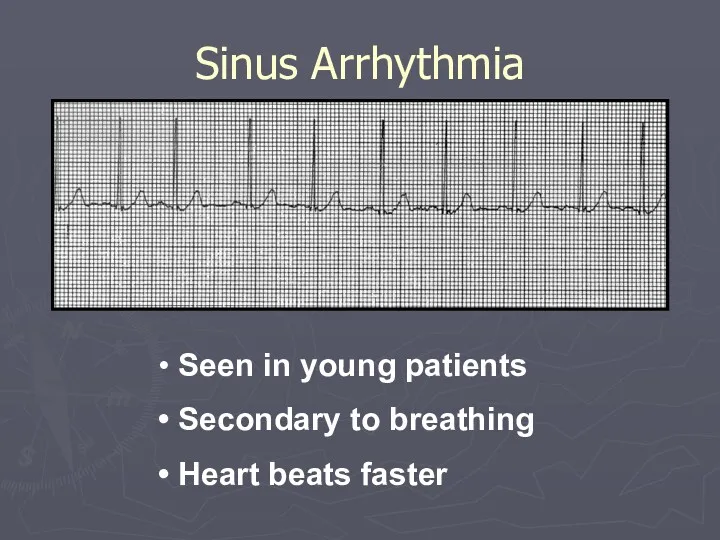
- 36. Sinus Arrhythmia Seen in young patients Secondary to breathing Heart beats faster
- 37. Atrial Arrhythmias: Criteria/Types P waves inverted in I, II and aVF Abnormal shape Notched Flattened Diphasic
- 38. Atrial Arrhythmias: Criteria/Types Premature Atrial Contractions Ectopic Atrial Rhythm Wandering Atrial Pacemaker Multifocal Atrial Tachycardia Atrial
- 39. Premature Atrial Contraction QRS complex narrow RR interval shorter than sinus QRS complexes P wave shows
- 40. Ectopic Atrial Rhythm Narrow QRS complex P wave inverted
- 41. Wandering Atrial Pacemaker 3 different P wave morphologies possible with ventricular rate
- 42. Multifocal Atrial Tachycardia 3 different P wave morphologies with ventricular rate> 100 bpm
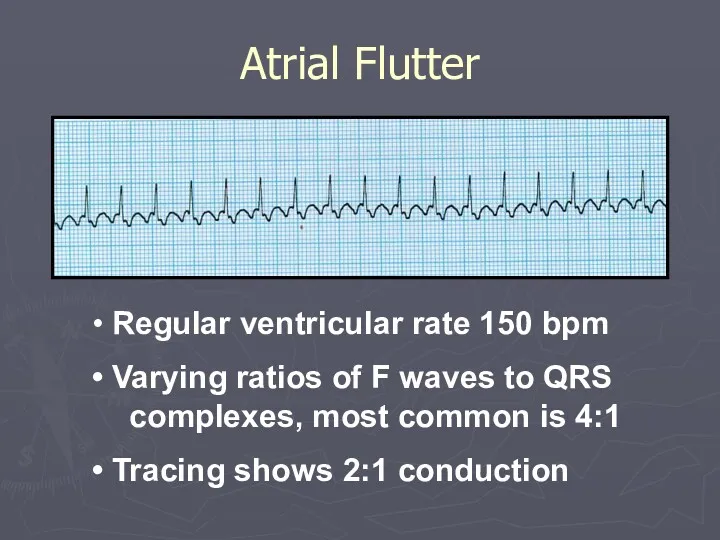
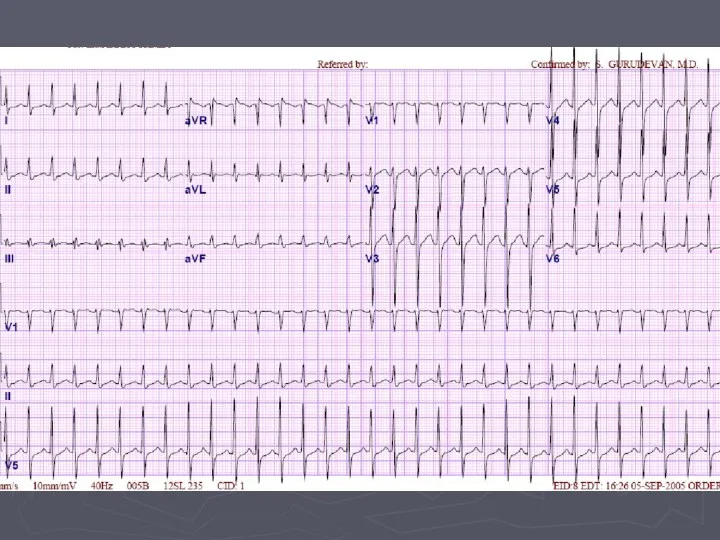
- 43. Atrial Flutter Regular ventricular rate 150 bpm Varying ratios of F waves to QRS complexes, most
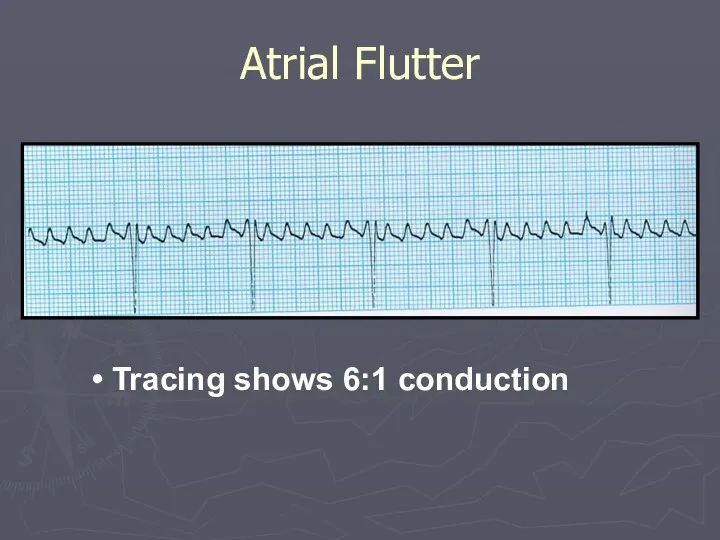
- 44. Atrial Flutter Tracing shows 6:1 conduction
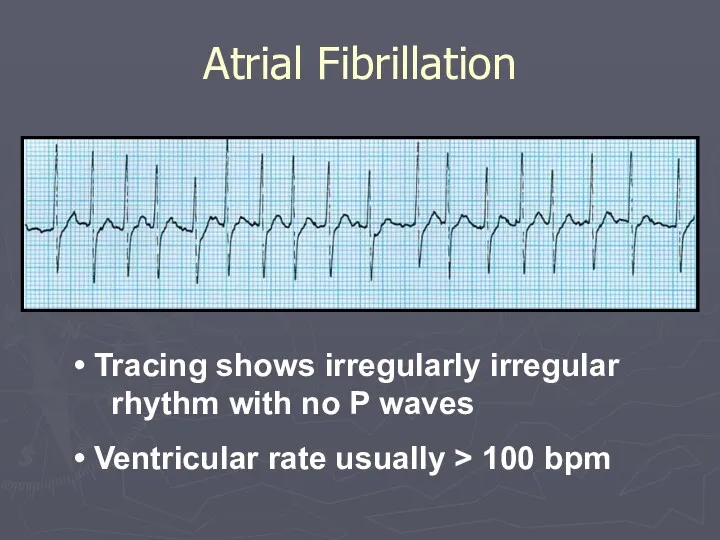
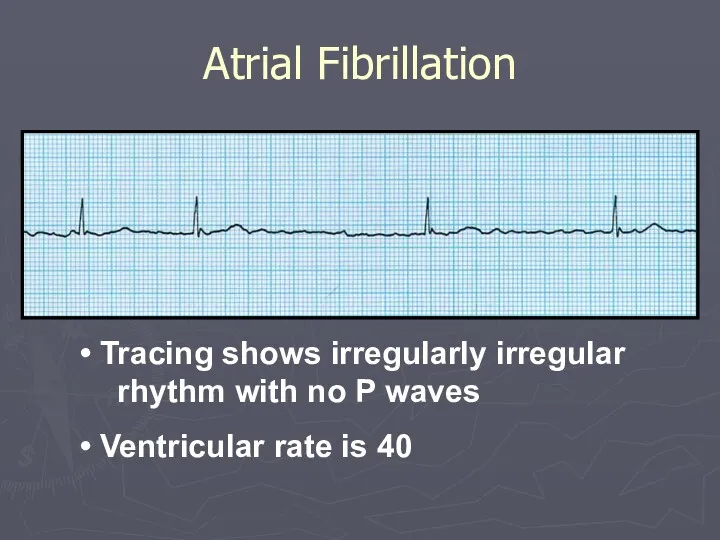
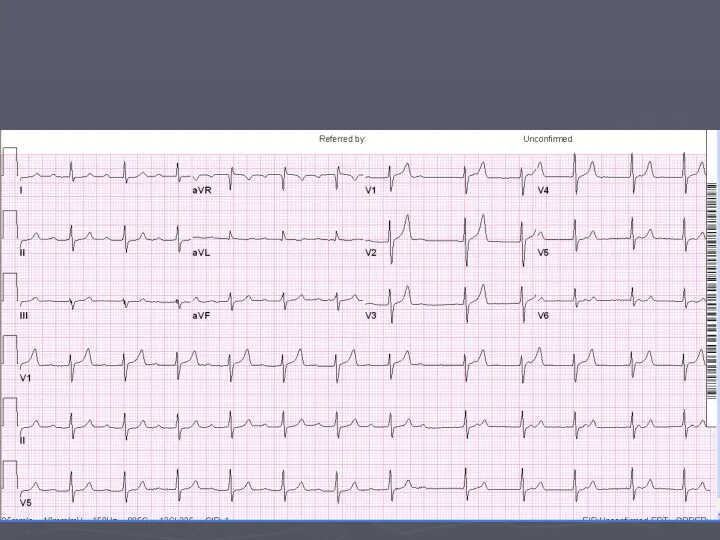
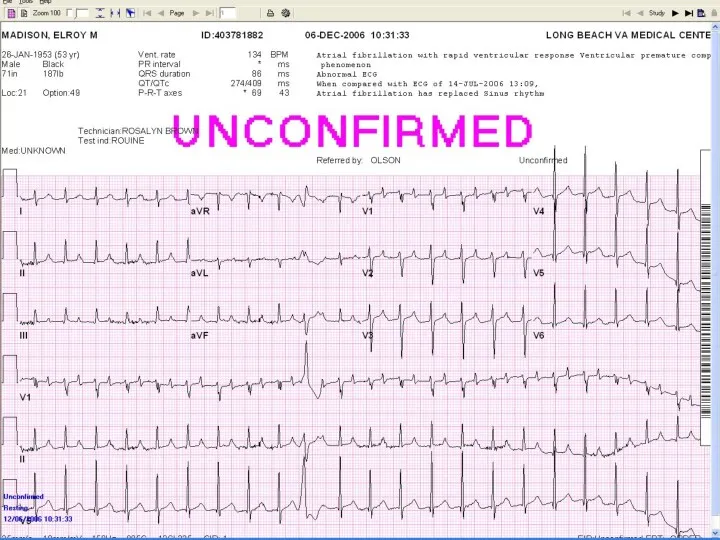
- 45. Atrial Fibrillation Tracing shows irregularly irregular rhythm with no P waves Ventricular rate usually > 100
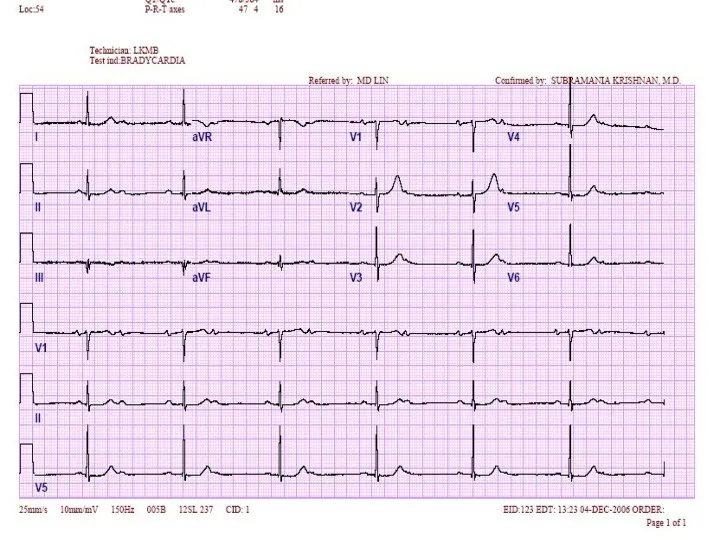
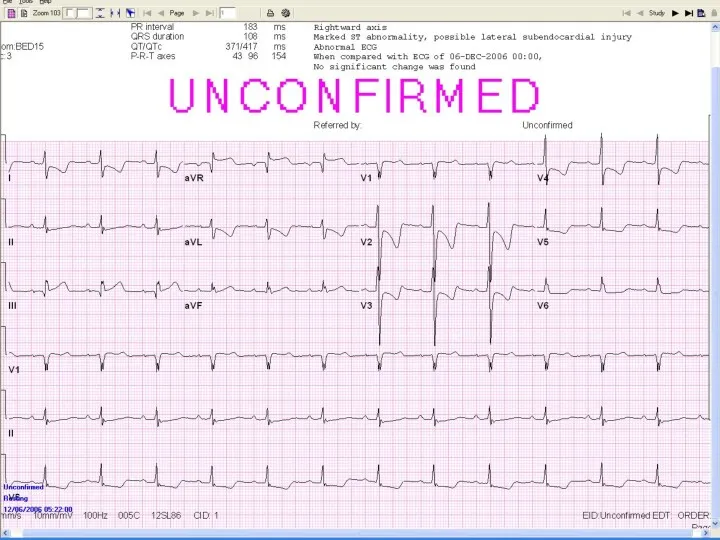
- 46. Atrial Fibrillation Tracing shows irregularly irregular rhythm with no P waves Ventricular rate is 40
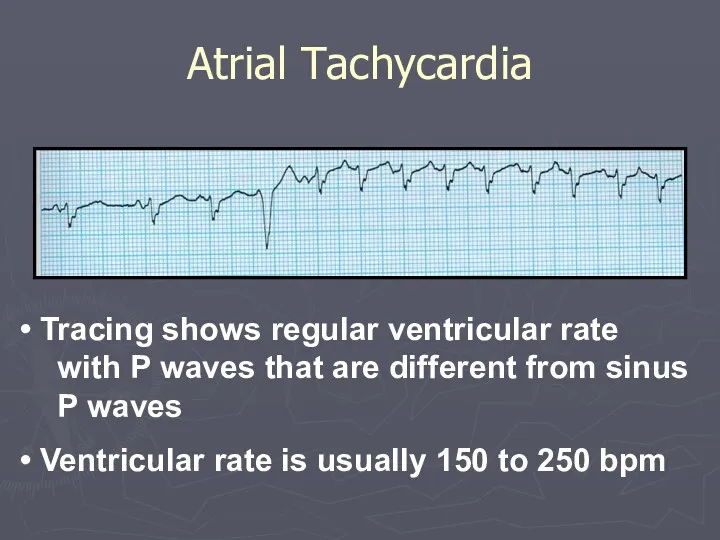
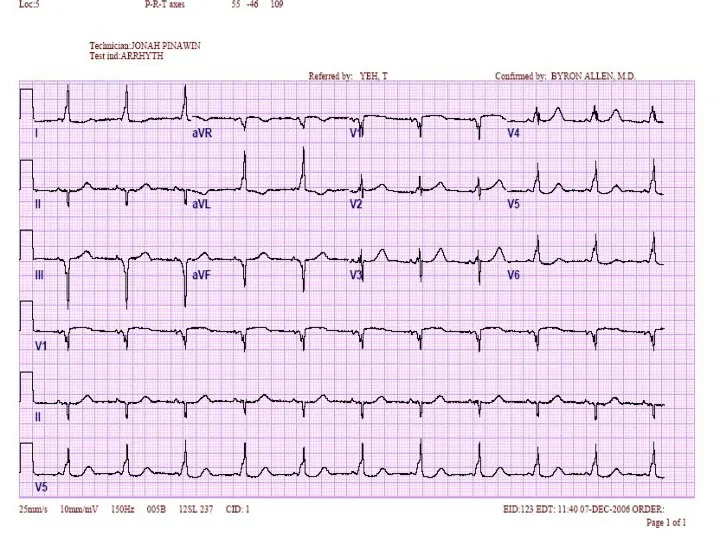
- 47. Atrial Tachycardia Tracing shows regular ventricular rate with P waves that are different from sinus P
- 48. P wave May be absent Buried in QRS If present inverted in leads I, II, and
- 49. PR interval Rate: Varies Narrow QRS complex Junctional Arrhythmias: Criteria
- 50. Junctional Arrhythmias: Types Premature Junctional Contractions Junctional Escape Rhythm Accelerated Junctional Tachycardia Junctional Tachycardia Reentrant Tachycardia
- 51. Premature Junctional Contractions R-R interval is shorter Beat is early, narrow QRS complex Inverted P wave
- 52. Junctional Escape Rhythm Junctional origin Rate is 40 to 60
- 53. Accelerated Junctional Tachycardia Junctional origin Rate is 60 to 100
- 54. Junctional Tachycardia Junctional origin Rate is > 100
- 55. Secondary to bypass tract within AV node Premature Atrial Contraction (PAC) depolarizes AV Nodal Reentrant Tachycardia
- 56. Rate Summary Sinus Tachycardia - 100-160 BPM Atrial Tachycardia - 150-250 BPM Atrial Flutter - 150-250
- 57. AV Nodal Blocks Delay conduction of impulses from sinus node If AV node does not let
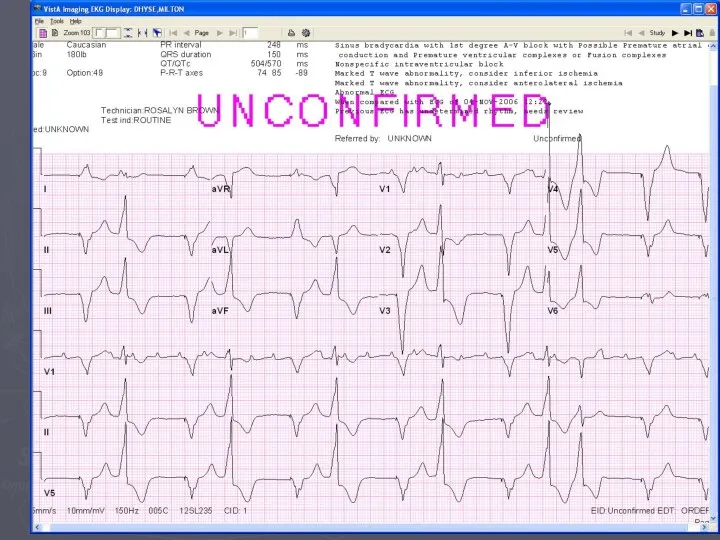
- 58. 1st Degree AV Block PR interval constant >.2 sec All impulses conducted
- 59. 2nd Degree AV Block Type 1 AV node conducted each impulse slower and finally no impulse
- 60. 2nd Degree AV Block Type 2 Constant PR interval AV node intermittently conducts no impulse
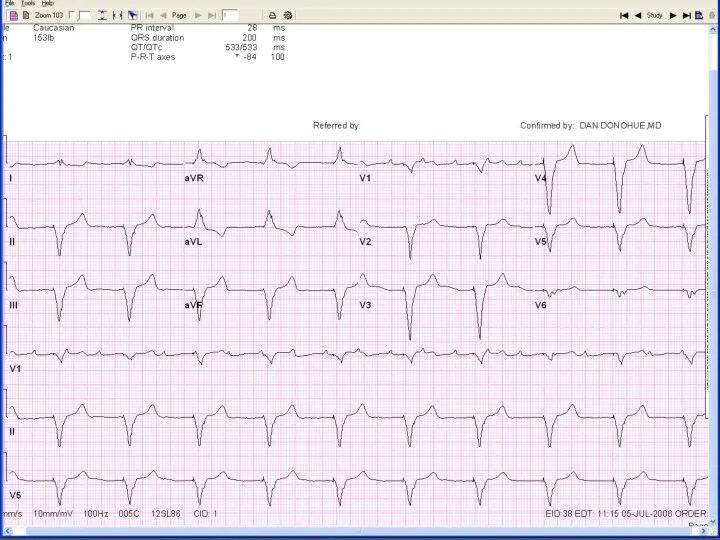
- 61. AV node conducts no impulse Atria and ventricles beat at intrinsic rate (80 and 40 respectively)
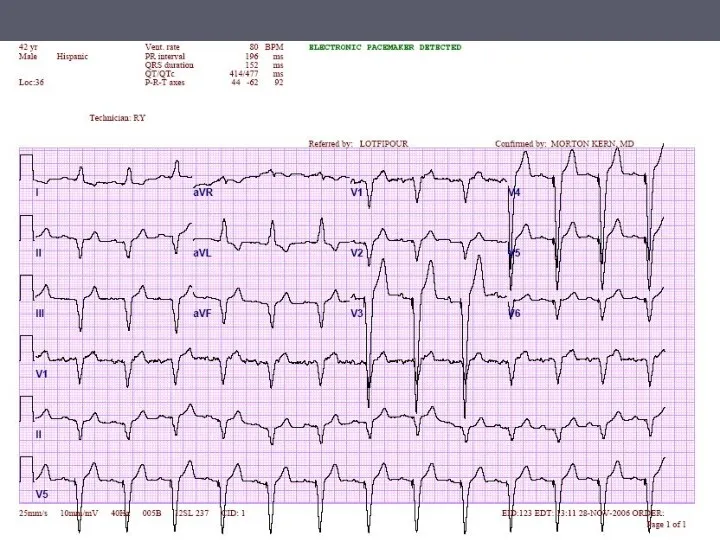
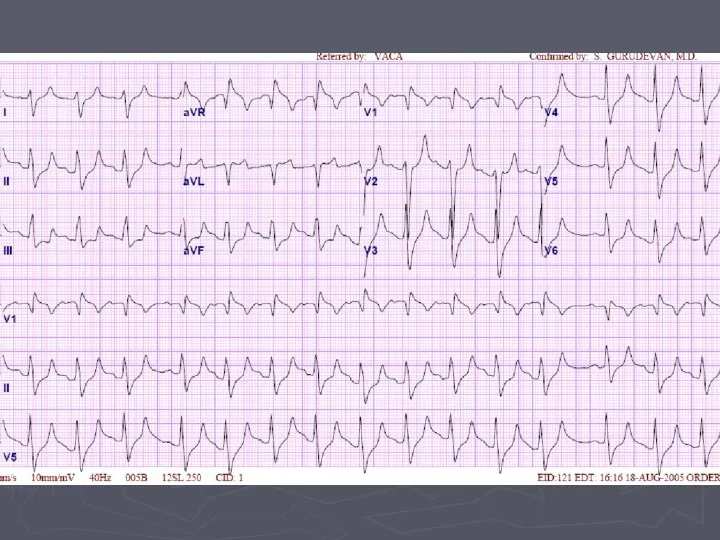
- 62. Caused by bypass tract AV node is bypassed, delay EKG shows short PR interval Upsloping to
- 63. Delta wave, short PR interval WPW
- 64. Ventricular Arrhythmias: Criteria/Types Wide QRS complex Rate : variable No P waves Premature Ventricular Contractions Idioventricular
- 65. Occurs earlier than sinus beat Wide, no P wave Premature Ventricular Contraction
- 66. Escape rhythm Rate is 20 to 40 bpm Idioventricular Rhythm
- 67. Rate is 40 to 100 bpm Accelerated Idioventricular Rhythm
- 68. Rate is > than 100 bpm Ventricular Tachycardia
- 69. Torsades de Pointes Occurs secondary to prolonged QT interval
- 70. Unorganized activity of ventricle Ventricular Tachycardia/Fibrillation
- 71. Ventricular Fibrillation
- 72. Chamber Enlargements
- 73. Differential Diagnosis Hypertension (HTN) Aortis Stenosis (AS) Aortic Insufficiency (AI) Hypertrophic Cardiomyopathy (HCM) Mitral Regurgitation (MR)
- 74. False positive Thin chest wall Status post mastectomy Race, Sex, Age Left Bundle Branch Block (LBBB)
- 75. EKG Criteria: Diagnosis of LVH
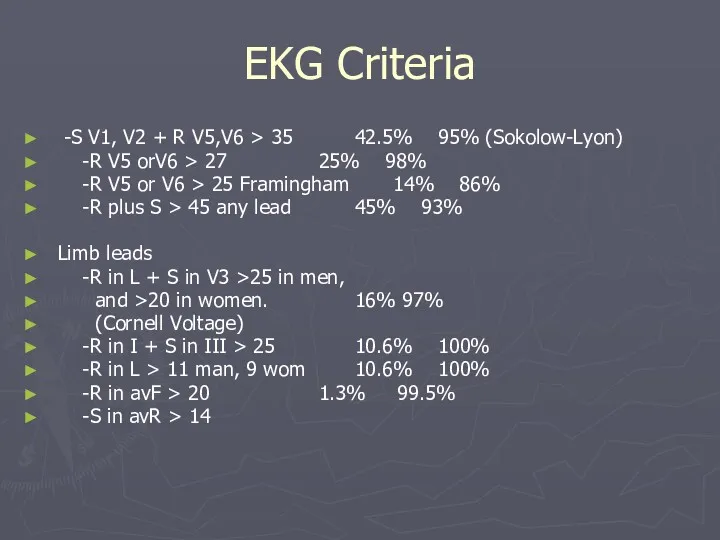
- 76. EKG Criteria -S V1, V2 + R V5,V6 > 35 42.5% 95% (Sokolow-Lyon) -R V5 orV6
- 77. LVH with Strain
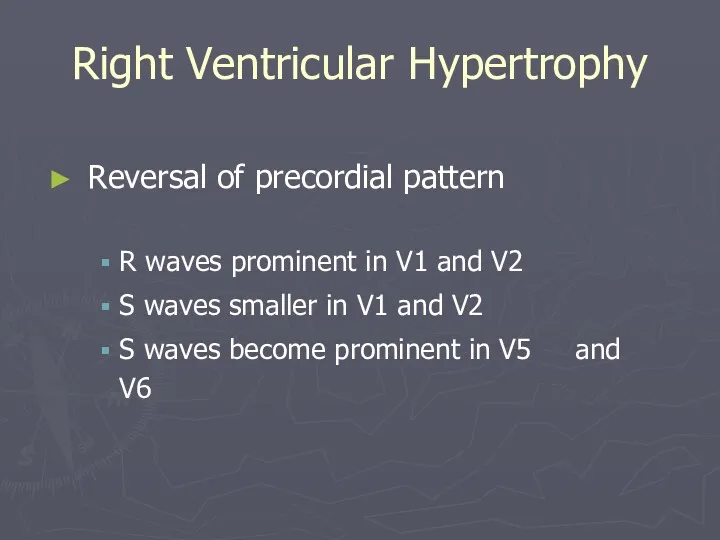
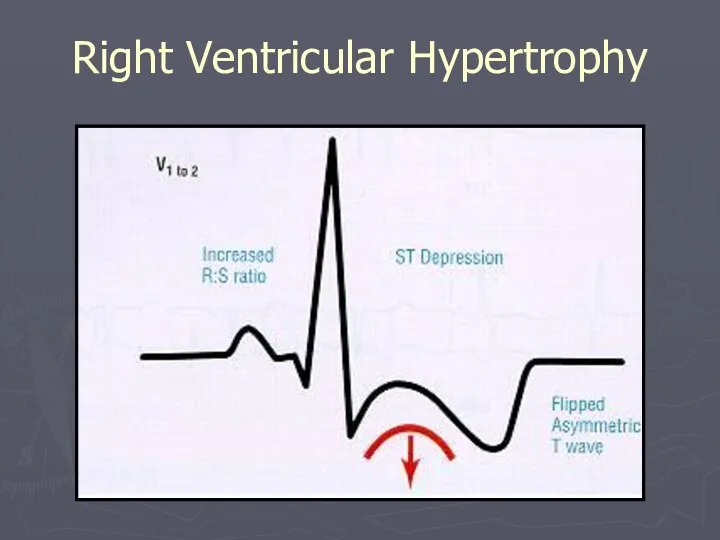
- 78. Right Ventricular Hypertrophy Reversal of precordial pattern R waves prominent in V1 and V2 S waves
- 79. Right Ventricular Hypertrophy
- 80. Right Ventricular Hypertrophy: Causes Chronic Obstructive Pulmonary Disease Pulmonary HTN Primary Pulmonary Embolus Mitral Stenosis Mitral
- 81. Right Ventricular Hypertrophy: Causes Tricuspid Regurgitation Atrial Septal Defect Pulmonary Stenosis Tetralogy of Fallot Ventricular Septal
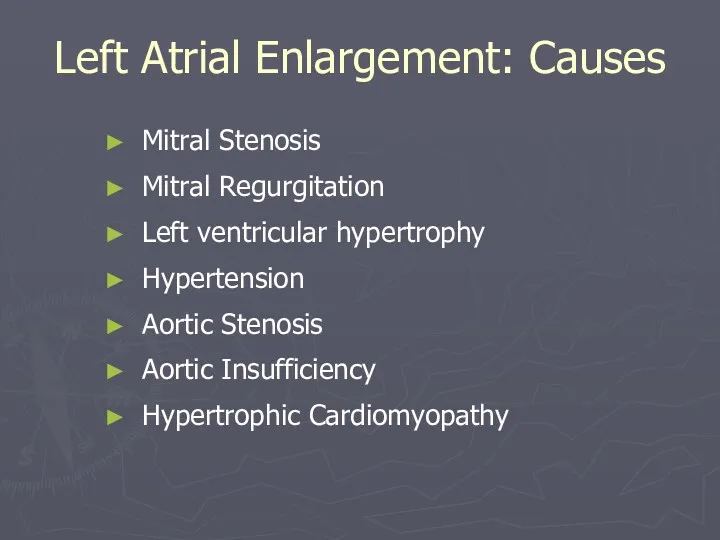
- 82. Mitral Stenosis Mitral Regurgitation Left ventricular hypertrophy Hypertension Aortic Stenosis Aortic Insufficiency Hypertrophic Cardiomyopathy Left Atrial
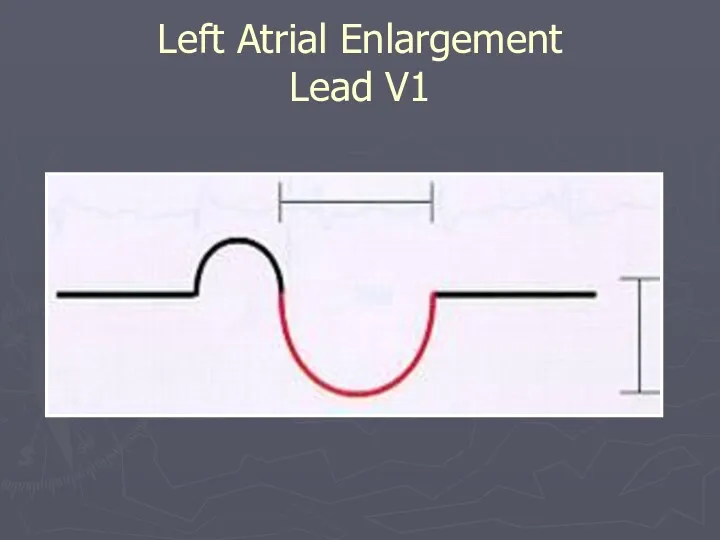
- 83. Left Atrial Enlargement: Criteria P wave Notch in P wave Any lead Peaks > 0.04 secs
- 84. Lead II
- 85. P Wave: Left Atrial Enlargement
- 86. Left Atrial Enlargement Lead V1
- 87. CHD Tricuspid Stenosis Pulmonary Stenosis COPD Pulmonary HTN Pulmonary Embolus Mitral Regurgitation Mitral Stenosis Right Atrial
- 88. Tall, peaked P wave > 2.5 mm in any lead Most prominent P waves in leads
- 89. Right Atrial Enlargement
- 90. Bundle Branch Blocks
- 91. Bundle Branch Blocks Complete QRS > .12 secs Incomplete QRS .10 - .12 secs Left Complete
- 92. Normal variant Idiopathic degeneration of the conduction system Cardiomyopathy Ischemic heart disease Aortic Stenosis Hyperkalemia Left
- 93. Criteria for Left Bundle Branch Block (LBBB) Bizarre QRS Morphology High voltage S wave in V1,
- 94. Left Bundle Branch Block
- 95. Right Bundle Branch Block: Causes Idiopathic degeneration of the conduction system Ischemic heart disease Cardiomyopathy Massive
- 96. Criteria for Right Bundle Branch Block (RBBB) QRS morphology Wide S wave in leads I and
- 97. Right Bundle Branch Block
- 98. Right Bundle Branch Block
- 99. Anterior Septal with RBBB
- 100. Ischemia and Infarction
- 101. Normal Complexes and Segments
- 102. J Point
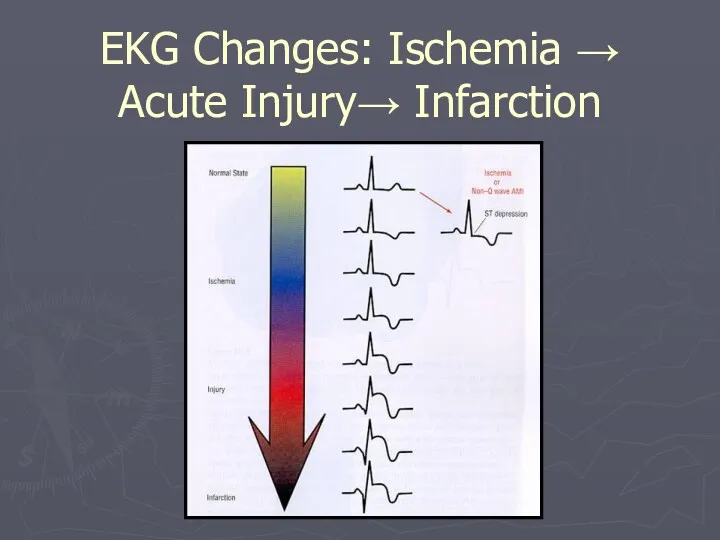
- 103. Ischemia T wave inversion, ST segment depression Acute injury: ST segment elevation Dead tissue: Q wave
- 104. Measurements
- 105. ST-Segment Elevation
- 106. ST Segment Depression Can be characterised as:- Downsloping Upsloping Horizontal
- 107. EKG Changes: Ischemia → Acute Injury→ Infarction
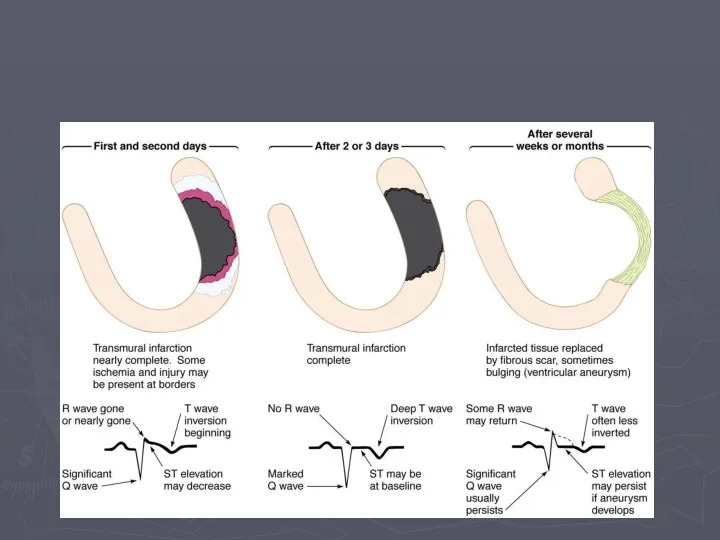
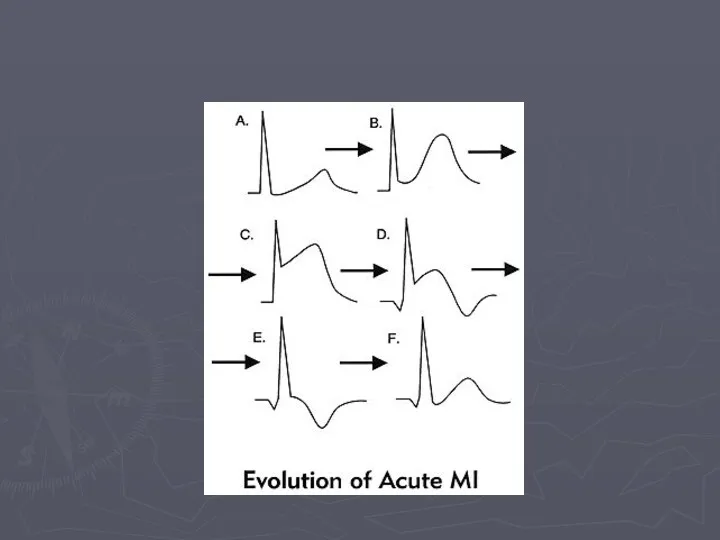
- 108. Evolution of Transmural Infarction
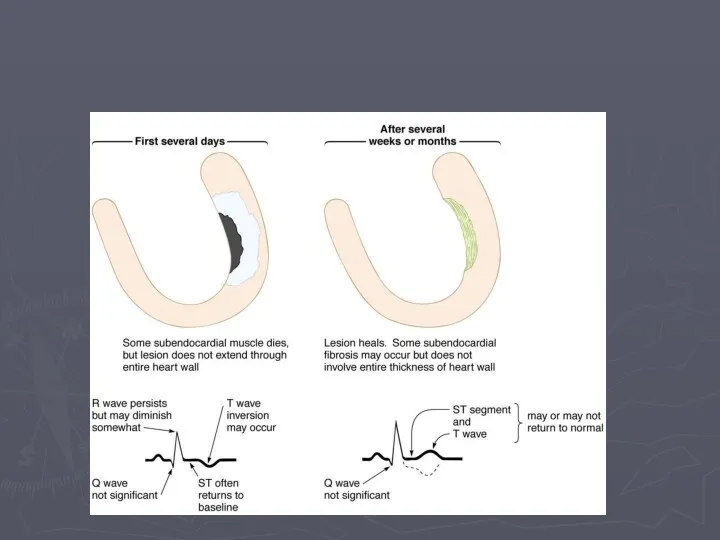
- 110. Evolution of a Subendocardial Infarction
- 112. Hyperacute T waves
- 113. Q Waves Non Pathological Q waves Q waves of less than 2mm are normal Pathological Q
- 114. Look for Grouped Patterns (Footprints) ST Depressions = Ischemia ST Elevations = injury Q Waves &
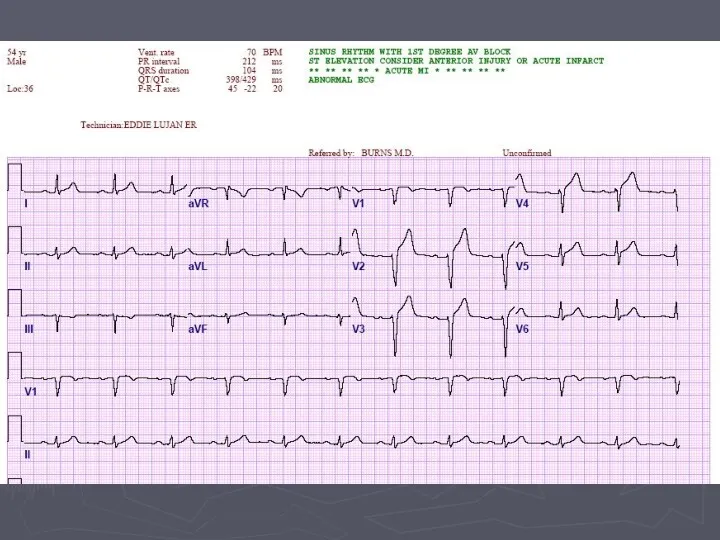
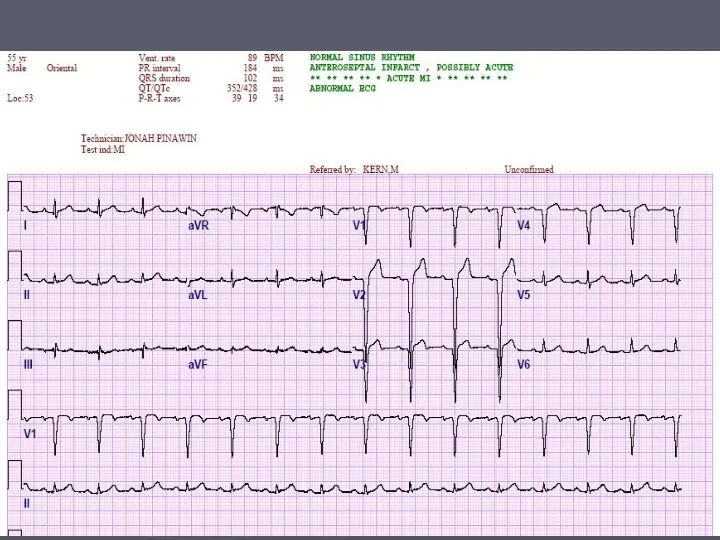
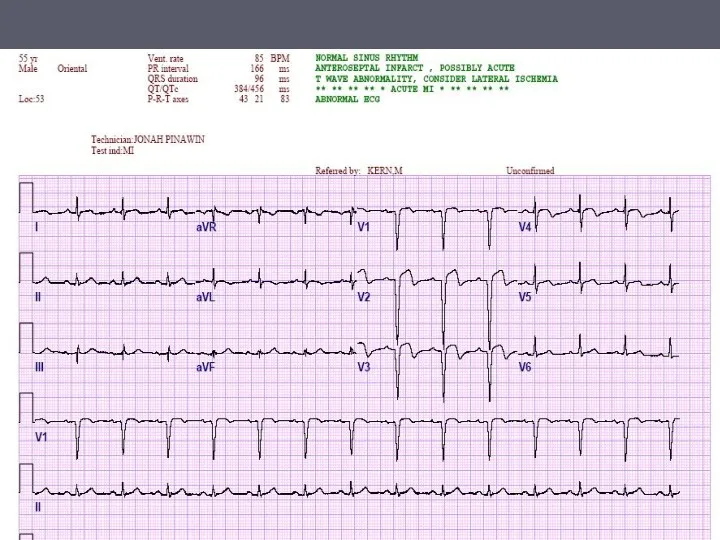
- 115. Anterior Septal (Left Anterior Descending)
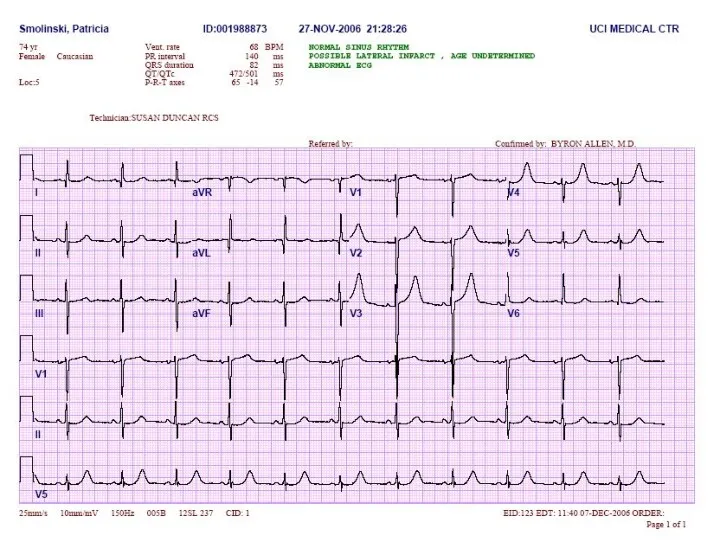
- 116. Anterior Lateral (Left Circumflex)
- 117. Inferior (Right Coronary Artery)
- 124. ST-T Wave Changes
- 125. Strain in Hypertrophy
- 126. Strain in LVH
- 127. Strain in RVH
- 128. Strain vs Infarction
- 129. Pericarditis
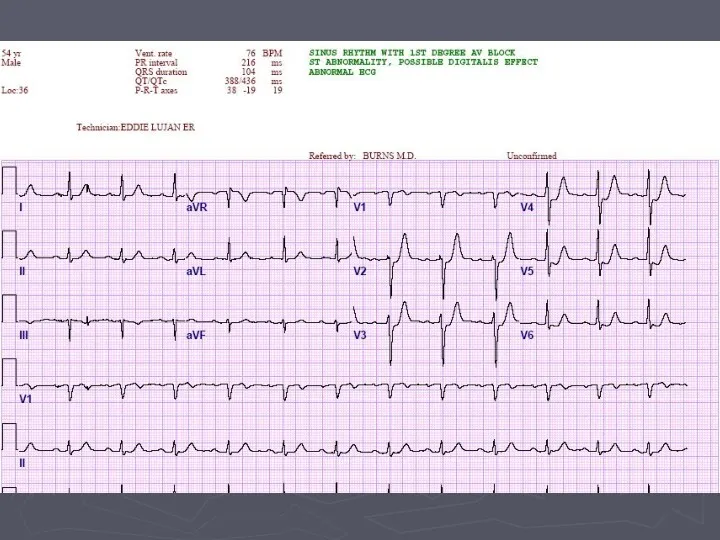
- 130. Digoxin Changes
- 131. Ventricular Aneurysm
- 132. T waves
- 133. Summary Basic physiology of the conduction system Origin of a normal EKG Systematic approach to reading
- 149. Скачать презентацию
Outline
Review of the conduction system
QRS breakdown
Rate
Axis
Rhythms
Outline
Review of the conduction system
QRS breakdown
Rate
Axis
Rhythms
The Normal Conduction System
The Normal Conduction System
Waveforms and Intervals
Waveforms and Intervals
EKG Leads
The standard EKG has 12 leads:
3 Standard Limb Leads
3 Augmented
EKG Leads
The standard EKG has 12 leads:
3 Standard Limb Leads
3 Augmented
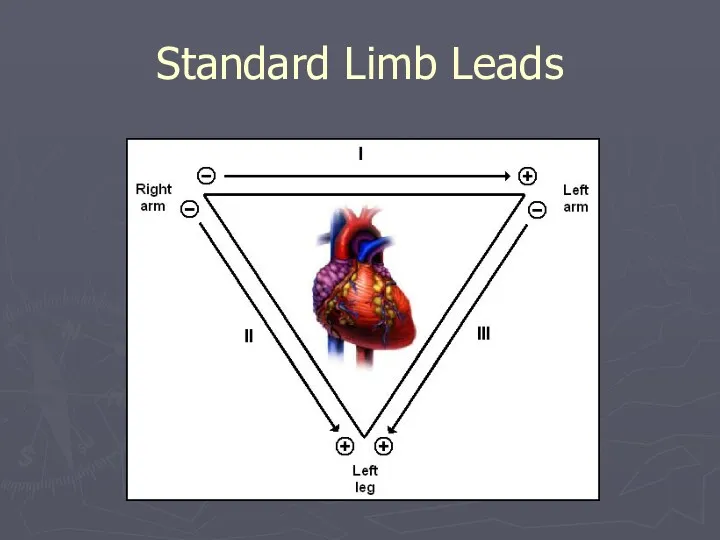
Standard Limb Leads
Standard Limb Leads
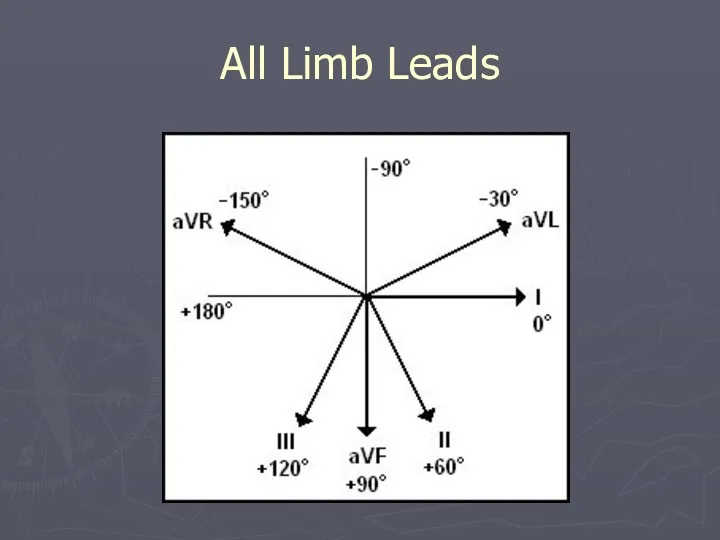
All Limb Leads
All Limb Leads
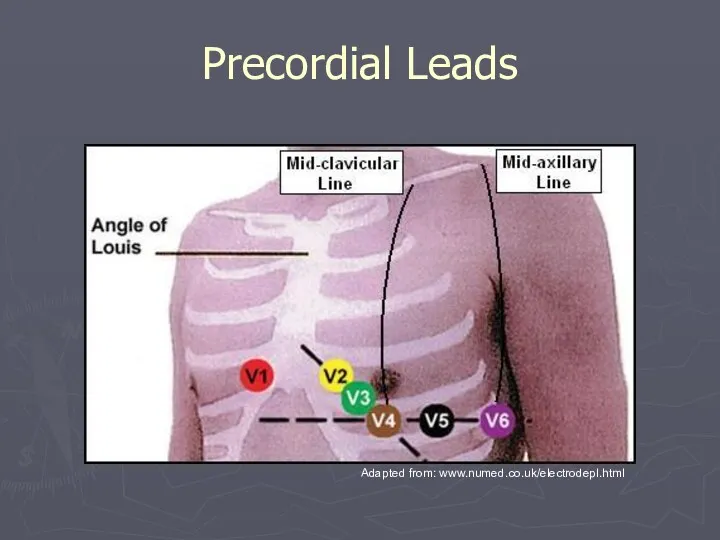
Precordial Leads
Adapted from: www.numed.co.uk/electrodepl.html
Precordial Leads
Adapted from: www.numed.co.uk/electrodepl.html
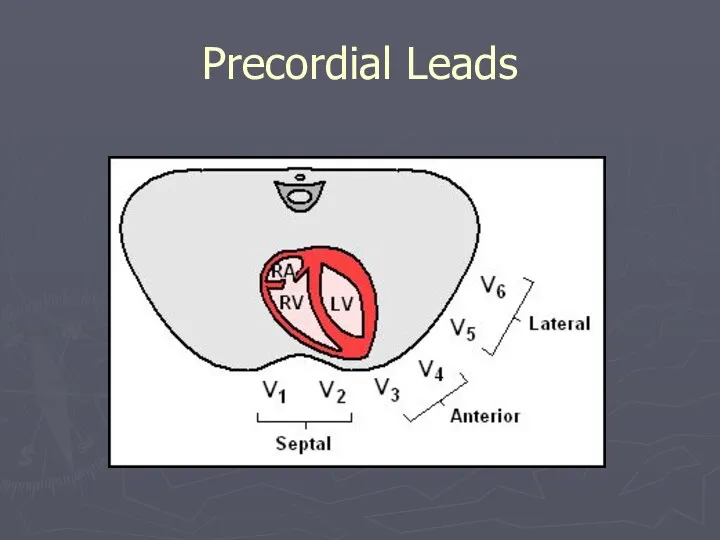
Precordial Leads
Precordial Leads
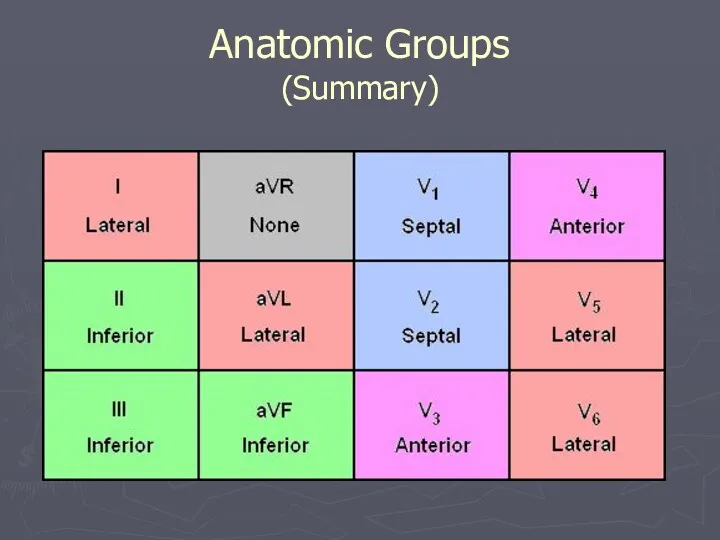
Anatomic Groups
(Summary)
Anatomic Groups
(Summary)
Rate
Rule of 300
10 Second Rule
Rate
Rule of 300
10 Second Rule
Rule of 300
Take the number of “big boxes” between neighboring QRS
Rule of 300
Take the number of “big boxes” between neighboring QRS
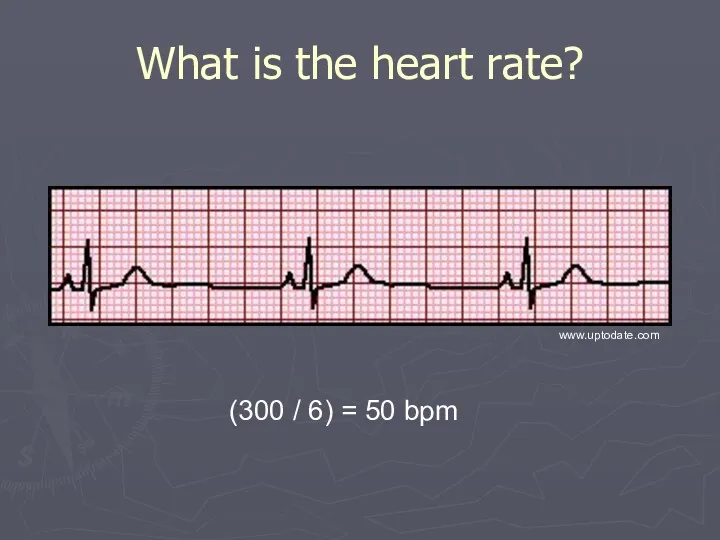
What is the heart rate?
(300 / 6) = 50 bpm
www.uptodate.com
What is the heart rate?
(300 / 6) = 50 bpm
www.uptodate.com
What is the heart rate?
(300 / ~ 4) = ~ 75
What is the heart rate?
(300 / ~ 4) = ~ 75
What is the heart rate?
(300 / 1.5) = 200 bpm
What is the heart rate?
(300 / 1.5) = 200 bpm
The Rule of 300
It may be easiest to memorize the following
The Rule of 300
It may be easiest to memorize the following
10 Second Rule
As most EKGs record 10 seconds of rhythm per
10 Second Rule
As most EKGs record 10 seconds of rhythm per
What is the heart rate?
33 x 6 = 198 bpm
The Alan
What is the heart rate?
33 x 6 = 198 bpm
The Alan
The QRS Axis
By near-consensus, the normal QRS axis is defined as
The QRS Axis
By near-consensus, the normal QRS axis is defined as
Determining the Axis
The Quadrant Approach
The Equiphasic Approach
Determining the Axis
The Quadrant Approach
The Equiphasic Approach
Determining the Axis
Predominantly Positive
Predominantly Negative
Equiphasic
Determining the Axis
Predominantly Positive
Predominantly Negative
Equiphasic
The Quadrant Approach
1. Examine the QRS complex in leads I and
The Quadrant Approach
1. Examine the QRS complex in leads I and
The Quadrant Approach
2. In the event that LAD is present, examine
The Quadrant Approach
2. In the event that LAD is present, examine
Quadrant Approach: Example 1
Negative in I, positive in aVF ? RAD
The
Quadrant Approach: Example 1
Negative in I, positive in aVF ? RAD
The
Quadrant Approach: Example 2
Positive in I, negative in aVF ? Predominantly
Quadrant Approach: Example 2
Positive in I, negative in aVF ? Predominantly
The Equiphasic Approach
1. Determine which lead contains the most equiphasic QRS
The Equiphasic Approach
1. Determine which lead contains the most equiphasic QRS
Equiphasic Approach: Example 1
Equiphasic in aVF ? Predominantly positive in I
Equiphasic Approach: Example 1
Equiphasic in aVF ? Predominantly positive in I
Equiphasic Approach: Example 2
Equiphasic in II ? Predominantly negative in aVL
Equiphasic Approach: Example 2
Equiphasic in II ? Predominantly negative in aVL
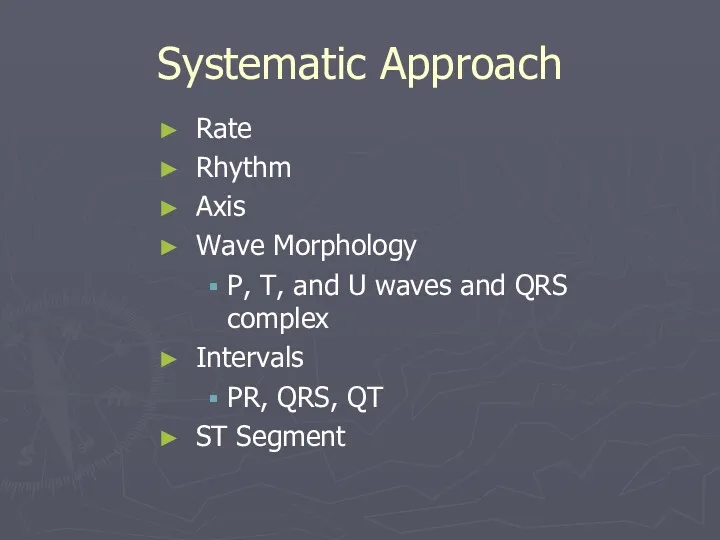
Systematic Approach
Rate
Rhythm
Axis
Wave Morphology
P, T, and U waves and QRS complex
Intervals
PR,
Systematic Approach
Rate
Rhythm
Axis
Wave Morphology
P, T, and U waves and QRS complex
Intervals
PR,
Rhythms/Arrhythmias
Sinus
Atrial
Junctional
Ventricular
Rhythms/Arrhythmias
Sinus
Atrial
Junctional
Ventricular
Sinus Rhythms: Criteria/Types
P waves upright in I, II, aVF
Constant P-P/R-R interval
Rate
Narrow
Sinus Rhythms: Criteria/Types
P waves upright in I, II, aVF
Constant P-P/R-R interval
Rate
Narrow
Sinus Arrhythmias: Criteria/Types
Normal Sinus Rhythm
Sinus Bradycardia
Sinus Tachycardia
Sinus Arrhythmia
Sinus Arrhythmias: Criteria/Types
Normal Sinus Rhythm
Sinus Bradycardia
Sinus Tachycardia
Sinus Arrhythmia
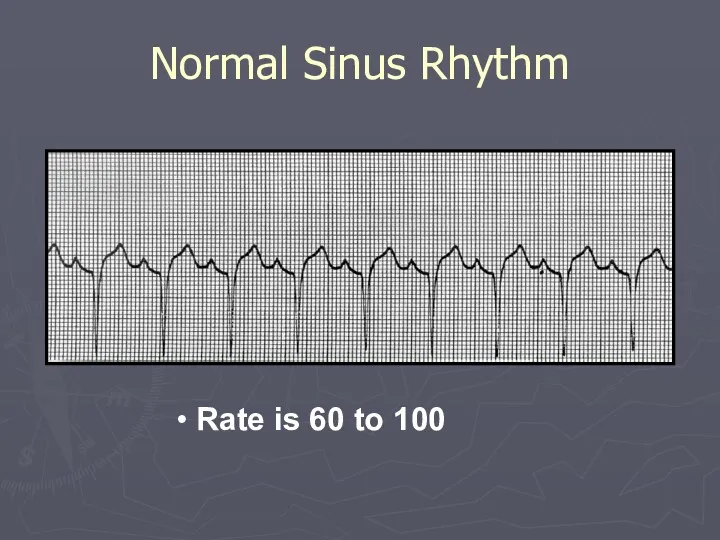
Normal Sinus Rhythm
Rate is 60 to 100
Normal Sinus Rhythm
Rate is 60 to 100
Sinus Bradycardia
Can be normal variant
Can result from medication
Look
Sinus Bradycardia
Can be normal variant
Can result from medication
Look
Sinus Tachycardia
May be caused by exercise, fever, hyperthyroidism
Look for
Sinus Tachycardia
May be caused by exercise, fever, hyperthyroidism
Look for
Sinus Arrhythmia
Seen in young patients
Secondary to breathing
Heart beats
Sinus Arrhythmia
Seen in young patients
Secondary to breathing
Heart beats
Atrial Arrhythmias: Criteria/Types
P waves inverted in I, II and aVF
Abnormal shape
Notched
Flattened
Diphasic
Narrow
Atrial Arrhythmias: Criteria/Types
P waves inverted in I, II and aVF
Abnormal shape
Notched
Flattened
Diphasic
Narrow
Atrial Arrhythmias: Criteria/Types
Premature Atrial Contractions
Ectopic Atrial Rhythm
Wandering Atrial Pacemaker
Multifocal Atrial Tachycardia
Atrial
Atrial Arrhythmias: Criteria/Types
Premature Atrial Contractions
Ectopic Atrial Rhythm
Wandering Atrial Pacemaker
Multifocal Atrial Tachycardia
Atrial
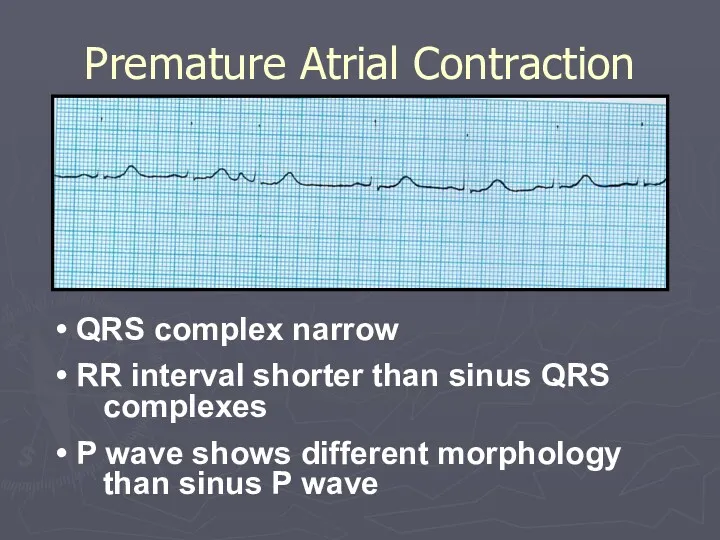
Premature Atrial Contraction
QRS complex narrow
RR interval shorter than sinus
Premature Atrial Contraction
QRS complex narrow
RR interval shorter than sinus
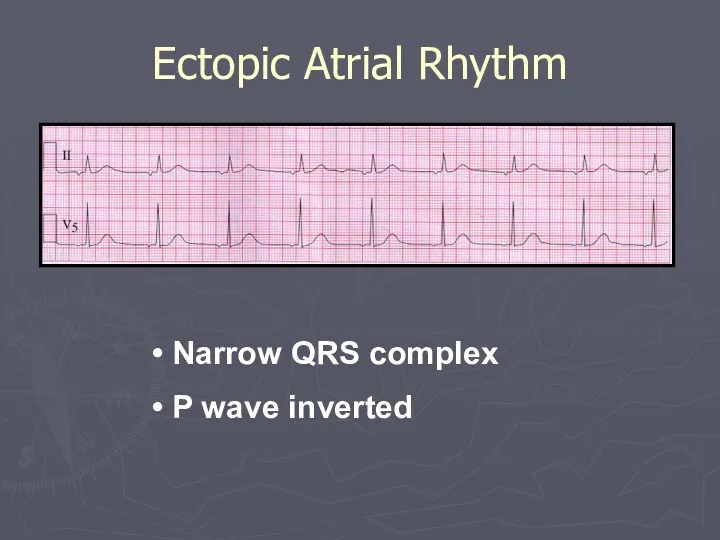
Ectopic Atrial Rhythm
Narrow QRS complex
P wave inverted
Ectopic Atrial Rhythm
Narrow QRS complex
P wave inverted
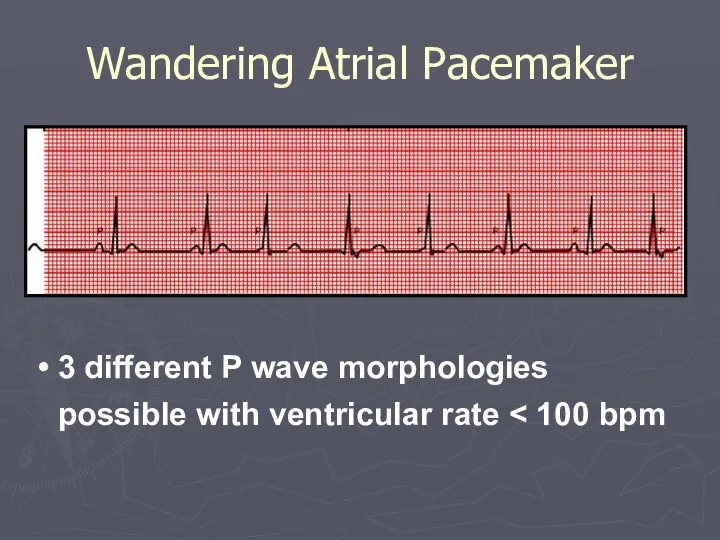
Wandering Atrial Pacemaker
3 different P wave morphologies possible with ventricular
Wandering Atrial Pacemaker
3 different P wave morphologies possible with ventricular
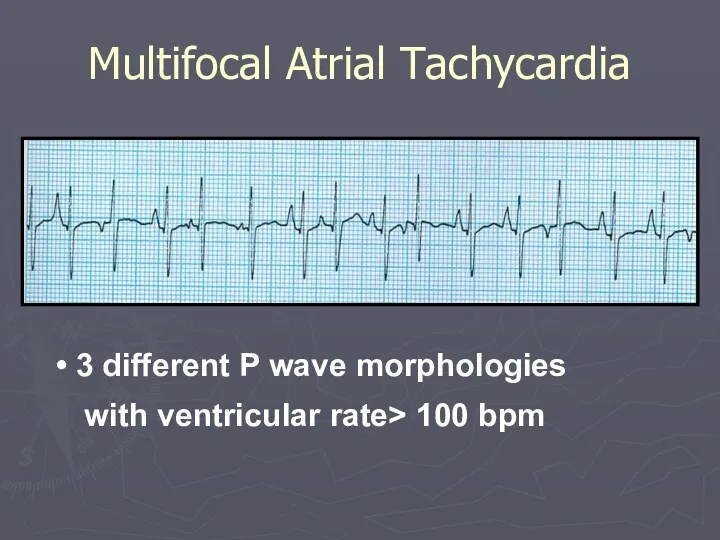
Multifocal Atrial Tachycardia
3 different P wave morphologies with ventricular rate>
Multifocal Atrial Tachycardia
3 different P wave morphologies with ventricular rate>
Atrial Flutter
Regular ventricular rate 150 bpm
Varying ratios of F
Atrial Flutter
Regular ventricular rate 150 bpm
Varying ratios of F
Atrial Flutter
Tracing shows 6:1 conduction
Atrial Flutter
Tracing shows 6:1 conduction
Atrial Fibrillation
Tracing shows irregularly irregular rhythm with no P waves
Atrial Fibrillation
Tracing shows irregularly irregular rhythm with no P waves
Atrial Fibrillation
Tracing shows irregularly irregular rhythm with no P waves
Atrial Fibrillation
Tracing shows irregularly irregular rhythm with no P waves
Atrial Tachycardia
Tracing shows regular ventricular rate with P waves that
Atrial Tachycardia
Tracing shows regular ventricular rate with P waves that
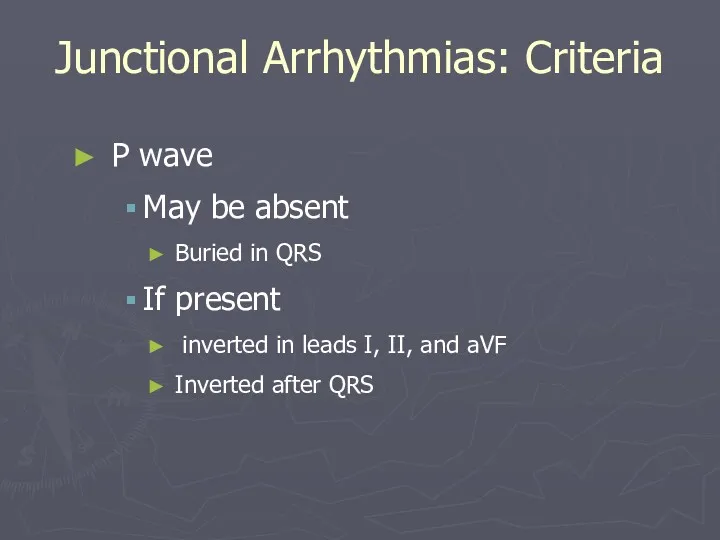
P wave
May be absent
Buried in QRS
If present
inverted in leads
P wave
May be absent
Buried in QRS
If present
inverted in leads
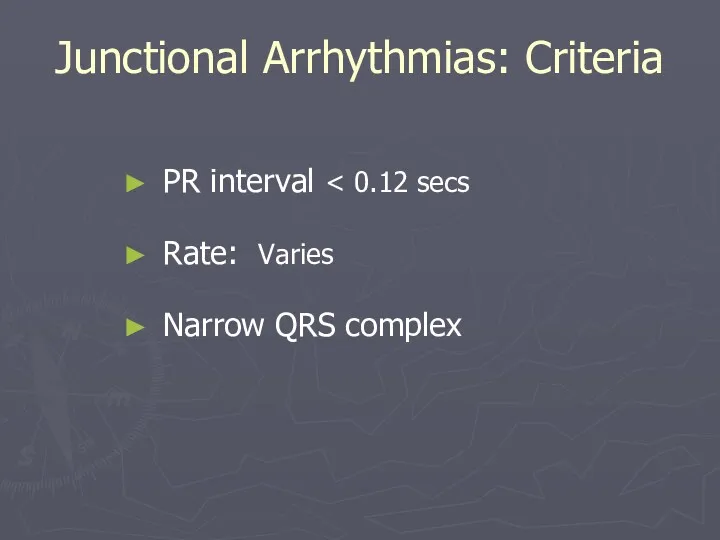
PR interval < 0.12 secs
Rate: Varies
Narrow QRS complex
Junctional Arrhythmias: Criteria
PR interval < 0.12 secs
Rate: Varies
Narrow QRS complex
Junctional Arrhythmias: Criteria
Junctional Arrhythmias: Types
Premature Junctional Contractions
Junctional Escape Rhythm
Accelerated Junctional Tachycardia
Junctional Tachycardia
Reentrant Tachycardia
AVNRT
Junctional Arrhythmias: Types
Premature Junctional Contractions
Junctional Escape Rhythm
Accelerated Junctional Tachycardia
Junctional Tachycardia
Reentrant Tachycardia
AVNRT
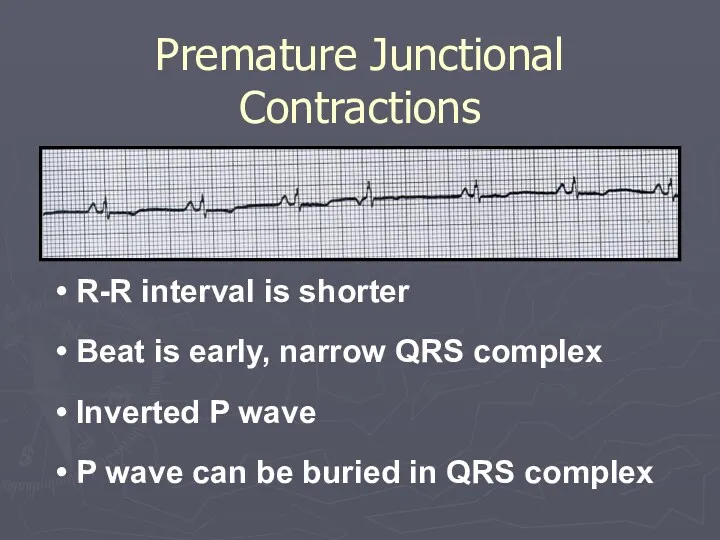
Premature Junctional Contractions
R-R interval is shorter
Beat is early, narrow
Premature Junctional Contractions
R-R interval is shorter
Beat is early, narrow
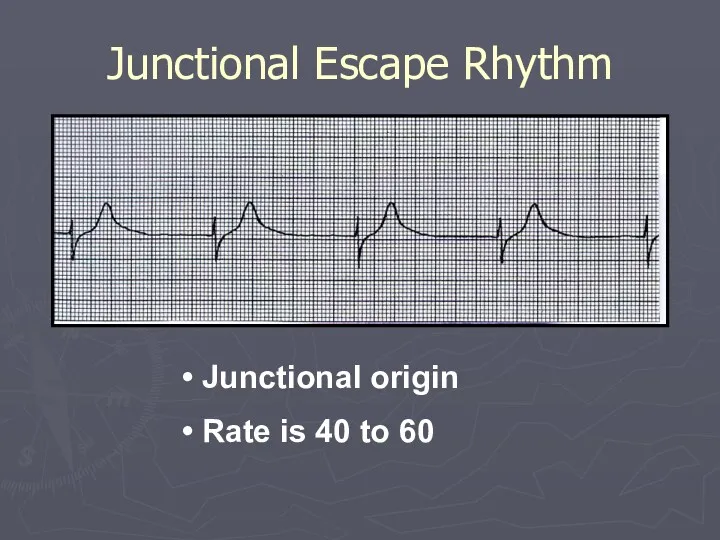
Junctional Escape Rhythm
Junctional origin
Rate is 40 to 60
Junctional Escape Rhythm
Junctional origin
Rate is 40 to 60
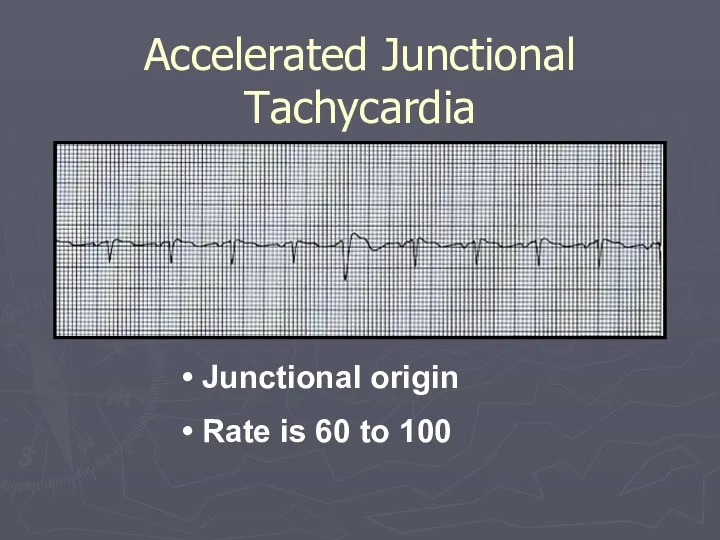
Accelerated Junctional Tachycardia
Junctional origin
Rate is 60 to 100
Accelerated Junctional Tachycardia
Junctional origin
Rate is 60 to 100
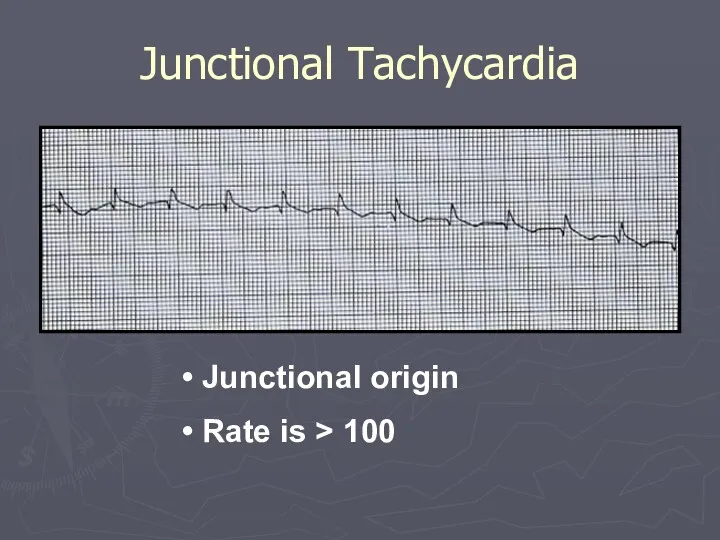
Junctional Tachycardia
Junctional origin
Rate is > 100
Junctional Tachycardia
Junctional origin
Rate is > 100
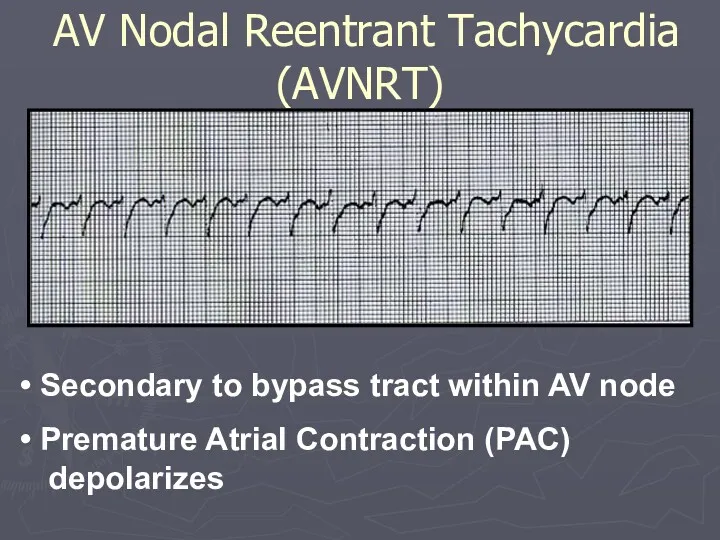
Secondary to bypass tract within AV node
Premature Atrial Contraction
Secondary to bypass tract within AV node
Premature Atrial Contraction
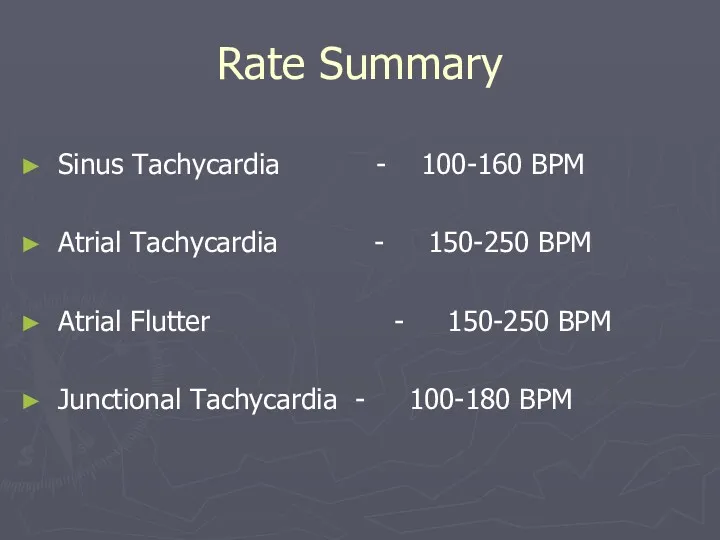
Rate Summary
Sinus Tachycardia - 100-160 BPM
Atrial Tachycardia - 150-250 BPM
Atrial Flutter
Rate Summary
Sinus Tachycardia - 100-160 BPM
Atrial Tachycardia - 150-250 BPM
Atrial Flutter
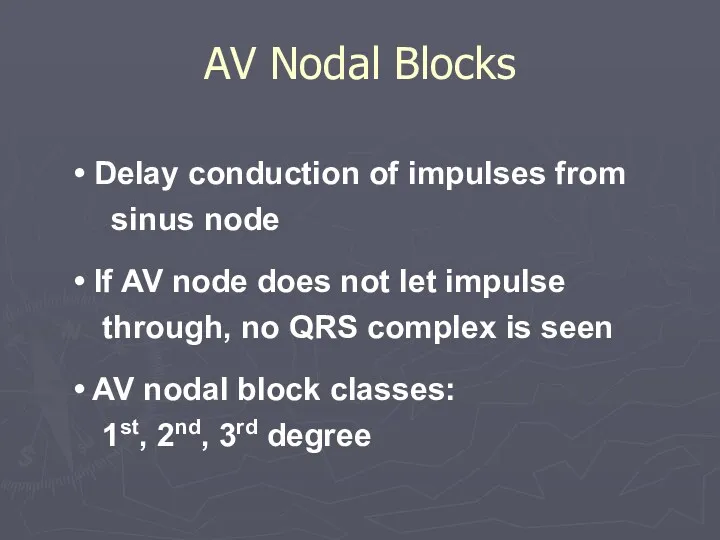
AV Nodal Blocks
Delay conduction of impulses from sinus node
If
AV Nodal Blocks
Delay conduction of impulses from sinus node
If
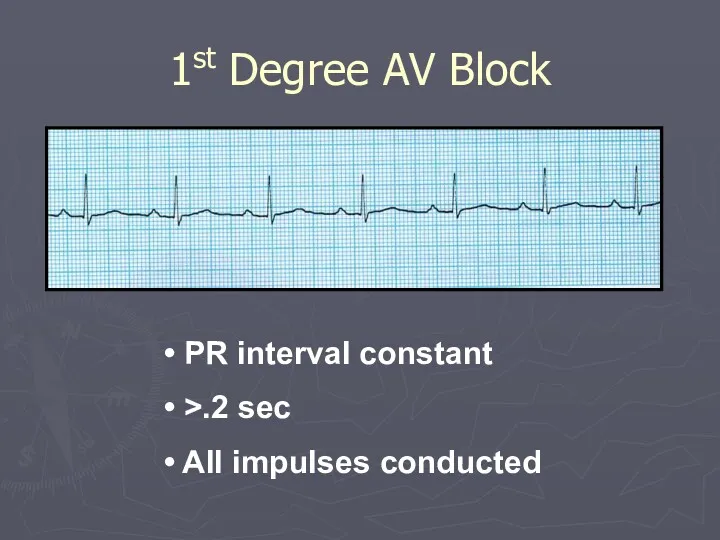
1st Degree AV Block
PR interval constant
>.2 sec
All impulses
1st Degree AV Block
PR interval constant
>.2 sec
All impulses
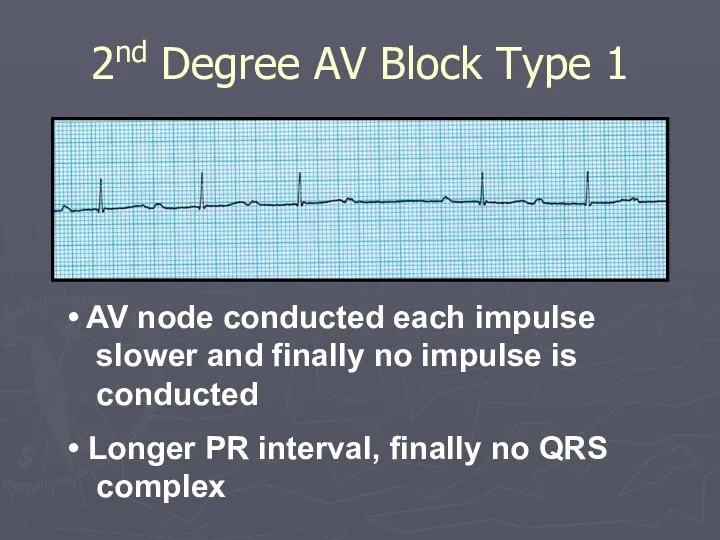
2nd Degree AV Block Type 1
AV node conducted each impulse
2nd Degree AV Block Type 1
AV node conducted each impulse
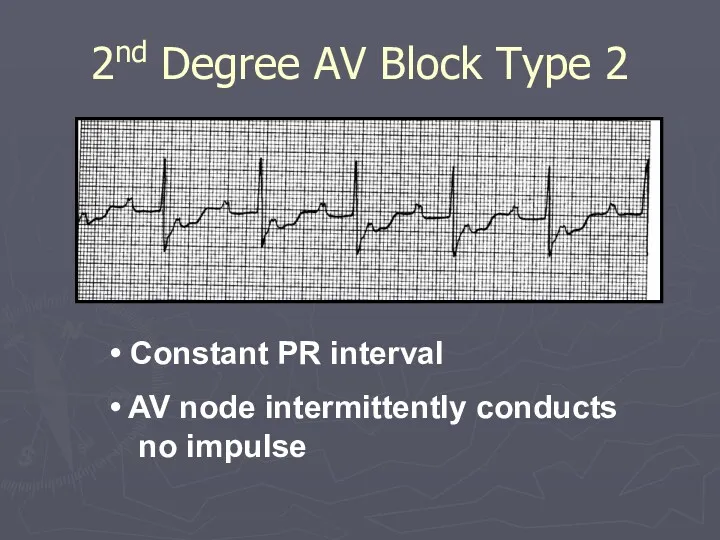
2nd Degree AV Block Type 2
Constant PR interval
AV node
2nd Degree AV Block Type 2
Constant PR interval
AV node
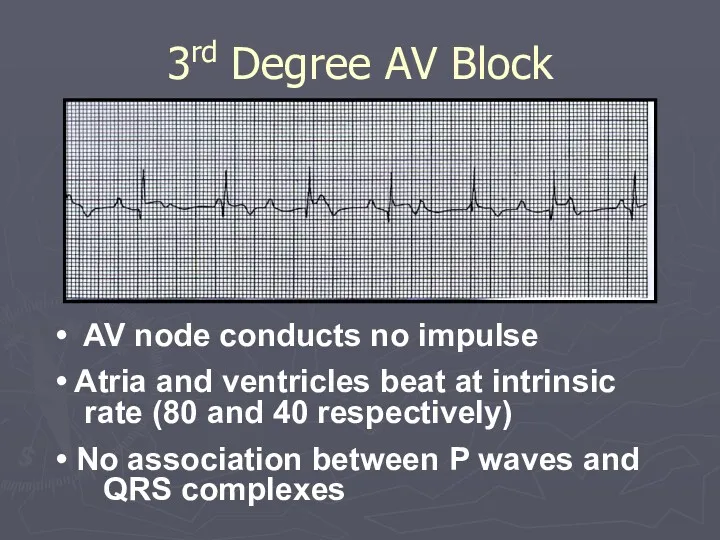
AV node conducts no impulse
Atria and ventricles beat at
AV node conducts no impulse
Atria and ventricles beat at
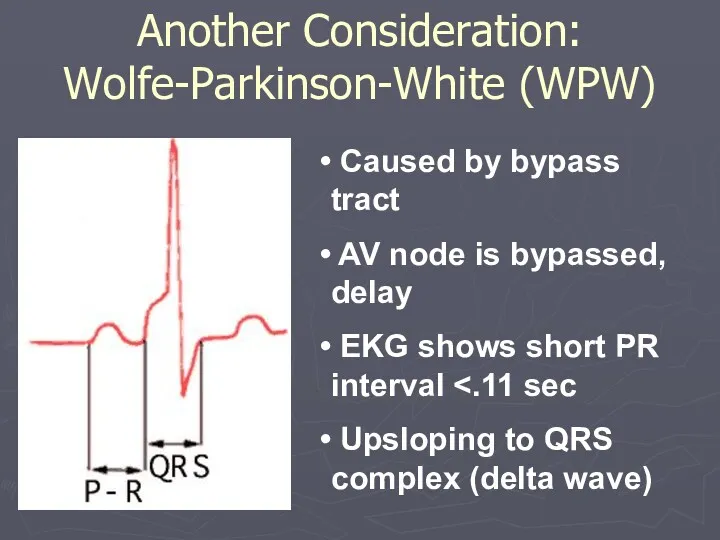
Caused by bypass tract
AV node is bypassed, delay
EKG
Caused by bypass tract
AV node is bypassed, delay
EKG
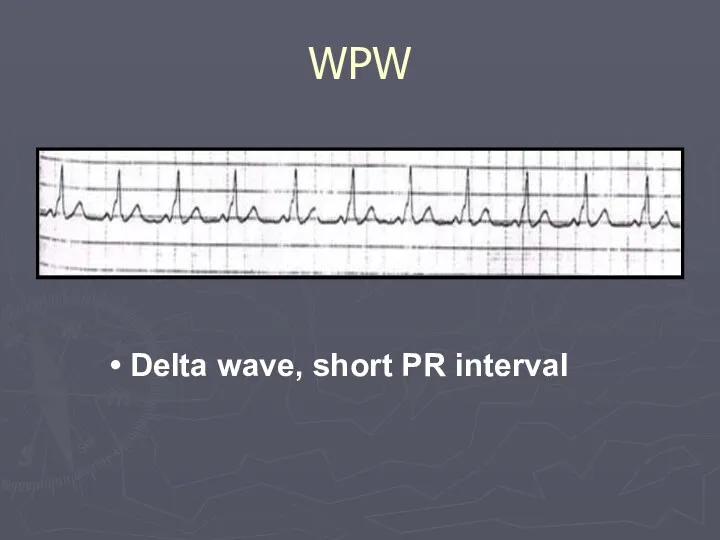
Delta wave, short PR interval
WPW
Delta wave, short PR interval
WPW
Ventricular Arrhythmias: Criteria/Types
Wide QRS complex
Rate :
variable
No P waves
Premature Ventricular Contractions
Idioventricular
Ventricular Arrhythmias: Criteria/Types
Wide QRS complex
Rate :
variable
No P waves
Premature Ventricular Contractions
Idioventricular
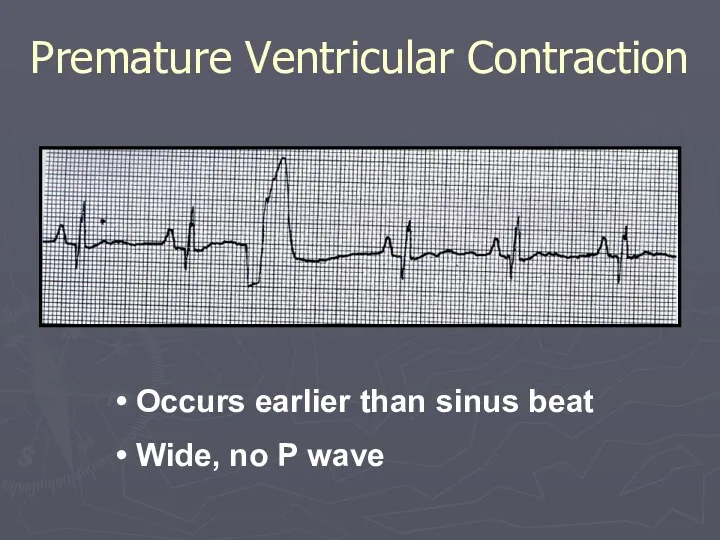
Occurs earlier than sinus beat
Wide, no P wave
Premature Ventricular
Occurs earlier than sinus beat
Wide, no P wave
Premature Ventricular
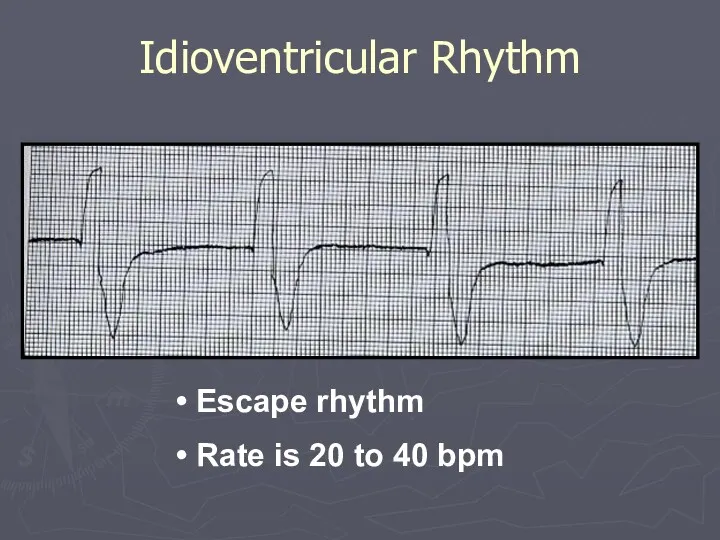
Escape rhythm
Rate is 20 to 40 bpm
Idioventricular Rhythm
Escape rhythm
Rate is 20 to 40 bpm
Idioventricular Rhythm
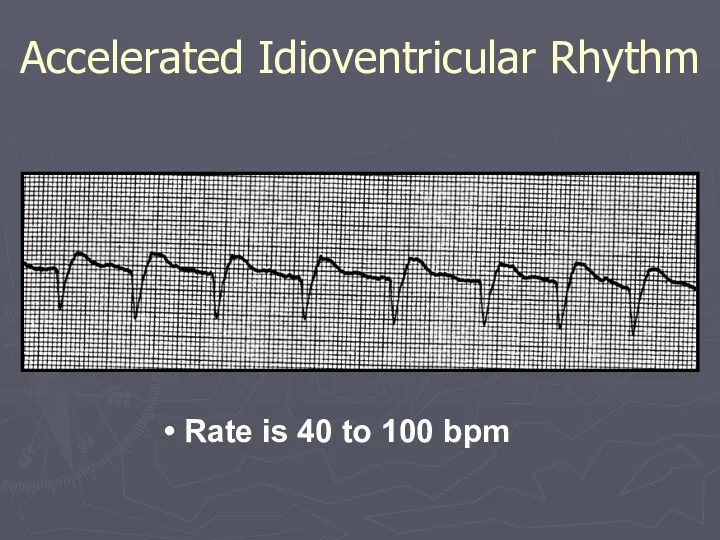
Rate is 40 to 100 bpm
Accelerated Idioventricular Rhythm
Rate is 40 to 100 bpm
Accelerated Idioventricular Rhythm
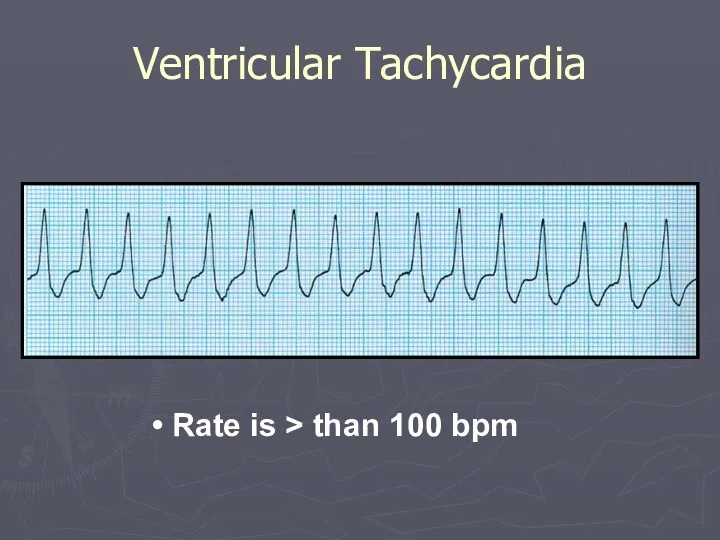
Rate is > than 100 bpm
Ventricular Tachycardia
Rate is > than 100 bpm
Ventricular Tachycardia
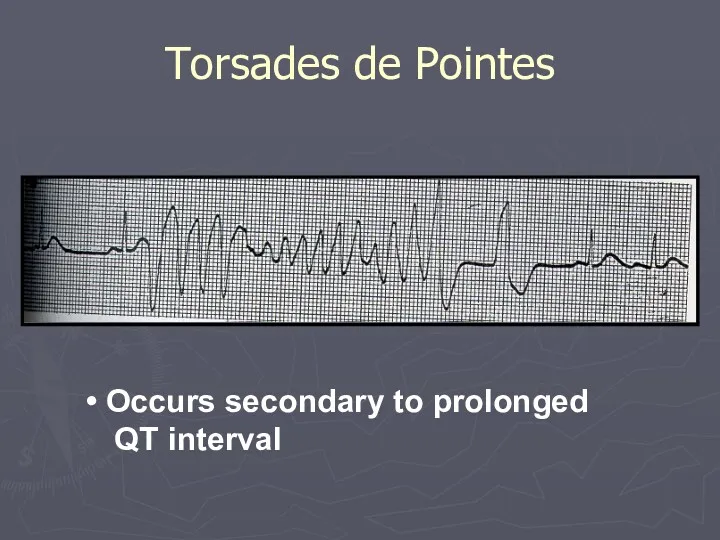
Torsades de Pointes
Occurs secondary to prolonged QT interval
Torsades de Pointes
Occurs secondary to prolonged QT interval
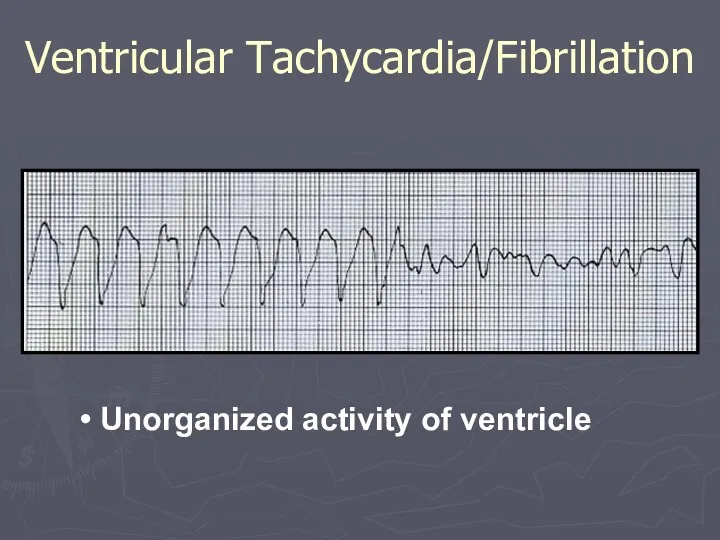
Unorganized activity of ventricle
Ventricular Tachycardia/Fibrillation
Unorganized activity of ventricle
Ventricular Tachycardia/Fibrillation
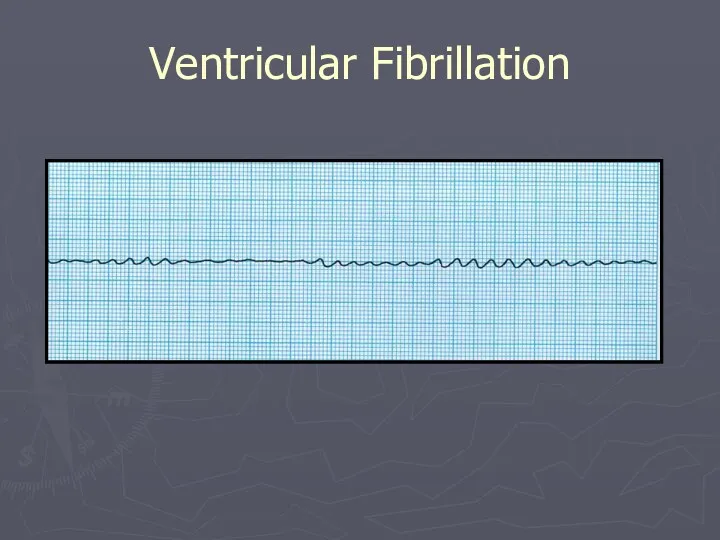
Ventricular Fibrillation
Ventricular Fibrillation
Chamber Enlargements
Chamber Enlargements
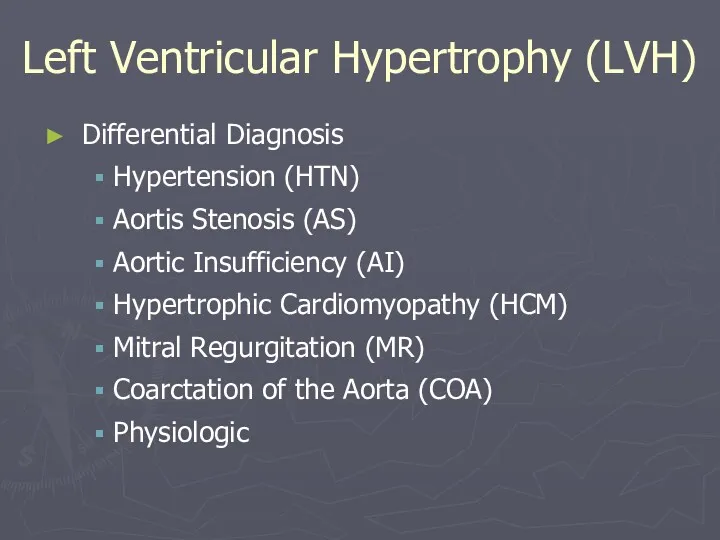
Differential Diagnosis
Hypertension (HTN)
Aortis Stenosis (AS)
Aortic Insufficiency (AI)
Hypertrophic Cardiomyopathy (HCM)
Mitral Regurgitation (MR)
Coarctation
Differential Diagnosis
Hypertension (HTN)
Aortis Stenosis (AS)
Aortic Insufficiency (AI)
Hypertrophic Cardiomyopathy (HCM)
Mitral Regurgitation (MR)
Coarctation
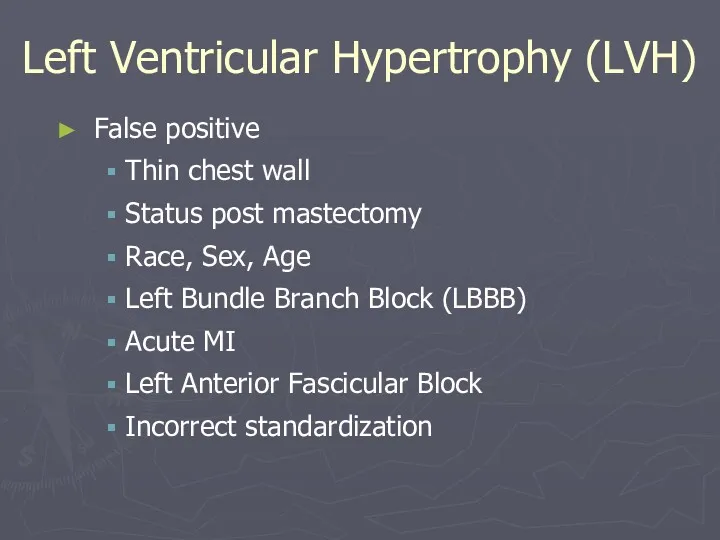
False positive
Thin chest wall
Status post mastectomy
Race, Sex, Age
Left Bundle Branch Block
False positive
Thin chest wall
Status post mastectomy
Race, Sex, Age
Left Bundle Branch Block
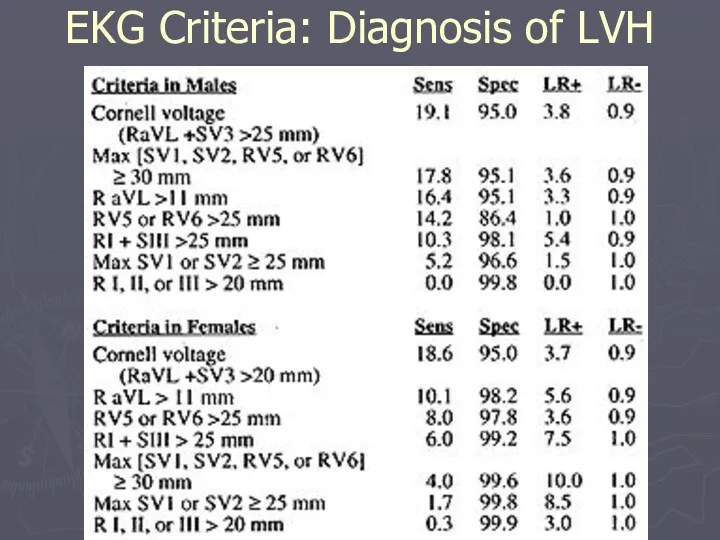
EKG Criteria: Diagnosis of LVH
EKG Criteria: Diagnosis of LVH
EKG Criteria
-S V1, V2 + R V5,V6 > 35 42.5%
EKG Criteria
-S V1, V2 + R V5,V6 > 35 42.5%
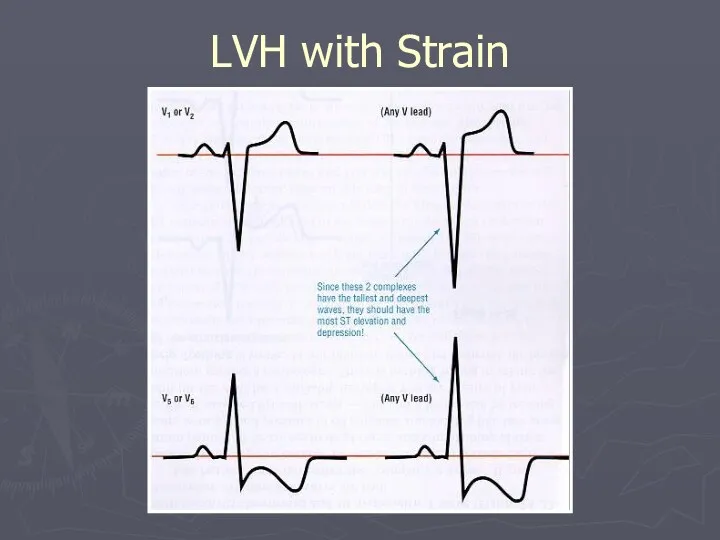
LVH with Strain
LVH with Strain
Right Ventricular Hypertrophy
Reversal of precordial pattern
R waves prominent in V1 and
Right Ventricular Hypertrophy
Reversal of precordial pattern
R waves prominent in V1 and
Right Ventricular Hypertrophy
Right Ventricular Hypertrophy
Right Ventricular Hypertrophy: Causes
Chronic Obstructive Pulmonary Disease
Pulmonary HTN
Primary
Pulmonary Embolus
Mitral Stenosis
Mitral Regurgitation
Chronic
Right Ventricular Hypertrophy: Causes
Chronic Obstructive Pulmonary Disease
Pulmonary HTN
Primary
Pulmonary Embolus
Mitral Stenosis
Mitral Regurgitation
Chronic
Right Ventricular Hypertrophy: Causes
Tricuspid Regurgitation
Atrial Septal Defect
Pulmonary Stenosis
Tetralogy of Fallot
Ventricular Septal
Right Ventricular Hypertrophy: Causes
Tricuspid Regurgitation
Atrial Septal Defect
Pulmonary Stenosis
Tetralogy of Fallot
Ventricular Septal
Mitral Stenosis
Mitral Regurgitation
Left ventricular hypertrophy
Hypertension
Aortic Stenosis
Aortic Insufficiency
Hypertrophic Cardiomyopathy
Left Atrial Enlargement: Causes
Mitral Stenosis
Mitral Regurgitation
Left ventricular hypertrophy
Hypertension
Aortic Stenosis
Aortic Insufficiency
Hypertrophic Cardiomyopathy
Left Atrial Enlargement: Causes
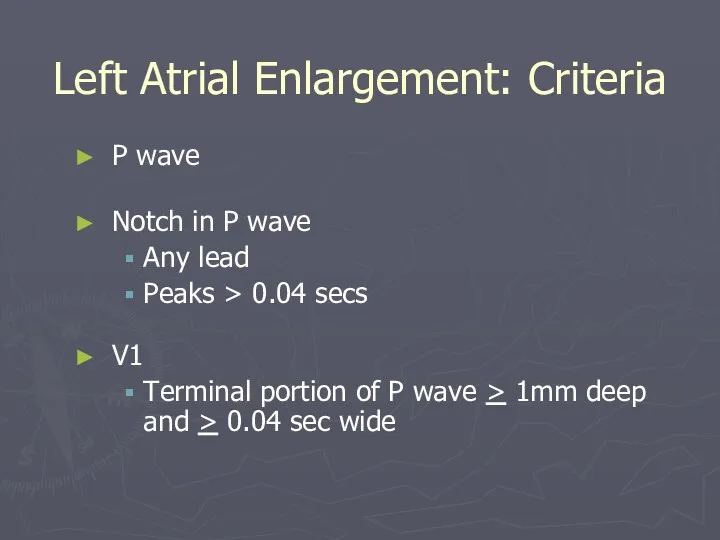
Left Atrial Enlargement: Criteria
P wave
Notch in P wave
Any lead
Peaks > 0.04
Left Atrial Enlargement: Criteria
P wave
Notch in P wave
Any lead
Peaks > 0.04
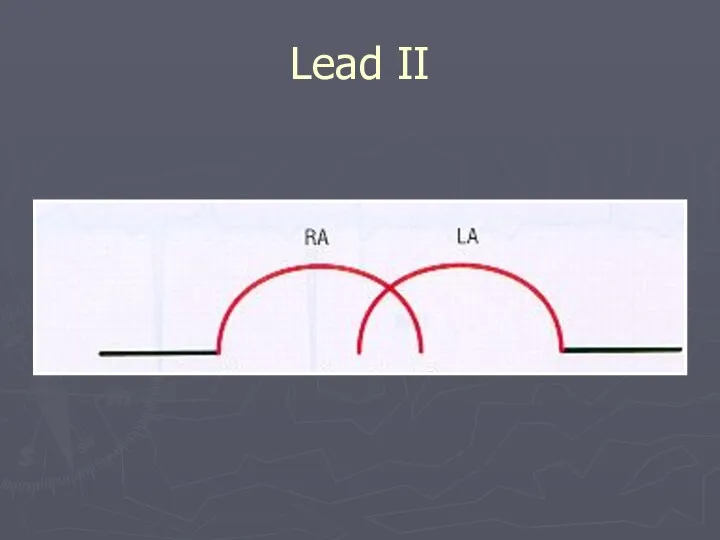
Lead II
Lead II
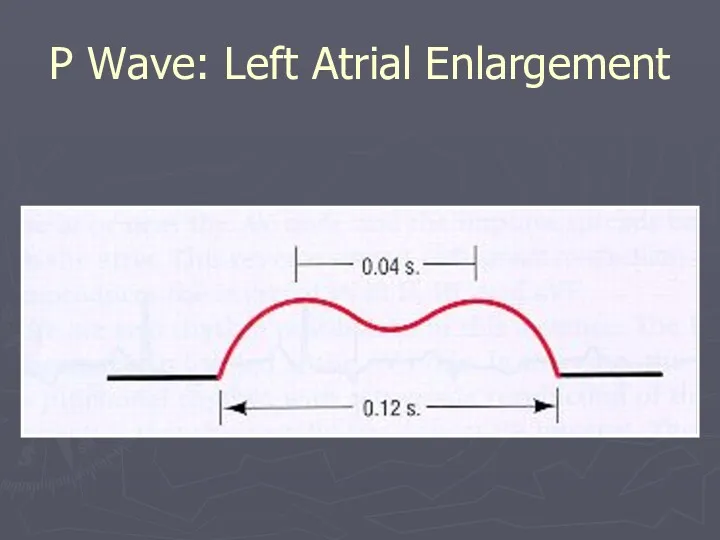
P Wave: Left Atrial Enlargement
P Wave: Left Atrial Enlargement
Left Atrial Enlargement
Lead V1
Left Atrial Enlargement
Lead V1
CHD
Tricuspid Stenosis
Pulmonary Stenosis
COPD
Pulmonary HTN
Pulmonary Embolus
Mitral Regurgitation
Mitral Stenosis
Right Atrial Enlargement: Causes
CHD
Tricuspid Stenosis
Pulmonary Stenosis
COPD
Pulmonary HTN
Pulmonary Embolus
Mitral Regurgitation
Mitral Stenosis
Right Atrial Enlargement: Causes
Tall, peaked P wave
> 2.5 mm in any lead
Most prominent P
Tall, peaked P wave
> 2.5 mm in any lead
Most prominent P
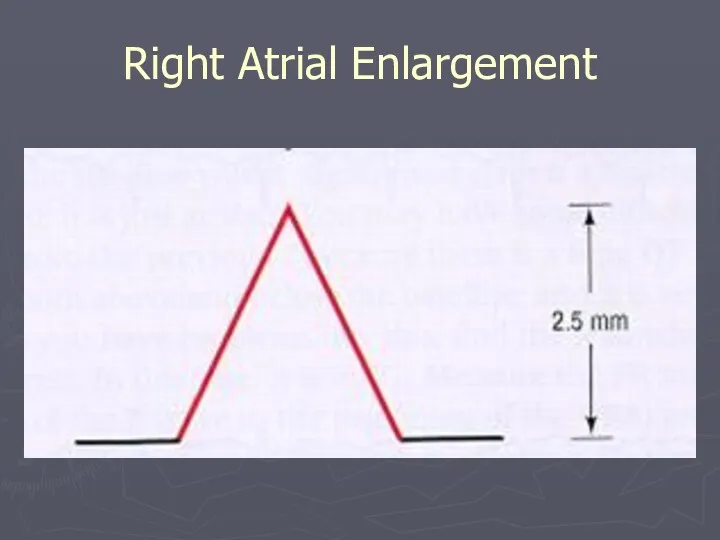
Right Atrial Enlargement
Right Atrial Enlargement

Bundle Branch Blocks
Bundle Branch Blocks
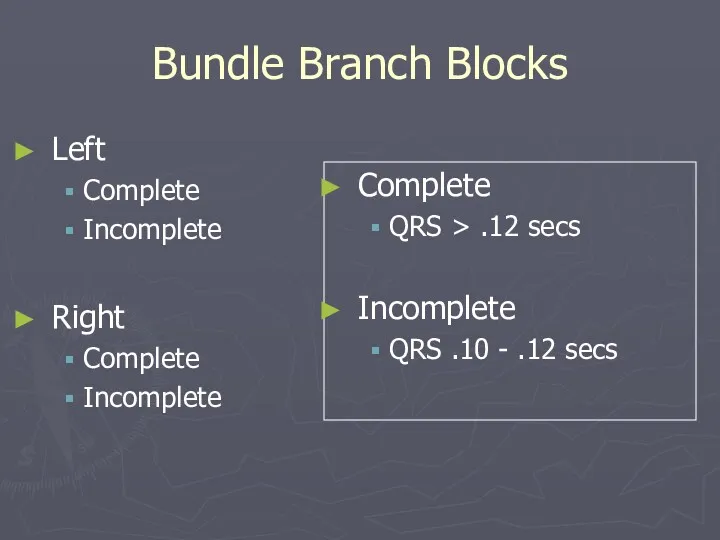
Bundle Branch Blocks
Complete
QRS > .12 secs
Incomplete
QRS .10 - .12 secs
Left
Complete
Incomplete
Right
Complete
Incomplete
Bundle Branch Blocks
Complete
QRS > .12 secs
Incomplete
QRS .10 - .12 secs
Left
Complete
Incomplete
Right
Complete
Incomplete
Normal variant
Idiopathic degeneration of the conduction system
Cardiomyopathy
Ischemic heart disease
Aortic Stenosis
Hyperkalemia
Left Ventricular
Normal variant
Idiopathic degeneration of the conduction system
Cardiomyopathy
Ischemic heart disease
Aortic Stenosis
Hyperkalemia
Left Ventricular
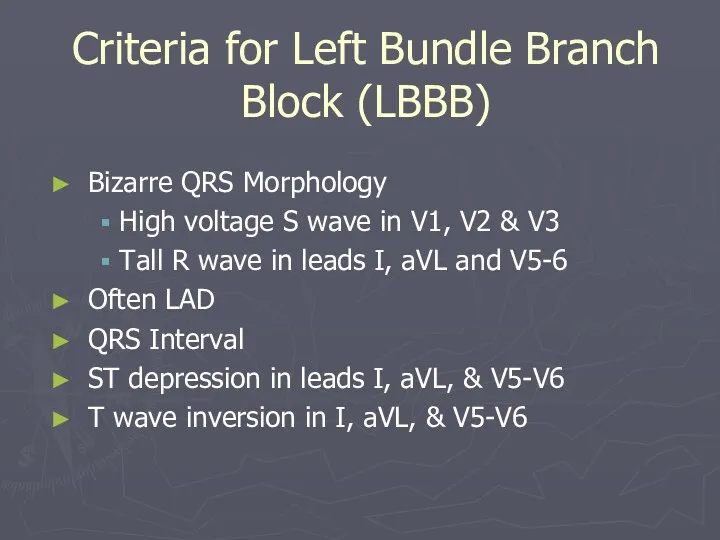
Criteria for Left Bundle Branch Block (LBBB)
Bizarre QRS Morphology
High voltage S
Criteria for Left Bundle Branch Block (LBBB)
Bizarre QRS Morphology
High voltage S
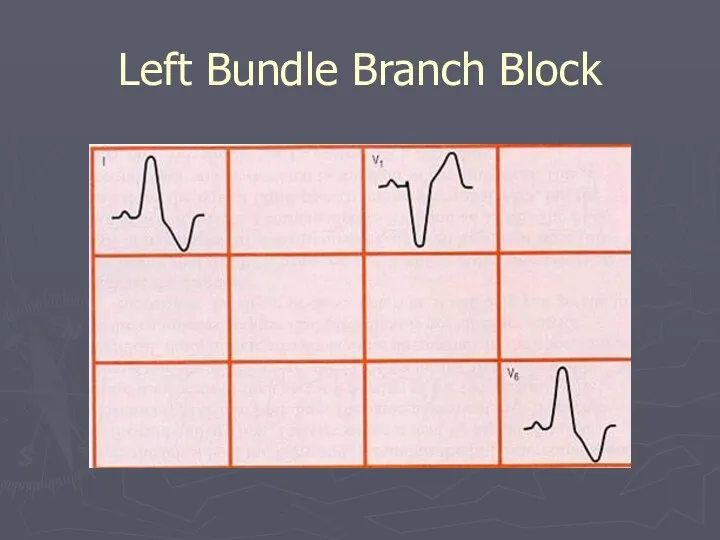
Left Bundle Branch Block
Left Bundle Branch Block
Right Bundle Branch Block: Causes
Idiopathic degeneration of the conduction system
Ischemic heart
Right Bundle Branch Block: Causes
Idiopathic degeneration of the conduction system
Ischemic heart
Criteria for Right Bundle Branch Block (RBBB)
QRS morphology
Wide S wave in
Criteria for Right Bundle Branch Block (RBBB)
QRS morphology
Wide S wave in
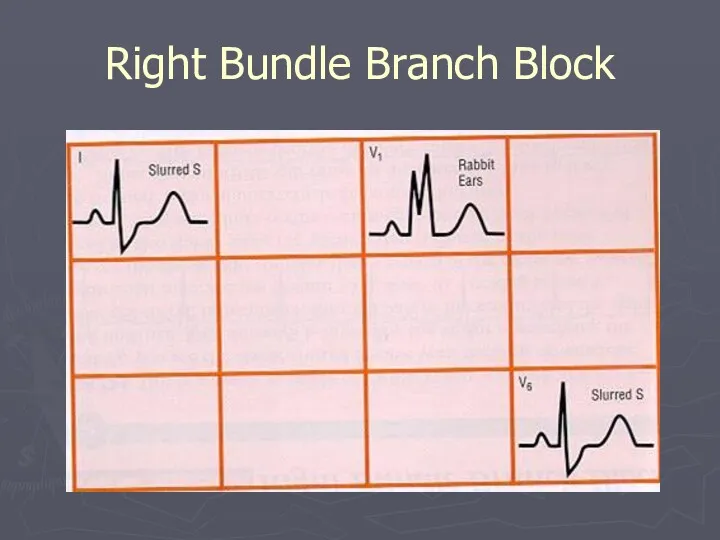
Right Bundle Branch Block
Right Bundle Branch Block
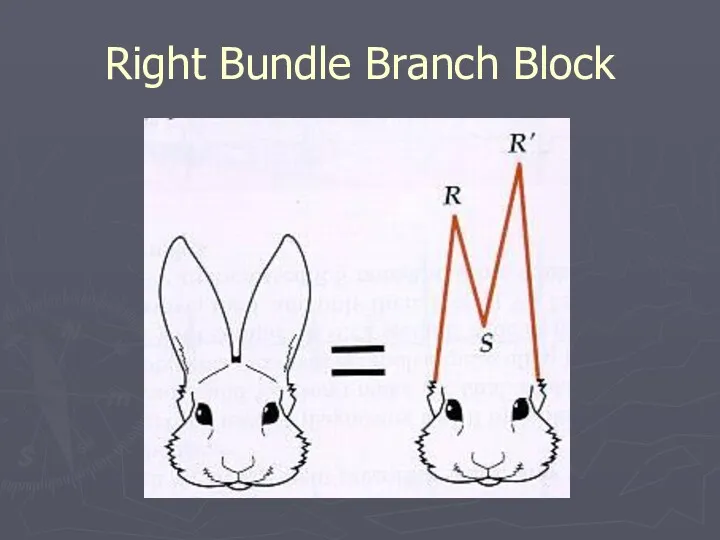
Right Bundle Branch Block
Right Bundle Branch Block
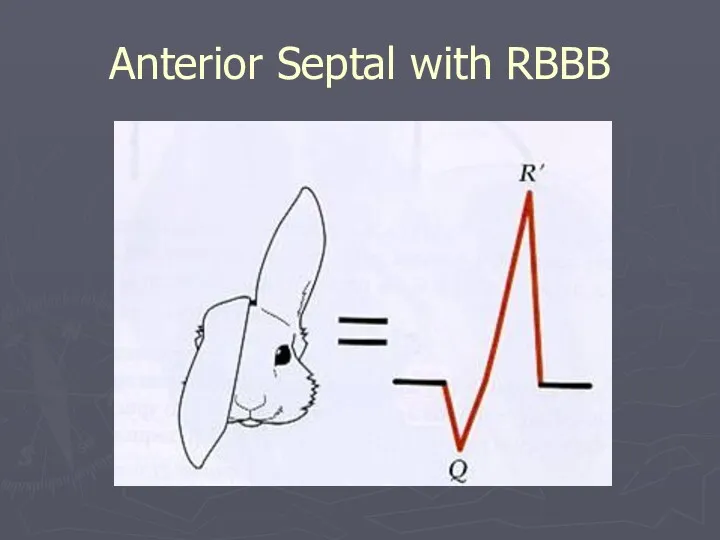
Anterior Septal with RBBB
Anterior Septal with RBBB
Ischemia and Infarction
Ischemia and Infarction
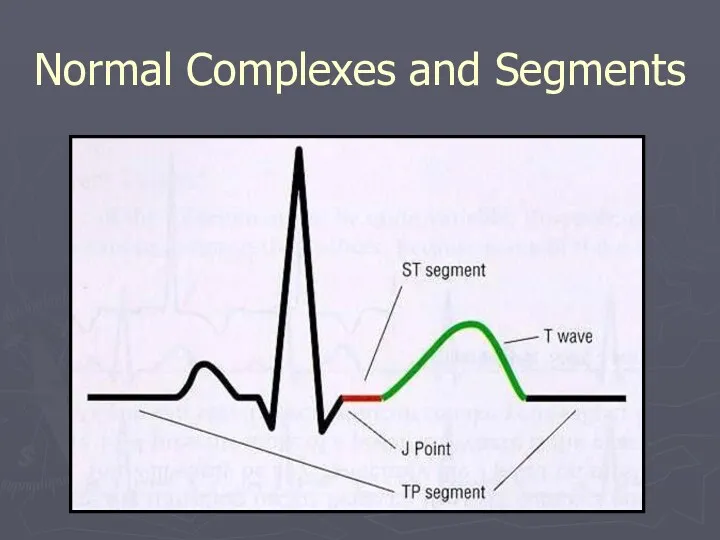
Normal Complexes and Segments
Normal Complexes and Segments
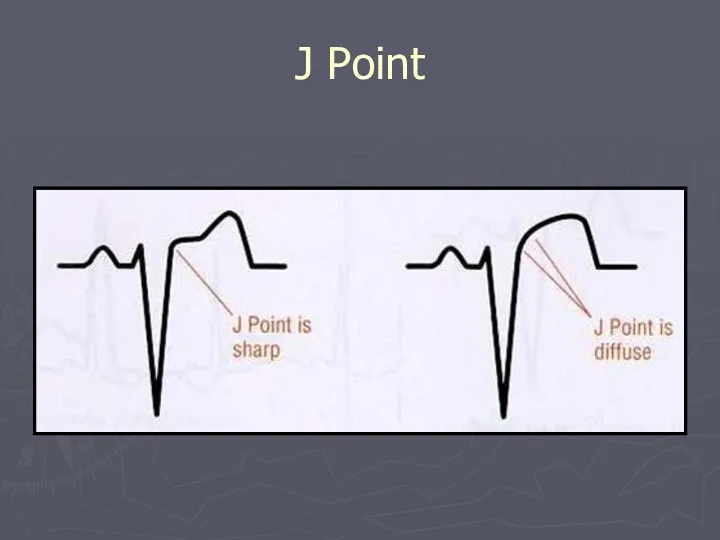
J Point
J Point
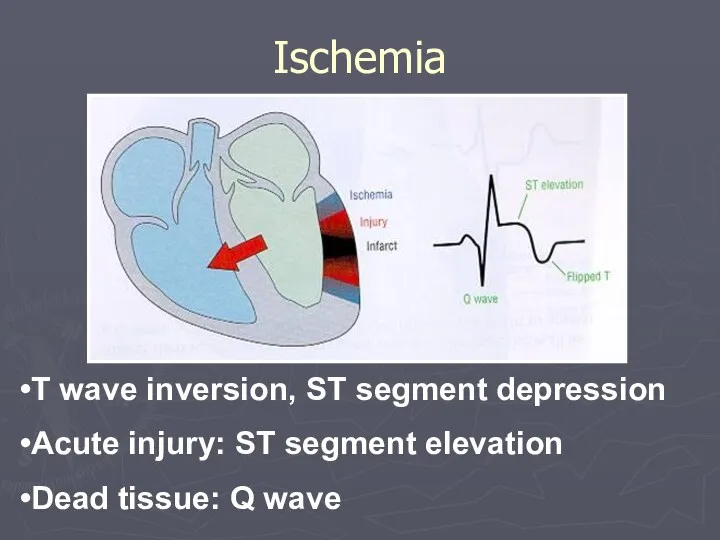
Ischemia
T wave inversion, ST segment depression
Acute injury: ST segment elevation
Dead tissue:
Ischemia
T wave inversion, ST segment depression
Acute injury: ST segment elevation
Dead tissue:
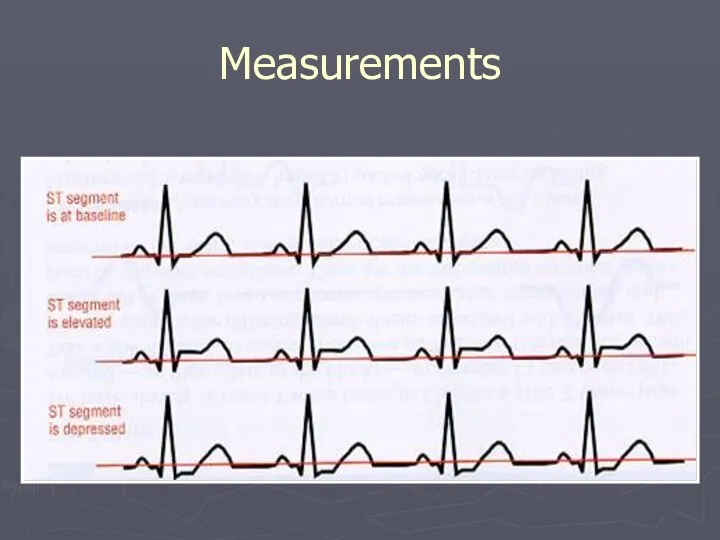
Measurements
Measurements
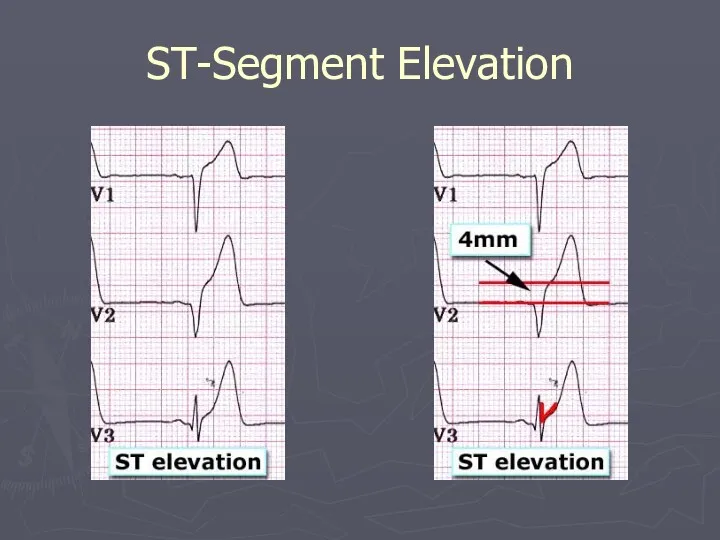
ST-Segment Elevation
ST-Segment Elevation
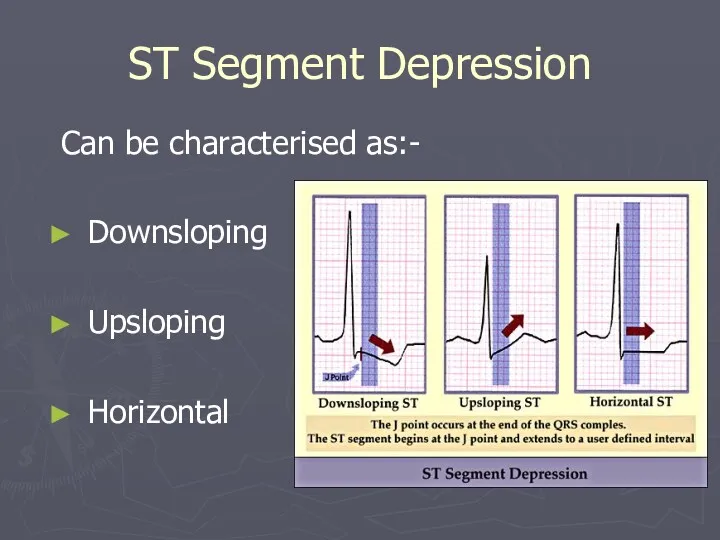
ST Segment Depression
Can be characterised as:-
Downsloping
Upsloping
Horizontal
ST Segment Depression
Can be characterised as:-
Downsloping
Upsloping
Horizontal
EKG Changes: Ischemia → Acute Injury→ Infarction
EKG Changes: Ischemia → Acute Injury→ Infarction
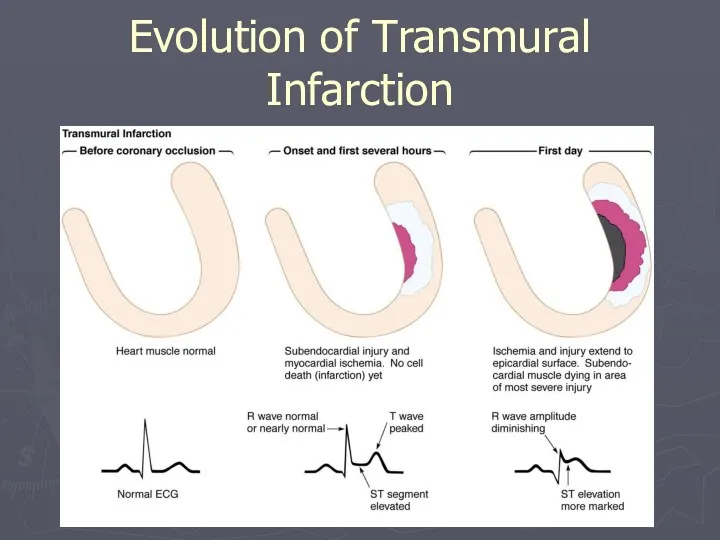
Evolution of Transmural Infarction
Evolution of Transmural Infarction
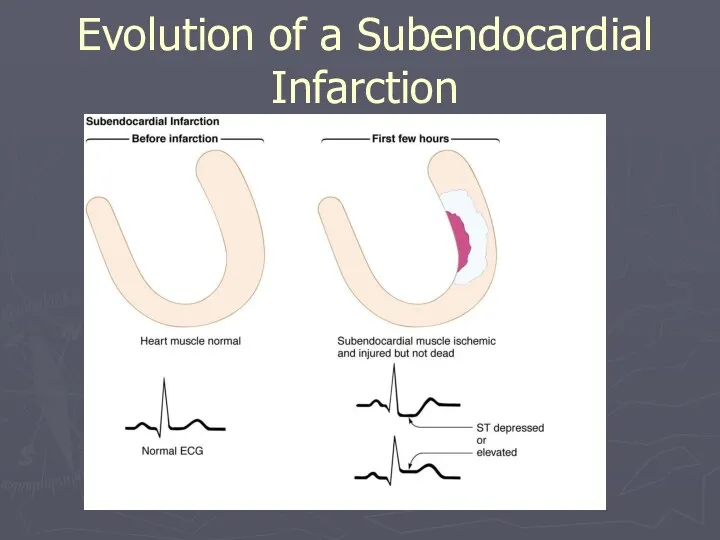
Evolution of a Subendocardial Infarction
Evolution of a Subendocardial Infarction
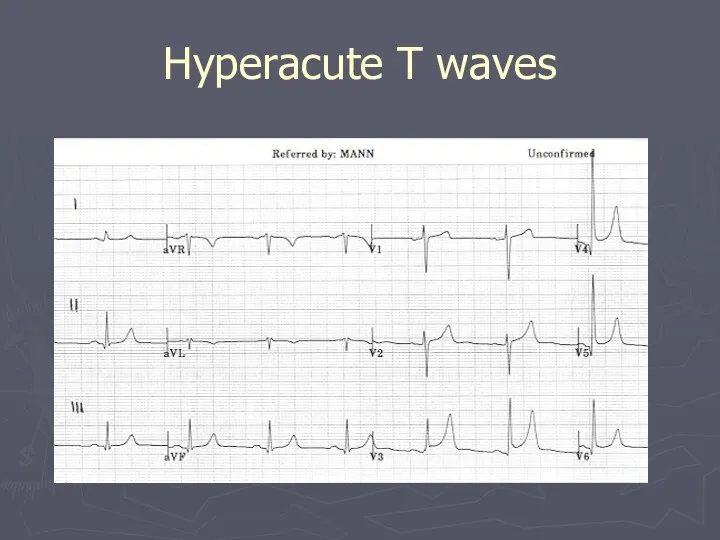
Hyperacute T waves
Hyperacute T waves
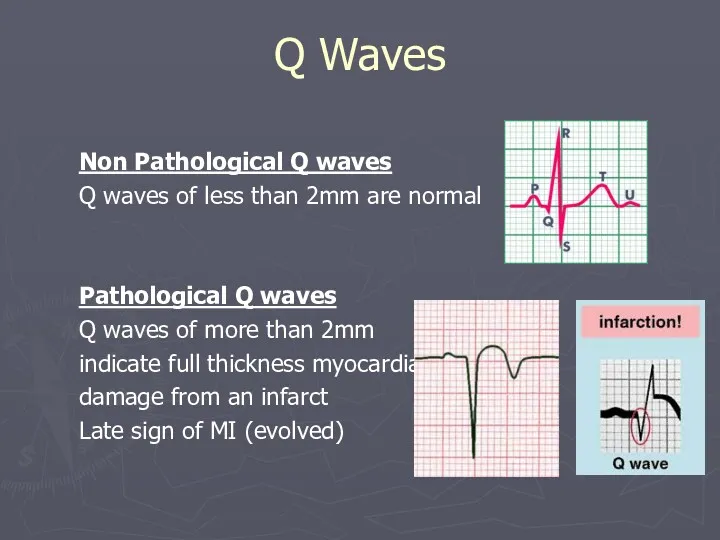
Q Waves
Non Pathological Q waves
Q waves of less than 2mm are
Q Waves
Non Pathological Q waves
Q waves of less than 2mm are
Look for Grouped Patterns (Footprints)
ST Depressions = Ischemia
ST Elevations = injury
Q
Look for Grouped Patterns (Footprints)
ST Depressions = Ischemia
ST Elevations = injury
Q
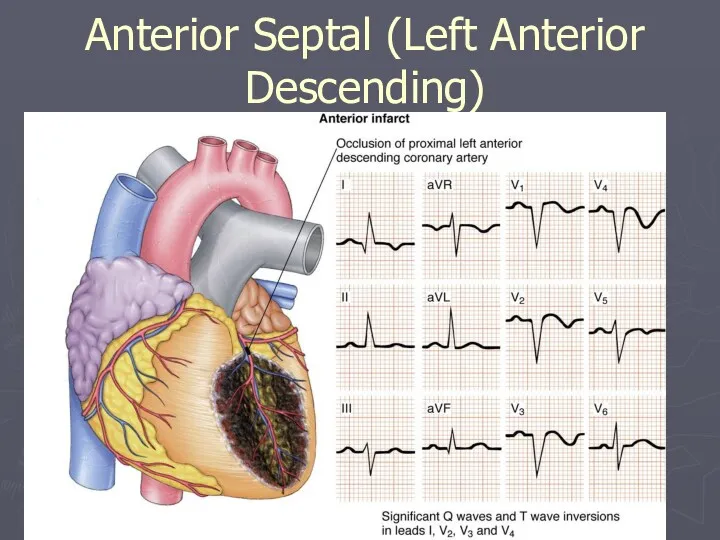
Anterior Septal (Left Anterior Descending)
Anterior Septal (Left Anterior Descending)
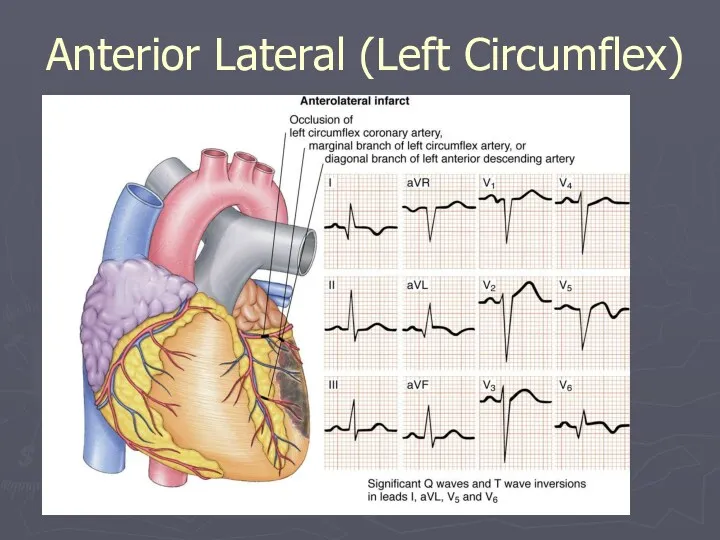
Anterior Lateral (Left Circumflex)
Anterior Lateral (Left Circumflex)
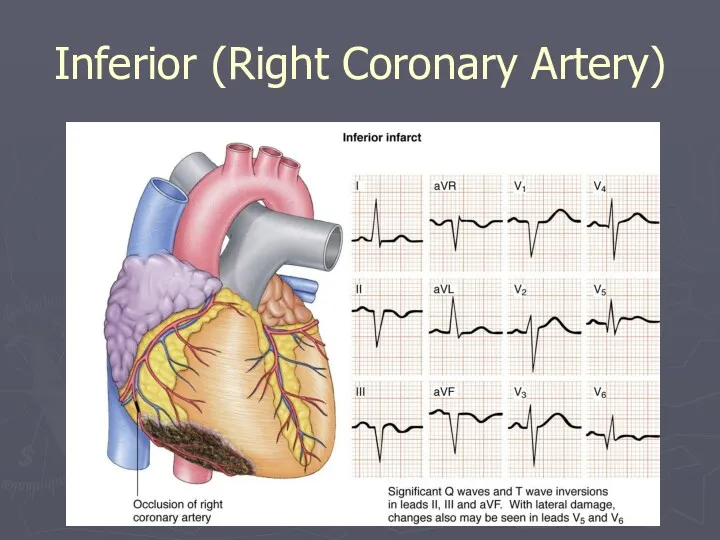
Inferior (Right Coronary Artery)
Inferior (Right Coronary Artery)
ST-T Wave Changes
ST-T Wave Changes
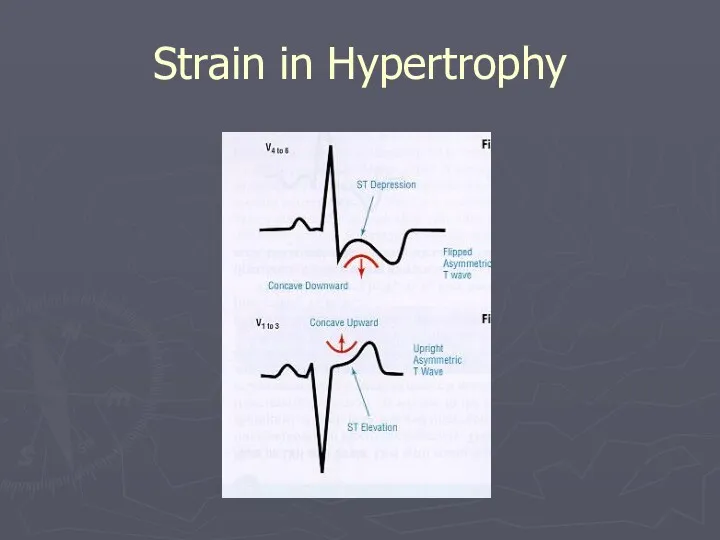
Strain in Hypertrophy
Strain in Hypertrophy
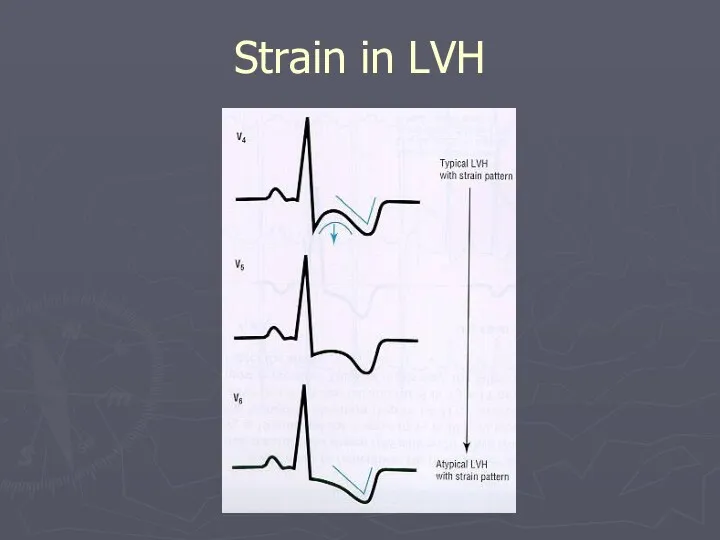
Strain in LVH
Strain in LVH
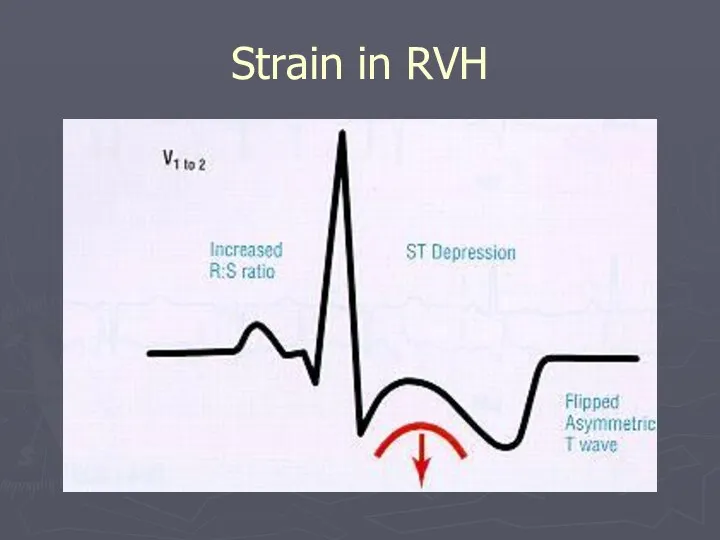
Strain in RVH
Strain in RVH
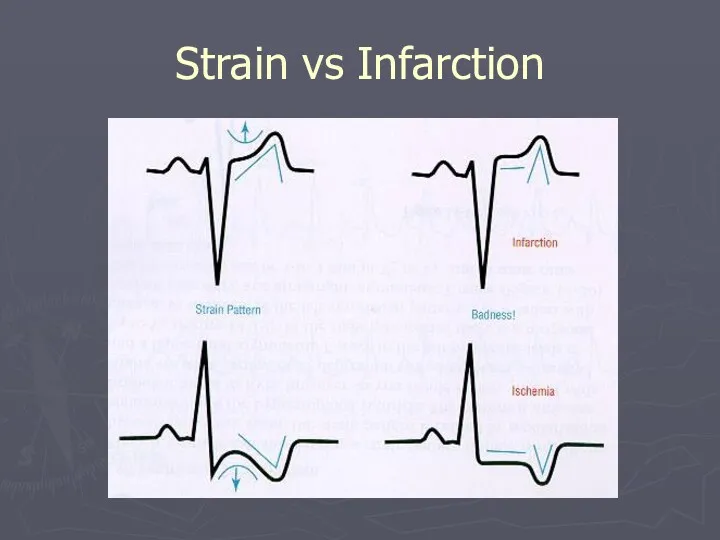
Strain vs Infarction
Strain vs Infarction
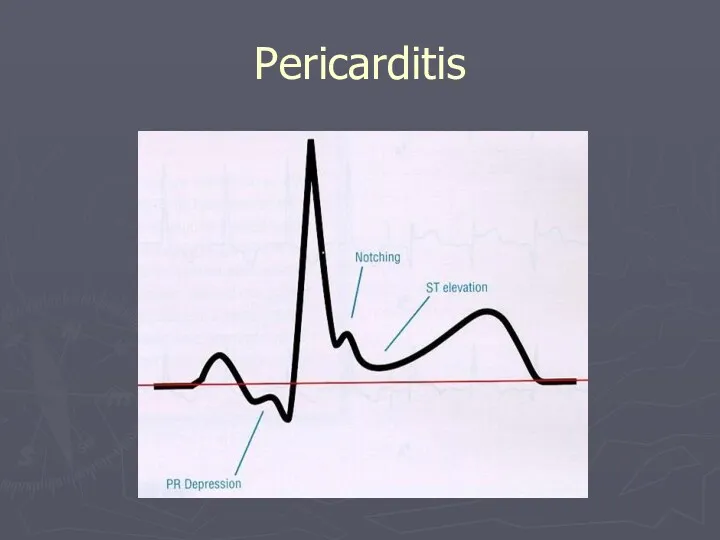
Pericarditis
Pericarditis
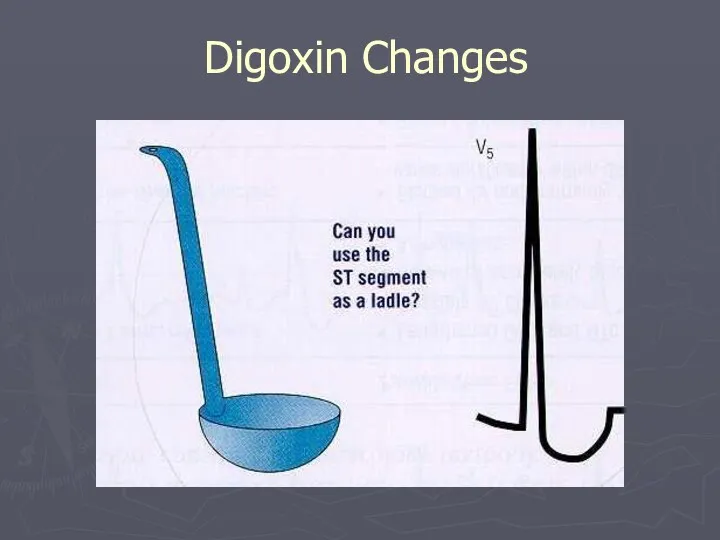
Digoxin Changes
Digoxin Changes
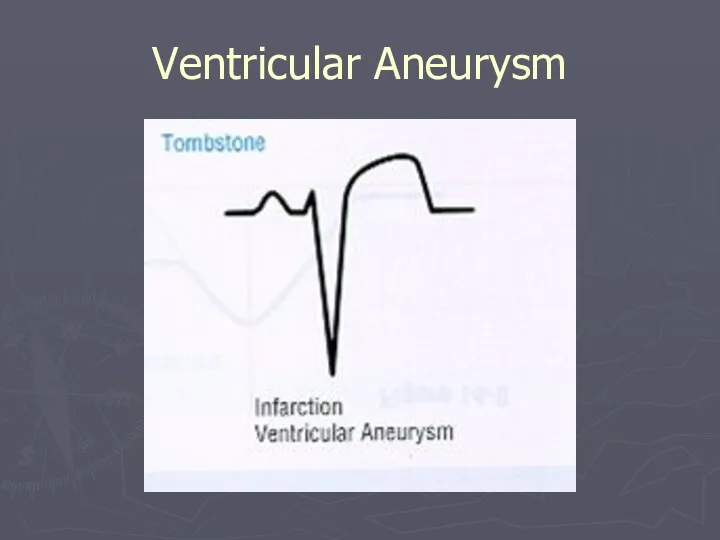
Ventricular Aneurysm
Ventricular Aneurysm
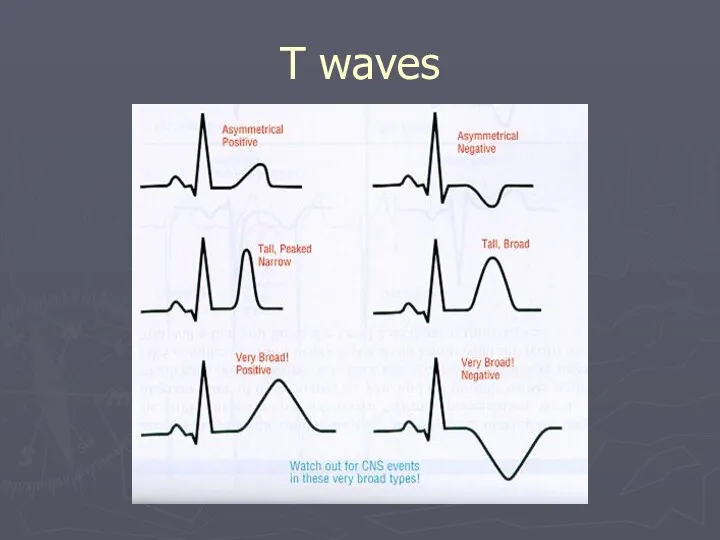
T waves
T waves
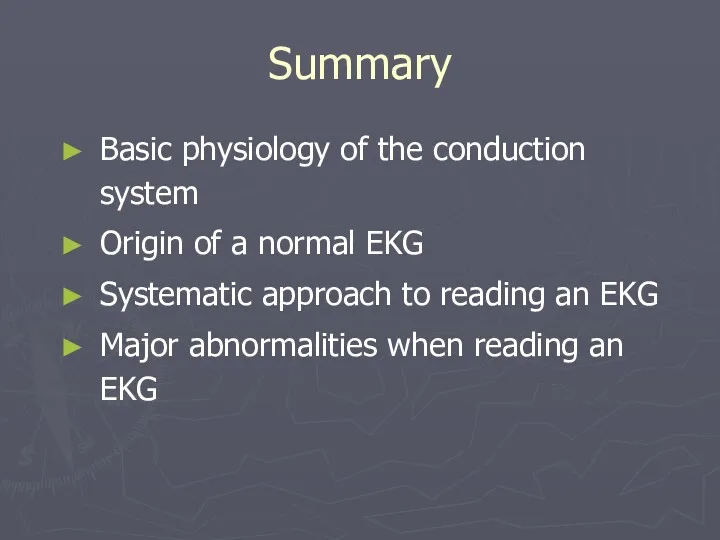
Summary
Basic physiology of the conduction system
Origin of a normal EKG
Systematic approach
Summary
Basic physiology of the conduction system
Origin of a normal EKG
Systematic approach
 Клинико-психологическое сопровождение в рамках третичной профилактики пожилых с болезнью Паркинсона
 Хвороби шкіри
 Современные технологии диагностики нарушений речи
 Особенности развития и обучения глухих детей
 Пневмоторакс - синдром скопления газа в плевральной полости
 Вступ до хірургії. Базові хірургічні навички
 Магнитно-резонансная томография. МРТ-ангиография. Трактусовая МРТ-метрия. Преимущества и недостатки МРТ
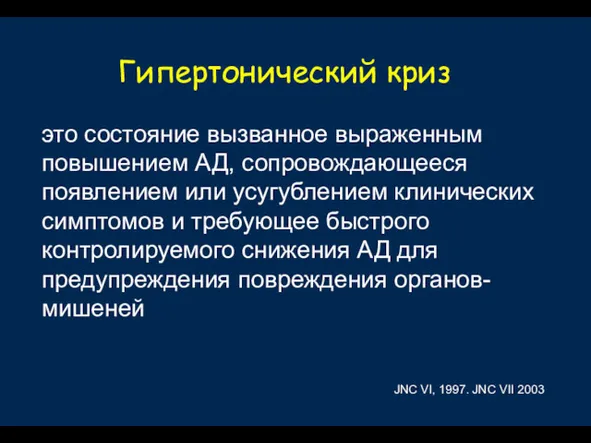 Гипертонический криз
 Тазовое предлежание плода в матке
 СПИД и его профилактика
 Терапиялық стоматология. Ауыз қуысының кәсіби гигиенасы
 Санитарно-эпидемиологическая оценка условий реализации физической активности детей на дворовых спортивно-игровых площадках
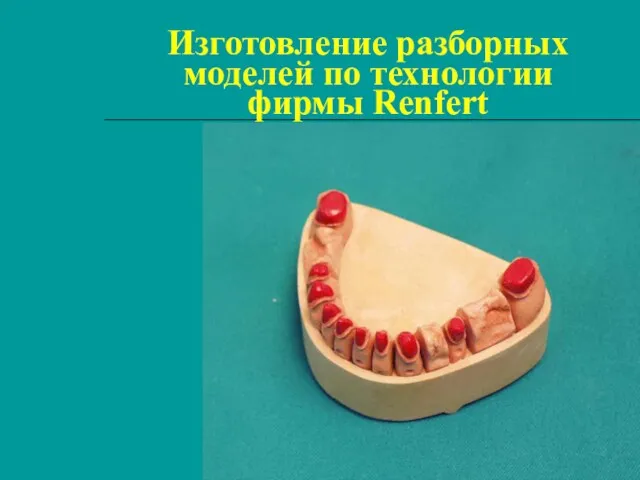 Изготовление разборных моделей по технологии фирмы Renfert
 Синдром Патау (трисомия по 13-й хромосоме)
 Рак предстательной железы
 Анемии. Классификация анемий
 Аспекты хирургического лечения рака почки
 Острые воспалительные заболевания матки и придатков как причина развития клиники острого живота в гинекологии
 Сыртқы қан кетулер. Қан кетуді тоқтатудың ережелері
 Исторический аспект изучения заикания
 Норма и патология лабораторных показателей в клинической практике
 Дифференциальная диагностика желтушного синдрома
 Тестирование на ВИЧ и диагностика ВИЧ-инфекции
 Микоплазмоз респираторный
 Тазовое дно. Дисфункция тазового дна
 Созылмалы бронх өкпе ауруы. Өкпе туберкулезінен ажырату
 Тыныс алу жүйесінің физиологиясы мен биохимиясы
 Клиникалық талдау. ЖИА, тұрақсыз стенокардия II B класс жоғарғы қауіп. II дәрежедегі артериялық гипертензия IV қауіп