- ECG - MI. Acute Coronary Syndromes Unstable Angina

Содержание
- 2. Acute Coronary Syndromes Unstable Angina (UA) Non-ST-segment Elevation MI (NSTEMI) ST-segment Elevation MI (STEMI)
- 3. Acute Coronary Syndromes Excessive demand or inadequate supply of oxygen and nutrients to the heart muscle
- 4. Coronary Artery Occlusion Patient’s clinical presentation and outcome depend on factors including: Amount of myocardium supplied
- 5. Acute Coronary Syndromes
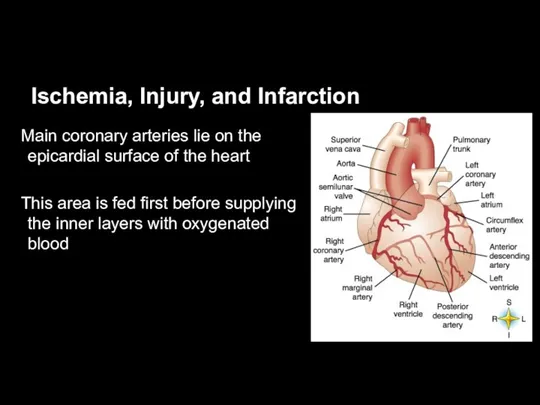
- 6. Ischemia, Injury, and Infarction Main coronary arteries lie on the epicardial surface of the heart This
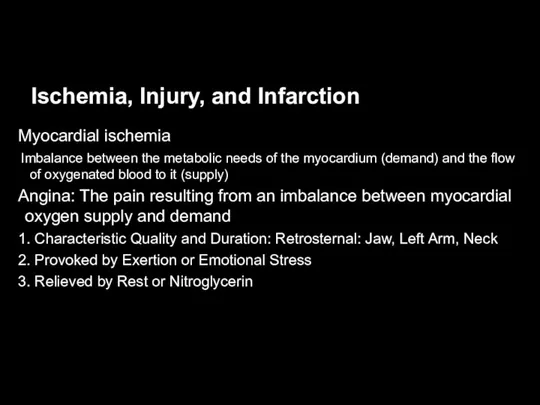
- 7. Ischemia, Injury, and Infarction Myocardial ischemia Imbalance between the metabolic needs of the myocardium (demand) and
- 8. Ischemia, Injury, and Infarction Myocardial ischemia delays repolarization ECG changes include temporary changes in the ST-segment
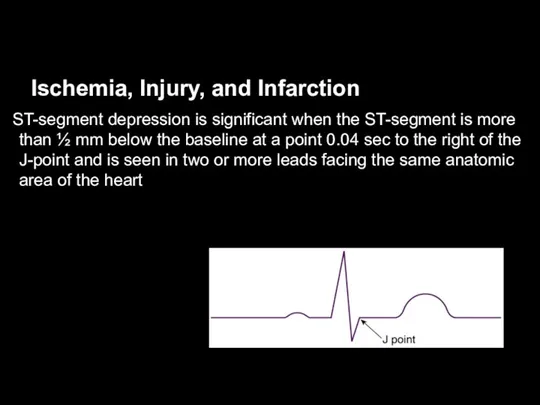
- 9. Ischemia, Injury, and Infarction ST-segment depression is significant when the ST-segment is more than ½ mm
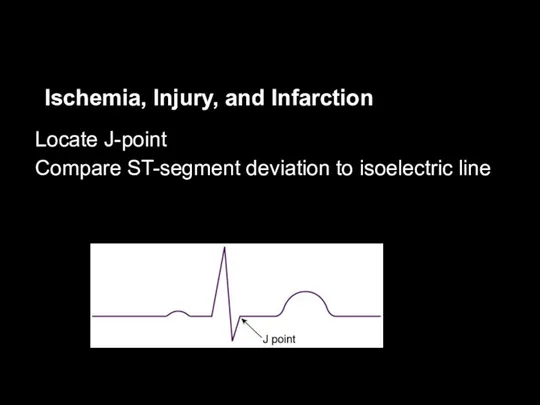
- 10. Ischemia, Injury, and Infarction Locate J-point Compare ST-segment deviation to isoelectric line
- 11. Ischemia, Injury, and Infarction Injured cells will die unless blood flow is quickly restored Myocardial injury
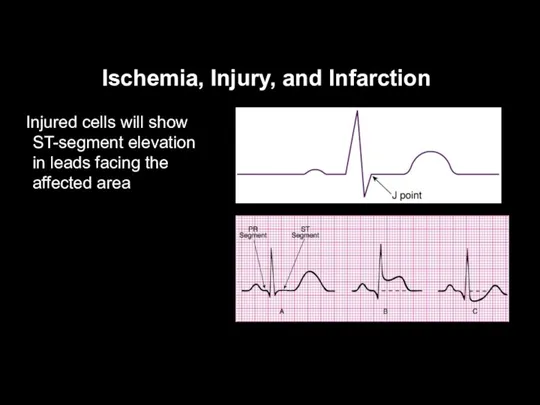
- 12. Ischemia, Injury, and Infarction Injured cells will show ST-segment elevation in leads facing the affected area
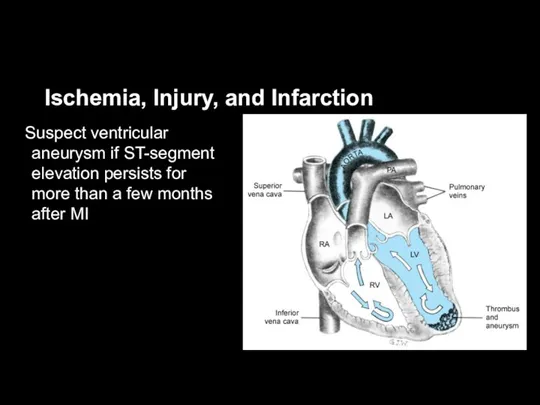
- 13. Ischemia, Injury, and Infarction Suspect ventricular aneurysm if ST-segment elevation persists for more than a few
- 14. Ischemia, Injury, and Infarction Infarction occurs when blood flow to the heart muscle stops or is
- 15. Myocardial Infarction—Diagnosis Typical rise and gradual fall (troponin) or more rapid rise and fall (CK-MB) of
- 16. Infarction—ECG Changes Non-ST-segment elevation MI (NSTEMI) ST-segment depression in leads facing the affected area MI diagnosed
- 17. Infarction—ECG Changes Most patients with ST-segment elevation MI will develop Q-wave MI Abnormal (pathologic) Q wave
- 18. Infarction—Indicative ECG Changes
- 19. Infarction—ECG Changes ST-segment elevation “Smiley” face (upward concavity) is usually benign Coved (“frowny face”) elevation is
- 20. R-Wave Progression Chest leads in a normal heart As the electrode is moved from right to
- 21. R-Wave Progression V3 and V4 normally record an equiphasic (equally positive and negative) RS complex Transitional
- 22. Poor R-Wave Progression A phrase used to describe R waves that decrease in size from V1-V4
- 23. Layout of the 12-Lead ECG
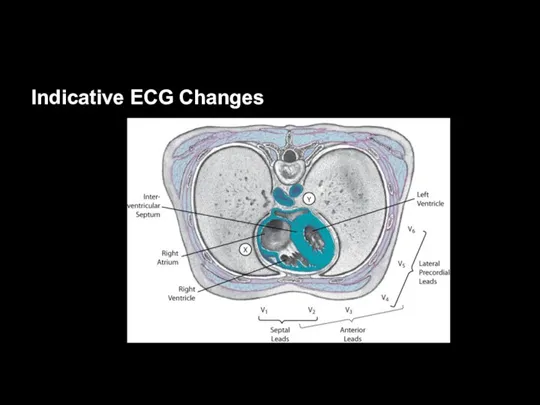
- 24. Indicative ECG Changes Indicative changes are significant when they are seen in two anatomically contiguous leads
- 25. Indicative ECG Changes
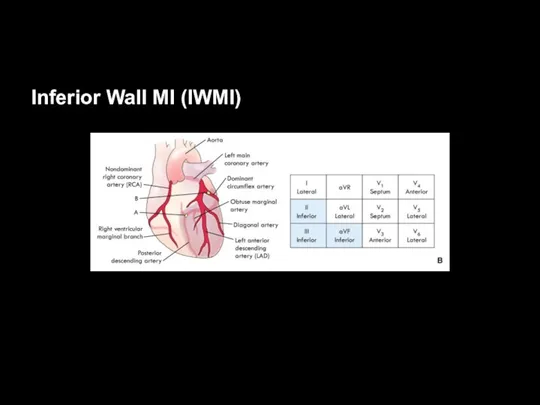
- 26. Indicative ECG Changes Which leads of a standard 12-lead ECG look at the inferior wall of
- 27. Which Leads Show ST-Segment Elevation? Are they anatomically contiguous leads?
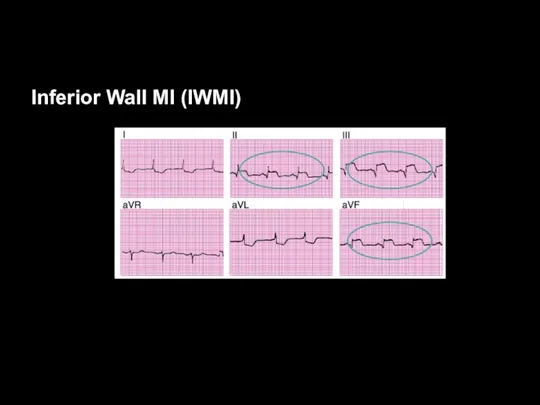
- 28. ST-Segment Elevation is Present in II, III, aVF They are anatomically contiguous; inferior MI Lateral Lateral
- 29. Reciprocal Changes
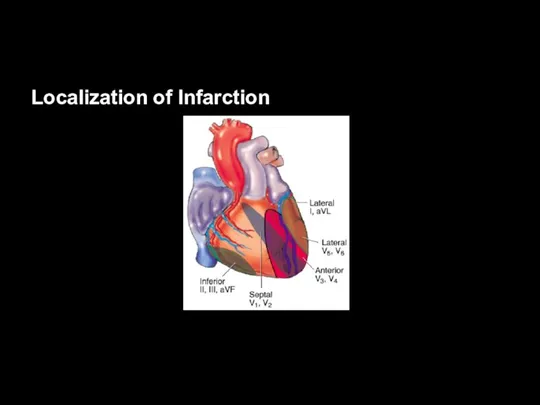
- 30. Localization of Infarction
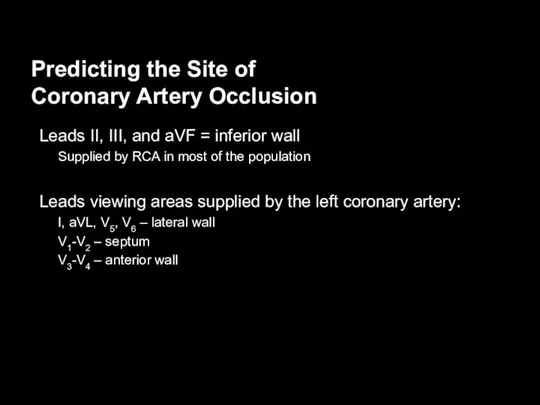
- 31. Predicting the Site of Coronary Artery Occlusion Leads II, III, and aVF = inferior wall Supplied
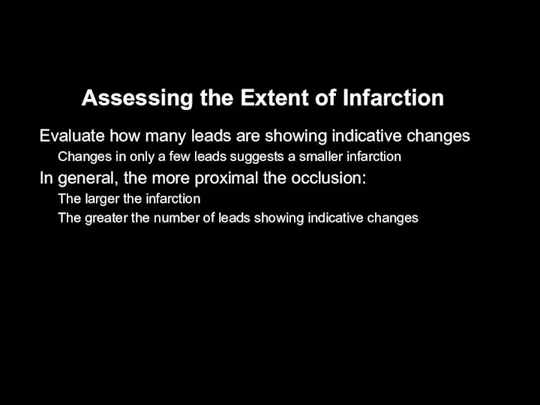
- 32. Assessing the Extent of Infarction Evaluate how many leads are showing indicative changes Changes in only
- 33. Specific Types of MIs
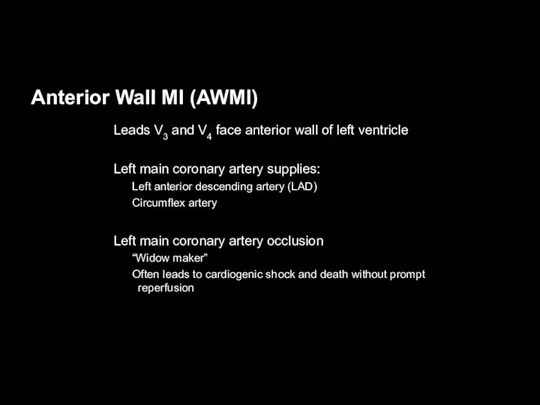
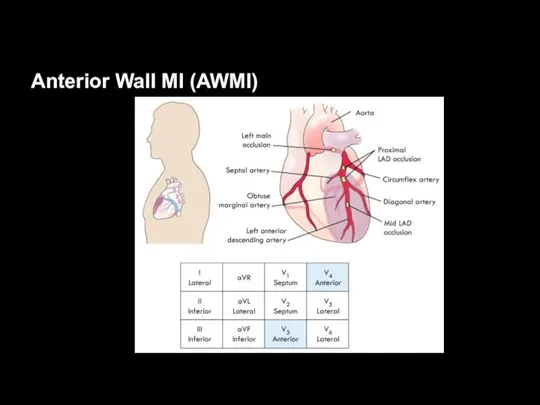
- 34. Anterior Wall MI (AWMI) Leads V3 and V4 face anterior wall of left ventricle Left main
- 35. Anterior Wall MI (AWMI)
- 36. Evolution of Anteroseptal MI Indicative changes in leads V2-4 Left: At admission, hyperacute phase is reflected
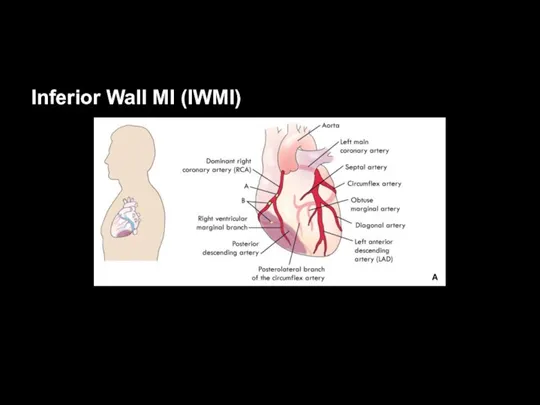
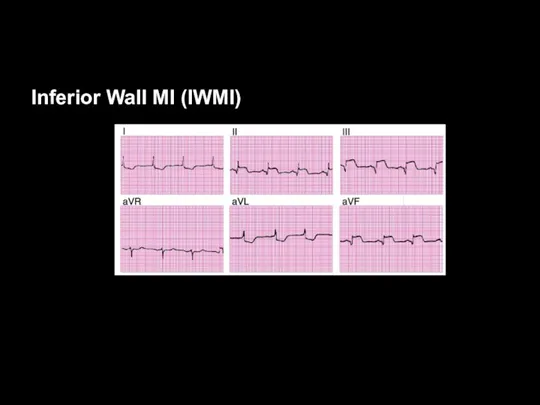
- 37. Inferior Wall MI (IWMI)
- 38. Inferior Wall MI (IWMI)
- 39. Inferior Wall MI (IWMI)
- 40. Inferior Wall MI (IWMI)
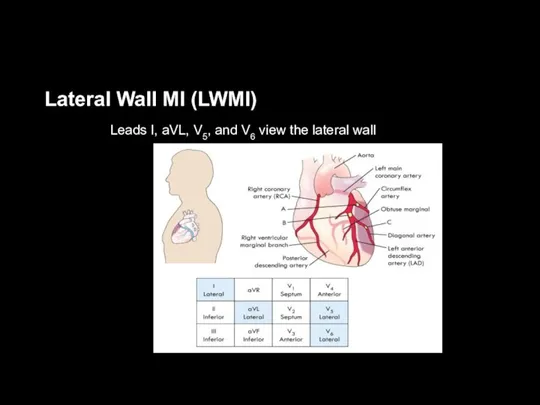
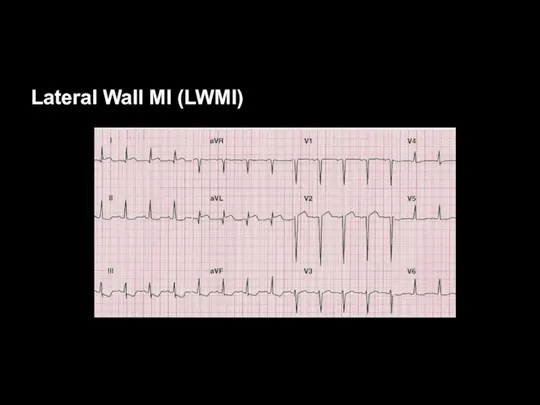
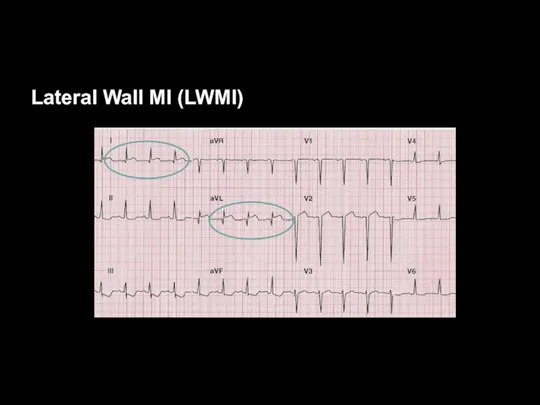
- 41. Lateral Wall MI (LWMI) Leads I, aVL, V5, and V6 view the lateral wall
- 42. Lateral Wall MI (LWMI)
- 43. Lateral Wall MI (LWMI)
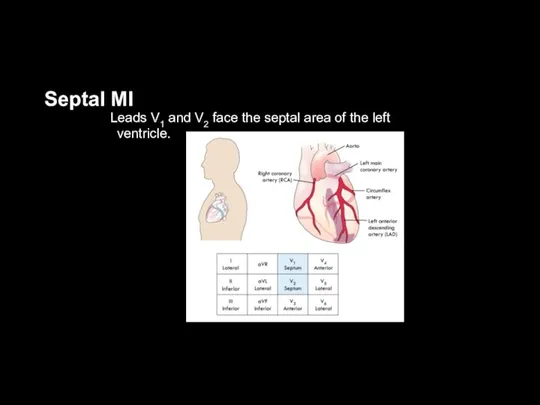
- 44. Septal MI Leads V1 and V2 face the septal area of the left ventricle.
- 45. Septal Infarction Poor R-wave Progression
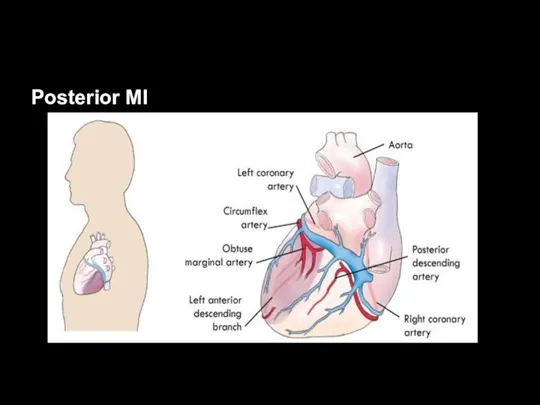
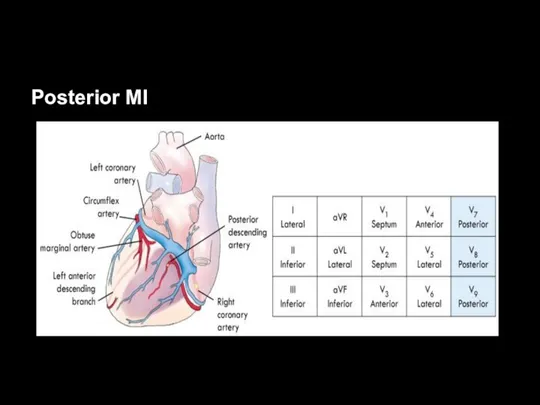
- 46. Posterior MI
- 47. Posterior MI
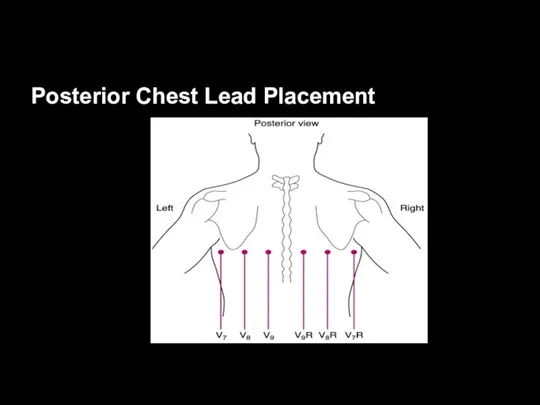
- 48. Posterior Chest Lead Placement
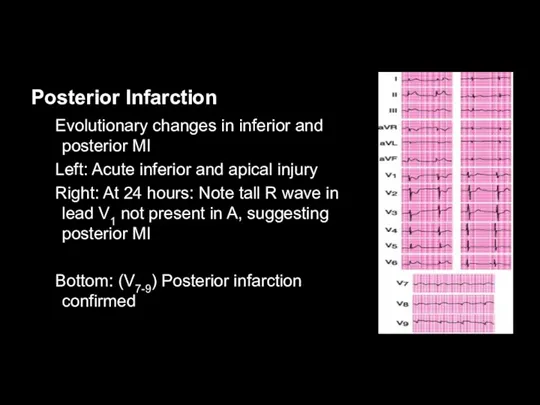
- 49. Posterior Infarction Evolutionary changes in inferior and posterior MI Left: Acute inferior and apical injury Right:
- 50. Right Ventricular Infarction
- 51. Right Chest Leads Right chest leads used to view right ventricle If time does not permit
- 52. Right Ventricular Infarction (RVI) Evolutionary changes in inferior and right ventricular infarction Left – At admission
- 54. Скачать презентацию
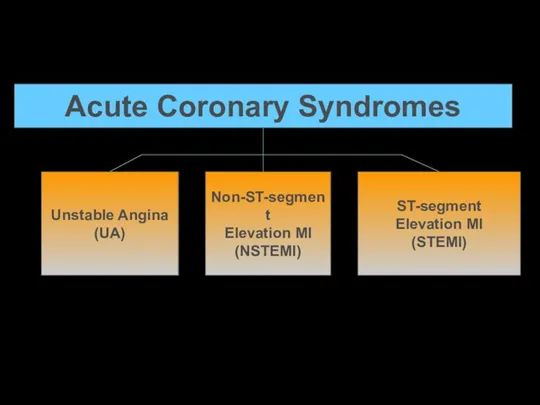
Acute Coronary Syndromes
Unstable Angina
(UA)
Non-ST-segment
Elevation MI
(NSTEMI)
ST-segment
Elevation MI
(STEMI)
Acute Coronary Syndromes
Unstable Angina
(UA)
Non-ST-segment
Elevation MI
(NSTEMI)
ST-segment
Elevation MI
(STEMI)
Acute Coronary Syndromes
Excessive demand or inadequate supply of oxygen and
Acute Coronary Syndromes
Excessive demand or inadequate supply of oxygen and
Coronary Artery Occlusion
Patient’s clinical presentation and outcome depend on factors including:
Amount
Coronary Artery Occlusion
Patient’s clinical presentation and outcome depend on factors including:
Amount
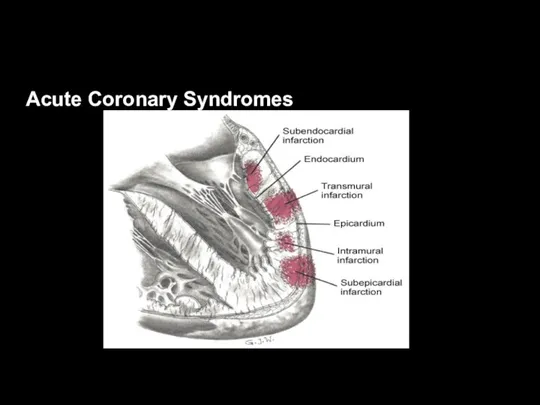
Acute Coronary Syndromes
Acute Coronary Syndromes
Ischemia, Injury, and Infarction
Main coronary arteries lie on the epicardial surface
Ischemia, Injury, and Infarction
Main coronary arteries lie on the epicardial surface
Ischemia, Injury, and Infarction
Myocardial ischemia
Imbalance between the metabolic needs of the
Ischemia, Injury, and Infarction
Myocardial ischemia
Imbalance between the metabolic needs of the
Ischemia, Injury, and Infarction
Myocardial ischemia delays repolarization
ECG changes include temporary changes
Ischemia, Injury, and Infarction
Myocardial ischemia delays repolarization
ECG changes include temporary changes
Ischemia, Injury, and Infarction
ST-segment depression is significant when the ST-segment is
Ischemia, Injury, and Infarction
ST-segment depression is significant when the ST-segment is
Ischemia, Injury, and Infarction
Locate J-point
Compare ST-segment deviation to isoelectric line
Ischemia, Injury, and Infarction
Locate J-point
Compare ST-segment deviation to isoelectric line
Ischemia, Injury, and Infarction
Injured cells will die unless blood flow is
Ischemia, Injury, and Infarction
Injured cells will die unless blood flow is
Ischemia, Injury, and Infarction
Injured cells will show ST-segment elevation in leads
Ischemia, Injury, and Infarction
Injured cells will show ST-segment elevation in leads
Ischemia, Injury, and Infarction
Suspect ventricular aneurysm if ST-segment elevation persists for
Ischemia, Injury, and Infarction
Suspect ventricular aneurysm if ST-segment elevation persists for
Ischemia, Injury, and Infarction
Infarction occurs when blood flow to the heart
Ischemia, Injury, and Infarction
Infarction occurs when blood flow to the heart
Myocardial Infarction—Diagnosis
Typical rise and gradual fall (troponin) or more rapid rise
Myocardial Infarction—Diagnosis
Typical rise and gradual fall (troponin) or more rapid rise
Infarction—ECG Changes
Non-ST-segment elevation MI (NSTEMI)
ST-segment depression in leads facing the affected
Infarction—ECG Changes
Non-ST-segment elevation MI (NSTEMI)
ST-segment depression in leads facing the affected
Infarction—ECG Changes
Most patients with ST-segment elevation MI will develop Q-wave MI
Abnormal
Infarction—ECG Changes
Most patients with ST-segment elevation MI will develop Q-wave MI
Abnormal
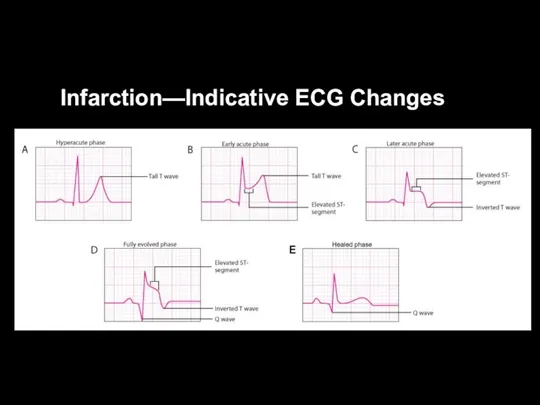
Infarction—Indicative ECG Changes
Infarction—Indicative ECG Changes
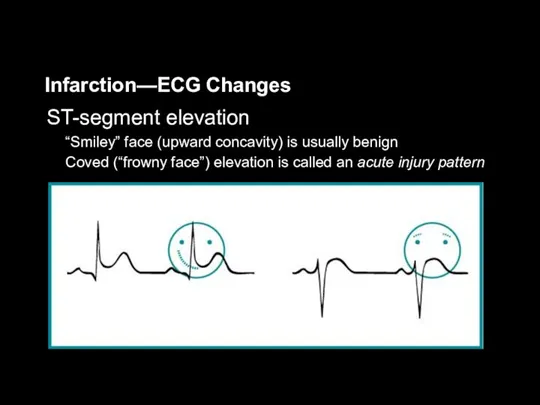
Infarction—ECG Changes
ST-segment elevation
“Smiley” face (upward concavity) is usually benign
Coved (“frowny face”)
Infarction—ECG Changes
ST-segment elevation
“Smiley” face (upward concavity) is usually benign
Coved (“frowny face”)
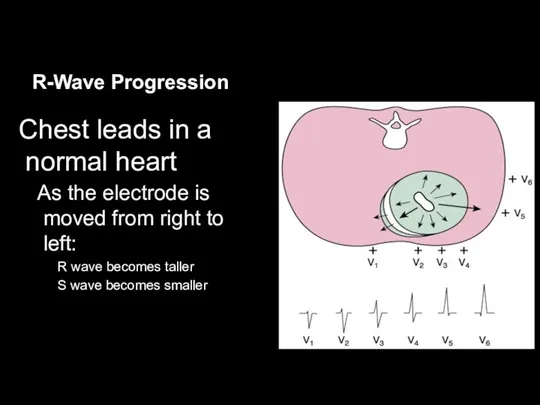
R-Wave Progression
Chest leads in a normal heart
As the electrode is moved
R-Wave Progression
Chest leads in a normal heart
As the electrode is moved
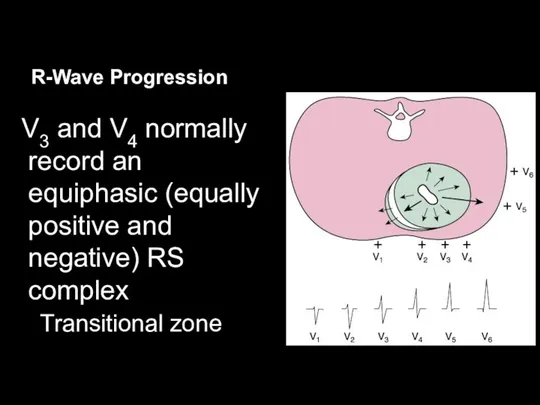
R-Wave Progression
V3 and V4 normally record an equiphasic (equally positive and
R-Wave Progression
V3 and V4 normally record an equiphasic (equally positive and
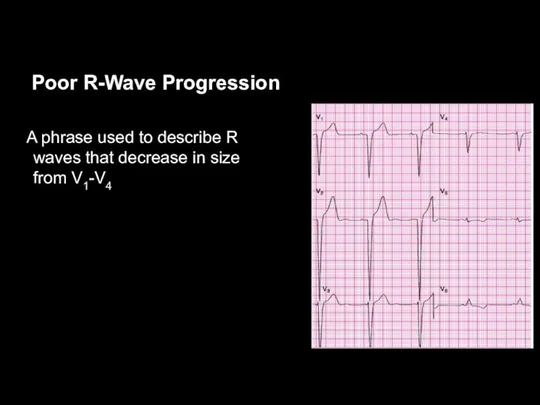
Poor R-Wave Progression
A phrase used to describe R waves that decrease
Poor R-Wave Progression
A phrase used to describe R waves that decrease
Layout of the 12-Lead ECG
Layout of the 12-Lead ECG
Indicative ECG Changes
Indicative changes are significant when they are seen in
Indicative ECG Changes
Indicative changes are significant when they are seen in
Indicative ECG Changes
Indicative ECG Changes
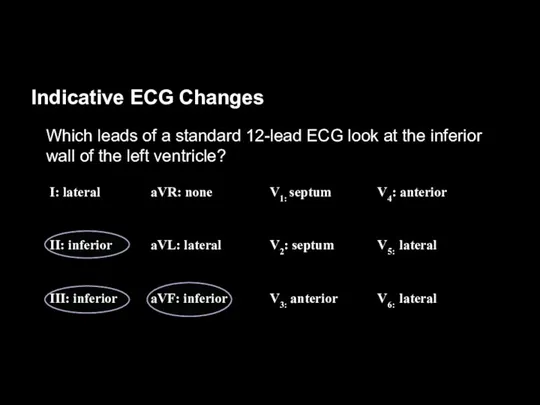
Indicative ECG Changes
Which leads of a standard 12-lead ECG look at
Indicative ECG Changes
Which leads of a standard 12-lead ECG look at
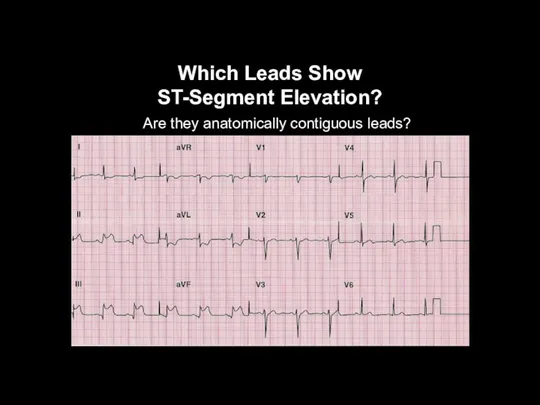
Which Leads Show
ST-Segment Elevation?
Are they anatomically contiguous leads?
Which Leads Show
ST-Segment Elevation?
Are they anatomically contiguous leads?
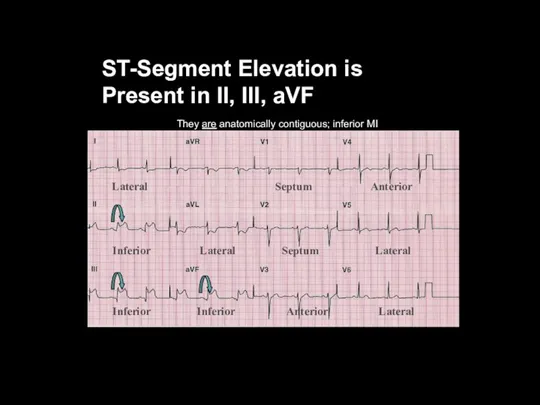
ST-Segment Elevation is
Present in II, III, aVF
They are anatomically contiguous; inferior
ST-Segment Elevation is
Present in II, III, aVF
They are anatomically contiguous; inferior
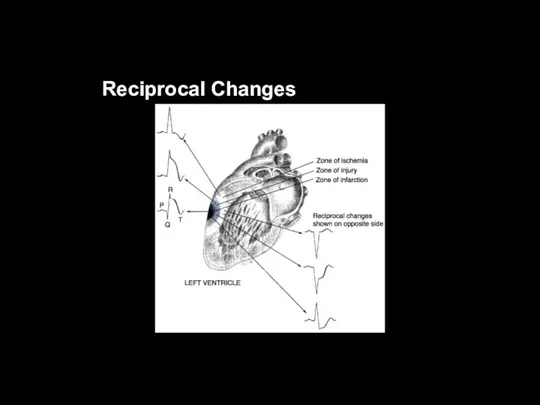
Reciprocal Changes
Reciprocal Changes
Localization of Infarction
Localization of Infarction
Predicting the Site of
Coronary Artery Occlusion
Leads II, III, and aVF
Predicting the Site of
Coronary Artery Occlusion
Leads II, III, and aVF
Assessing the Extent of Infarction
Evaluate how many leads are showing indicative
Assessing the Extent of Infarction
Evaluate how many leads are showing indicative
Specific Types of MIs
Specific Types of MIs
Anterior Wall MI (AWMI)
Leads V3 and V4 face anterior wall of
Anterior Wall MI (AWMI)
Leads V3 and V4 face anterior wall of
Anterior Wall MI (AWMI)
Anterior Wall MI (AWMI)
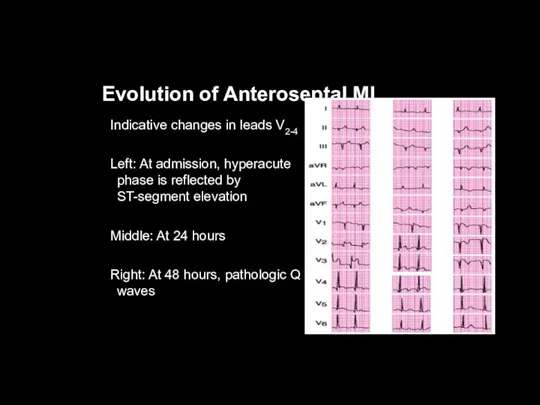
Evolution of Anteroseptal MI
Indicative changes in leads V2-4
Left: At admission, hyperacute
Evolution of Anteroseptal MI
Indicative changes in leads V2-4
Left: At admission, hyperacute
Inferior Wall MI (IWMI)
Inferior Wall MI (IWMI)
Inferior Wall MI (IWMI)
Inferior Wall MI (IWMI)
Inferior Wall MI (IWMI)
Inferior Wall MI (IWMI)
Inferior Wall MI (IWMI)
Inferior Wall MI (IWMI)
Lateral Wall MI (LWMI)
Leads I, aVL, V5, and V6 view the
Lateral Wall MI (LWMI)
Leads I, aVL, V5, and V6 view the
Lateral Wall MI (LWMI)
Lateral Wall MI (LWMI)
Lateral Wall MI (LWMI)
Lateral Wall MI (LWMI)
Septal MI
Leads V1 and V2 face the septal area of the
Septal MI
Leads V1 and V2 face the septal area of the
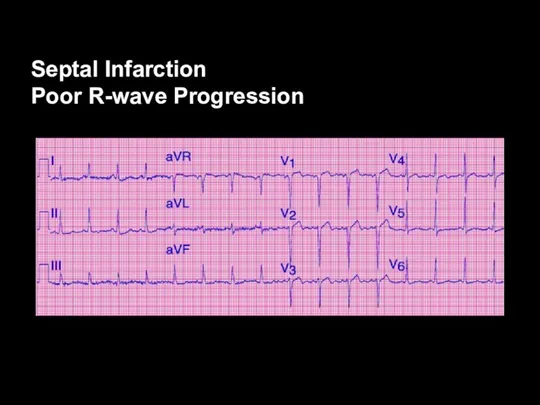
Septal Infarction
Poor R-wave Progression
Septal Infarction
Poor R-wave Progression
Posterior MI
Posterior MI
Posterior MI
Posterior MI
Posterior Chest Lead Placement
Posterior Chest Lead Placement
Posterior Infarction
Evolutionary changes in inferior and posterior MI
Left: Acute inferior and
Posterior Infarction
Evolutionary changes in inferior and posterior MI
Left: Acute inferior and
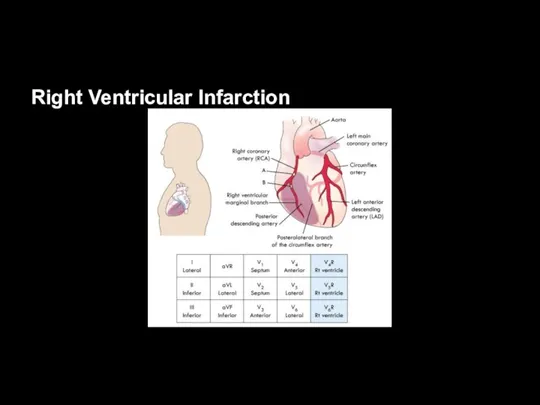
Right Ventricular Infarction
Right Ventricular Infarction
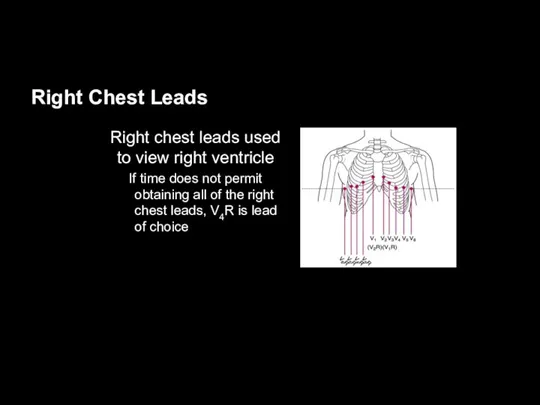
Right Chest Leads
Right chest leads used to view right ventricle
Right Chest Leads
Right chest leads used to view right ventricle
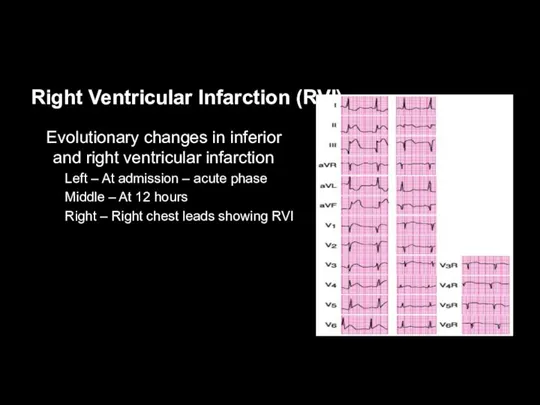
Right Ventricular Infarction (RVI)
Evolutionary changes in inferior and right ventricular infarction
Right Ventricular Infarction (RVI)
Evolutionary changes in inferior and right ventricular infarction
 Dental anatomy
 Печёночная кома. Интенсивная терапия
 Дети с ограниченными возможности здоровья, медицинская помощь
 Соединительные ткани
 Аутоиммунные болезни и механизмы их развития
 Шумы при пороках сердца
 Патогенные простейшие. Плазмодии малярии
 Физиологические механизмы и закономерности формирования двигательных навыков
 Сёстры милосердия в годы Первой мировой и Гражданской войнах
 Репродуктивті денсаулық және мінез құлық. Сырқаттылықты жеке және жалпы тіркеу. Медициналық сақтандыру
 Саркома Капоши
 Нейросифилис. Органические поражения ЦНС и ПНС, вызванные инвазией бледной трепонемы
 Антибактериальные средства (антибиотики)
 Пенициллин. Открытие лечебных свойств
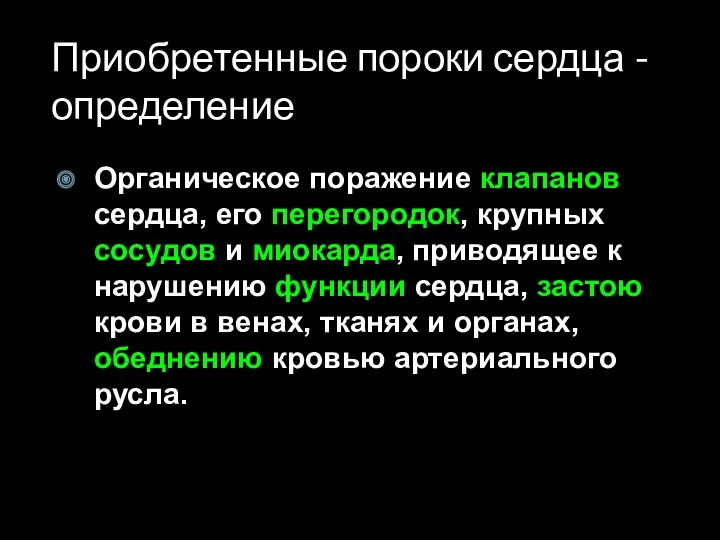 Приобретенные пороки сердца
 Neurodevelopmental disorders
 Особенности течения заболеваний людей пожилого и старческого возраста. Тактика ВОП
 Диагностика в терапии. Заболевания сердечно-сосудистой системы
 Клинико-лабораторная характеристика острых кишечных инфекций у детей раннего возраста
 Радиометриялық және дозиметриялық бақылаудың, радияциялық барлау құралдары
 Тіркеу-есеп беру құжаттары және бағалау көрсеткіштері. Аурулардың халықаралық жіктелуі
 Неалкогольная жировая болезнь печени
 Male reproductive system
 Лучевое исследование желудо-чнокишечного тракта, органов брюшной полости и мочеполовой системы. (Часть 1)
 Электромагниттік терапия
 Механизм кормления грудью
 Гломерулонефрит
 Поговорим о здоровье