- Pharmaceutical monitoring and evaluation

Содержание
- 2. Topics Concepts on pharmaceutical assessment/monitoring The WHO process on assessing and monitoring pharmaceutical situation Undertaking survey,
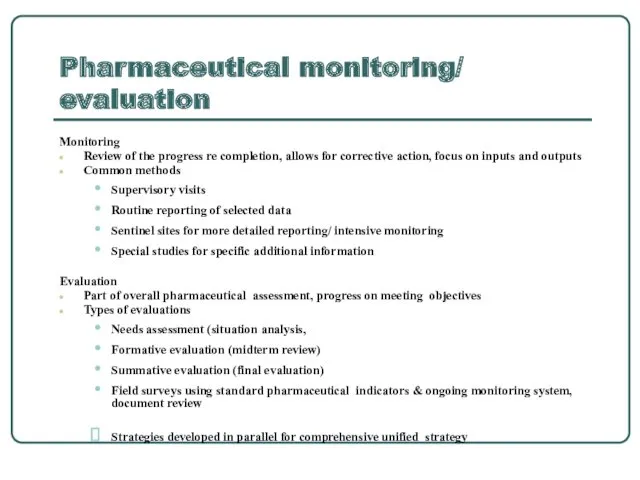
- 3. Pharmaceutical monitoring/ evaluation Monitoring Review of the progress re completion, allows for corrective action, focus on
- 4. Who can use the results from assessment and monitoring? Countries - focus action, prioritize, measure achievement
- 5. Develop implementation plans and identify strategies & interventions based on data/information on: availability, affordability, pricing, drug
- 6. National Medicines policy process
- 7. WHO hierarchical approach to monitoring and assessing pharmaceutical situations Level I Core structure & process indicators
- 8. Level I indicators: structure and process indicators Regular survey questionnaire Inexpensive process to get information across
- 9. Level II- facility outcome and impactindicators: WHO Operational Package for Monitoring and Assessing County Pharmaceutical Situations"
- 10. Generic prescribing and substitution regulations in 1999 and 2003 Generic Prescribing
- 11. Generic prescribing at public sector
- 12. Measuring access to essential medicines ( Household Survey) Level I and Level II- facility surveys do
- 13. Importance of household survey Household situations How they access their medicines, where they get them How
- 14. Indicators: (few examples) Affordability Average household medicine expenditures as % of total/non-food/health expenditures Average household medicine
- 15. Indicators: (few examples) Rational Use of Medicines Percent of antibiotics kept for future use Percent of
- 16. Current issues on household survey process Challenge to use population based data to policy evaluation, development
- 17. Level III Indicators Systematic survey and monitoring Drug price survey and monitoring WHO/INRUD RDU indicators Rapid
- 18. Sampling issues for systematic survey Follow specific procedures to minimize selection bias and is representative of
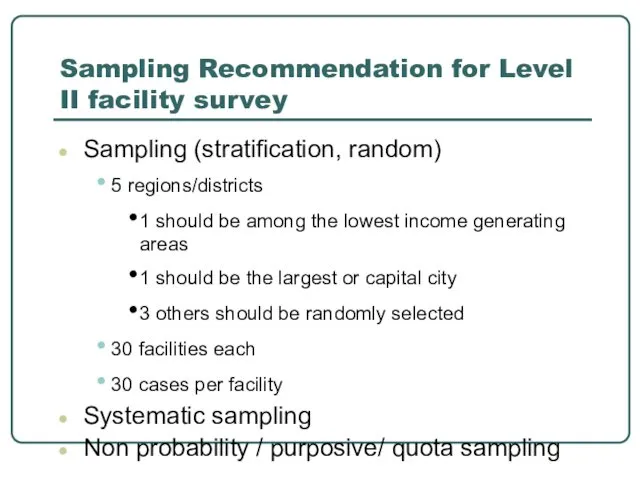
- 19. Sampling Recommendation for Level II facility survey Sampling (stratification, random) 5 regions/districts 1 should be among
- 20. The household survey sampling scheme (non probability, convenient 5 regions in the country From each region
- 21. Is the sampling frame valid? (clustering in drug supply or drug use data) Geographic Characteristics Administration
- 22. Error due to simple random sampling
- 23. Who can be trained to do the survey? Physicians, nurses, pharmacists or paramedical staff Health ministry/department
- 24. Preparing and implementing systematic survey Administrative preparation: Coordinating with WHO, ministry/department of health, public health facilities,
- 25. Pharmaceutical indicators Variables that measure situations and change Numerical ( numbers, percentage, or averages) Binomials (yes”
- 26. Why is it important to use indicators? Standard indicators facilitates: comparing the performance of facilities, districts,
- 27. Indicator allows comparison
- 28. Monitoring if there is progress or none
- 29. Setting target
- 30. Indicator measure: group norm Example: % antibiotic prescribing (logical value is Easy for region/facilities to relate
- 31. Summarizing indicator measures Percentage: yes or no over total Measures of central tendency Mean: average value,
- 32. Indicator measure: Ideal/logical values Logical value exist for some Logical value (100%-adequate labelling, meds dispensed, adherence
- 33. Connecting Survey Results and Interventions
- 34. The way forward on country monitoring Evidence through systematic but feasible data collection process is necessary
- 36. Скачать презентацию
Topics
Concepts on pharmaceutical assessment/monitoring
The WHO process on assessing and monitoring
Topics
Concepts on pharmaceutical assessment/monitoring
The WHO process on assessing and monitoring
Pharmaceutical monitoring/ evaluation
Monitoring
Review of the progress re completion, allows for corrective
Pharmaceutical monitoring/ evaluation
Monitoring
Review of the progress re completion, allows for corrective
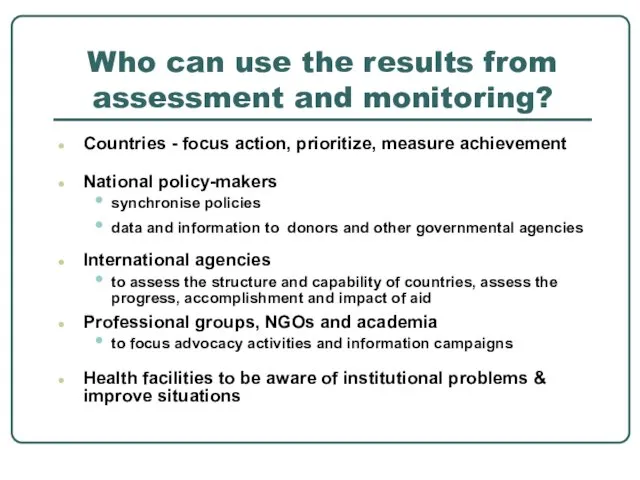
Who can use the results from assessment and monitoring?
Countries - focus
Who can use the results from assessment and monitoring?
Countries - focus
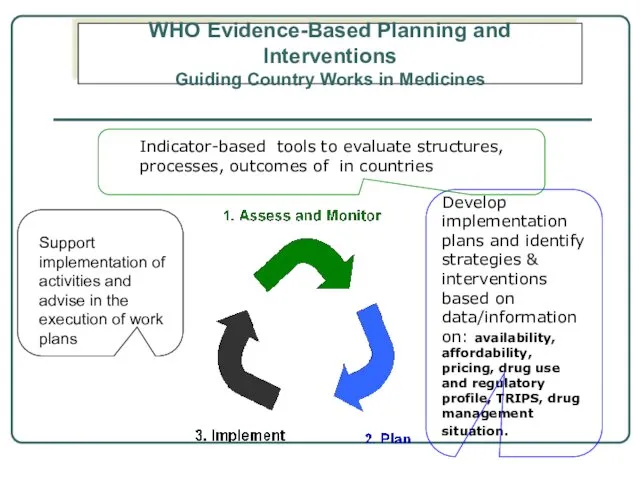
Develop implementation plans and identify strategies & interventions based on data/information
Develop implementation plans and identify strategies & interventions based on data/information
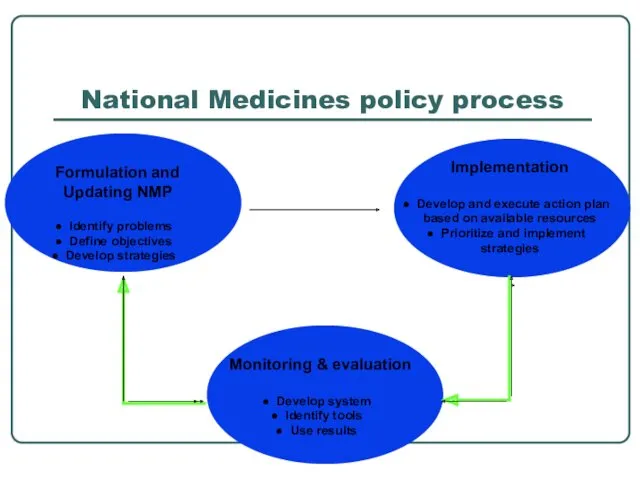
National Medicines policy process
National Medicines policy process
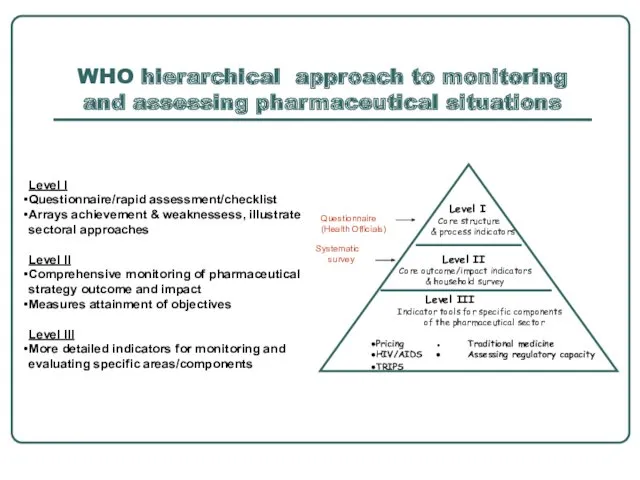
WHO hierarchical approach to monitoring and assessing pharmaceutical situations
Level I
Core
WHO hierarchical approach to monitoring and assessing pharmaceutical situations
Level I
Core
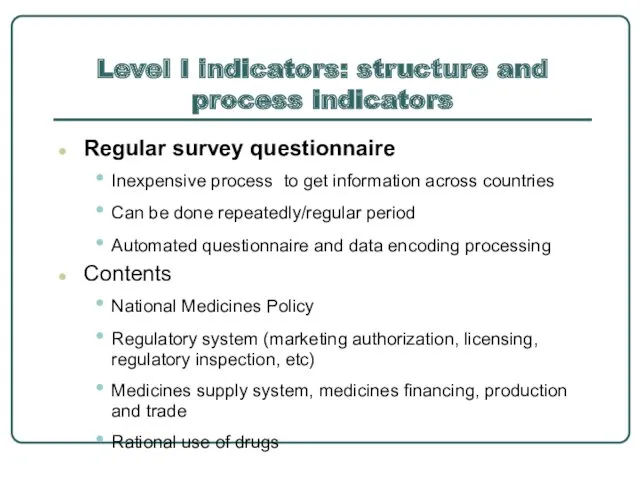
Level I indicators: structure and process indicators
Regular survey questionnaire
Inexpensive process to
Level I indicators: structure and process indicators
Regular survey questionnaire
Inexpensive process to
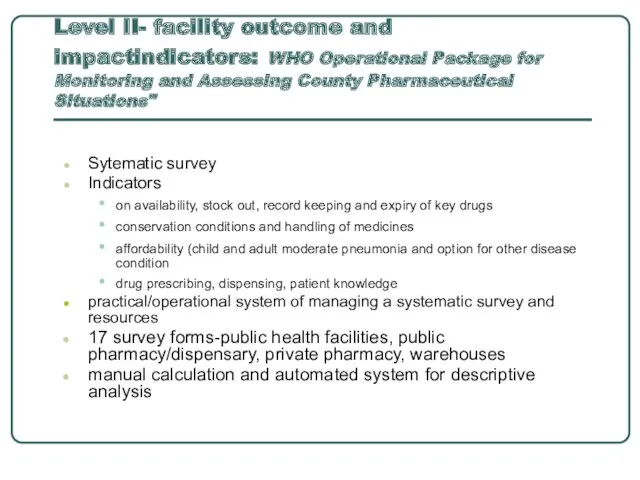
Level II- facility outcome and impactindicators: WHO Operational Package for Monitoring
Level II- facility outcome and impactindicators: WHO Operational Package for Monitoring
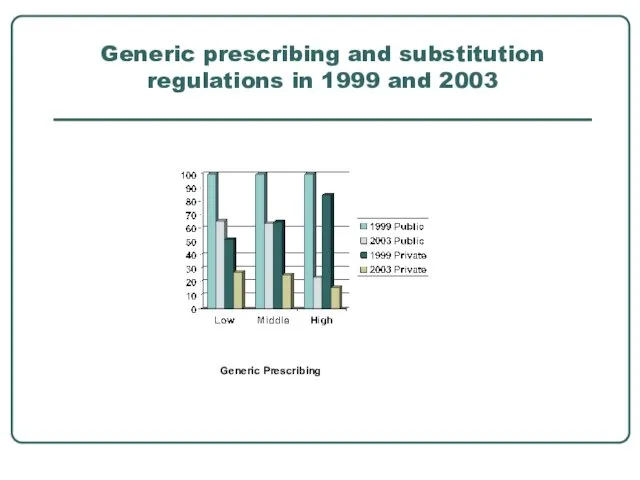
Generic prescribing and substitution regulations in 1999 and 2003
Generic Prescribing
Generic prescribing and substitution regulations in 1999 and 2003
Generic Prescribing
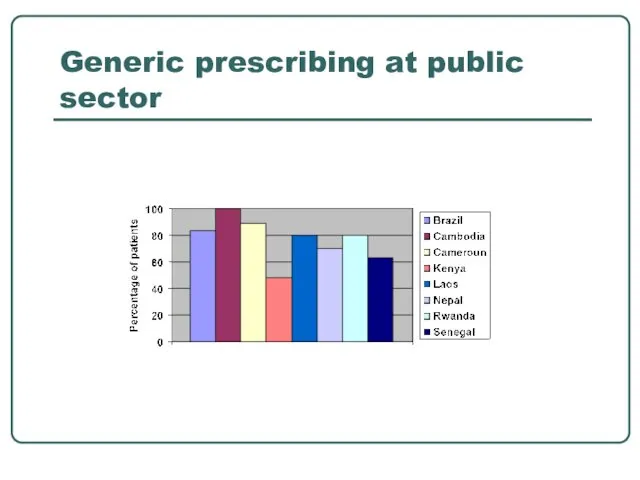
Generic prescribing at public sector
Generic prescribing at public sector
Measuring access to essential medicines ( Household Survey)
Level I and Level
Measuring access to essential medicines ( Household Survey)
Level I and Level
Importance of household survey
Household situations
How they access their medicines,
Importance of household survey
Household situations
How they access their medicines,
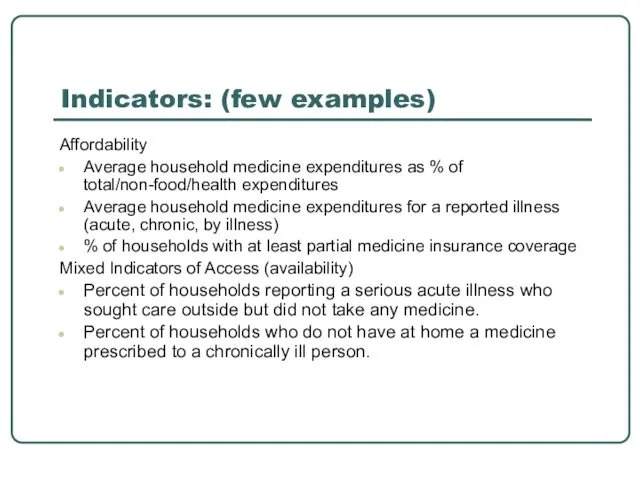
Indicators: (few examples)
Affordability
Average household medicine expenditures as % of total/non-food/health expenditures
Average
Indicators: (few examples)
Affordability
Average household medicine expenditures as % of total/non-food/health expenditures
Average
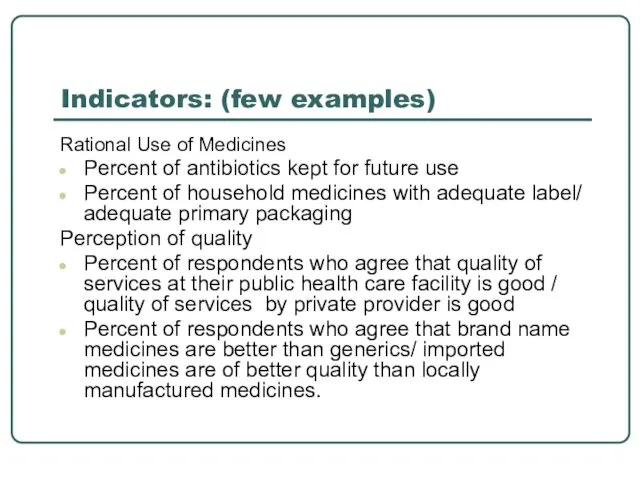
Indicators: (few examples)
Rational Use of Medicines
Percent of antibiotics kept for future
Indicators: (few examples)
Rational Use of Medicines
Percent of antibiotics kept for future
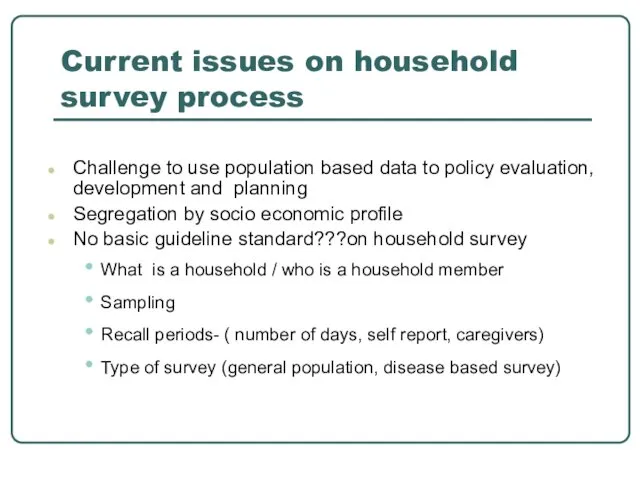
Current issues on household survey process
Challenge to use population based data
Current issues on household survey process
Challenge to use population based data
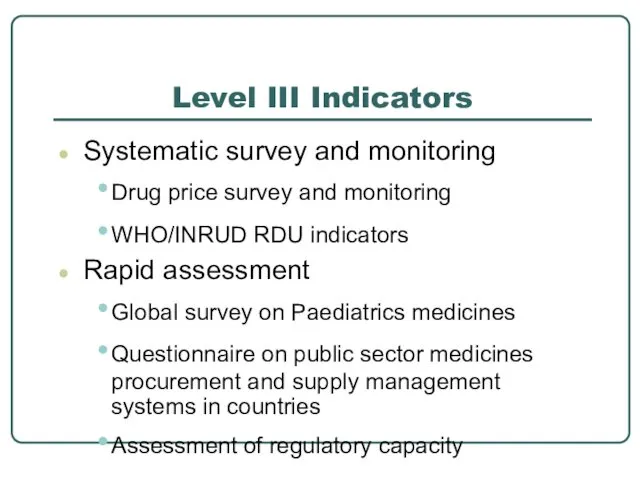
Level III Indicators
Systematic survey and monitoring
Drug price survey and monitoring
WHO/INRUD RDU
Level III Indicators
Systematic survey and monitoring
Drug price survey and monitoring
WHO/INRUD RDU
Sampling issues for systematic survey
Follow specific procedures to minimize selection bias
Sampling issues for systematic survey
Follow specific procedures to minimize selection bias
Sampling Recommendation for Level II facility survey
Sampling (stratification, random)
5 regions/districts
1
Sampling Recommendation for Level II facility survey
Sampling (stratification, random)
5 regions/districts
1
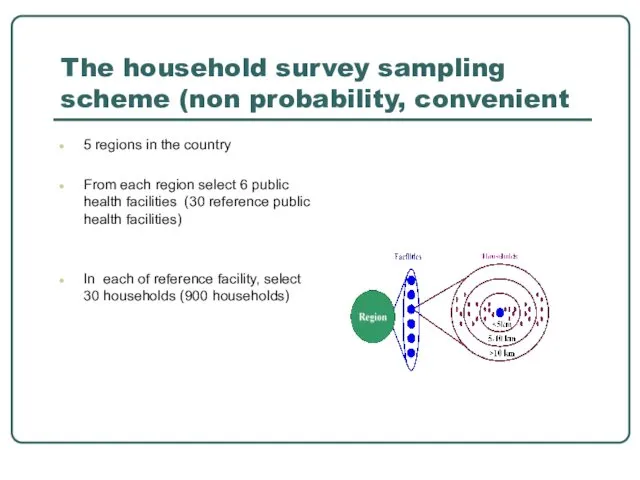
The household survey sampling scheme (non probability, convenient
5 regions in
The household survey sampling scheme (non probability, convenient
5 regions in
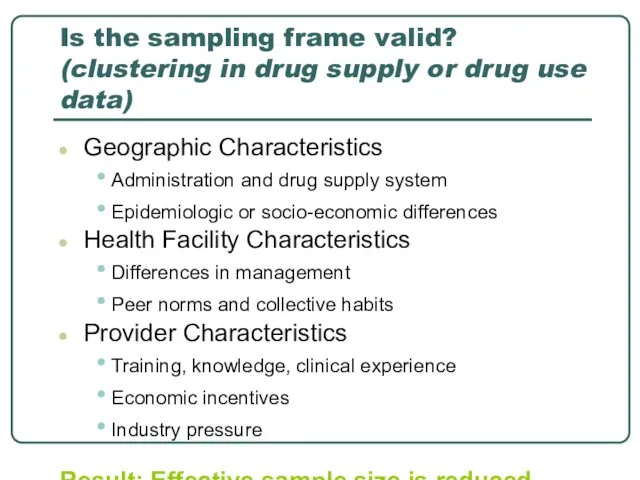
Is the sampling frame valid? (clustering in drug supply or drug
Is the sampling frame valid? (clustering in drug supply or drug
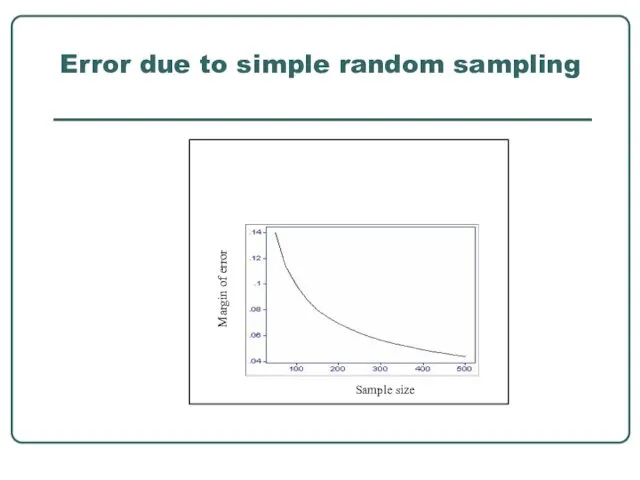
Error due to simple random sampling
Error due to simple random sampling
Who can be trained to do the survey?
Physicians, nurses, pharmacists or
Who can be trained to do the survey?
Physicians, nurses, pharmacists or
Preparing and implementing systematic survey
Administrative preparation:
Coordinating with WHO, ministry/department
Preparing and implementing systematic survey
Administrative preparation:
Coordinating with WHO, ministry/department
Pharmaceutical indicators
Variables that measure situations and change
Numerical ( numbers, percentage, or
Pharmaceutical indicators
Variables that measure situations and change
Numerical ( numbers, percentage, or
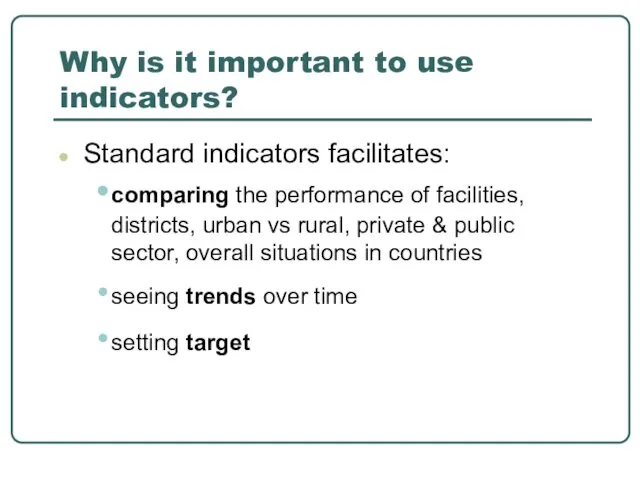
Why is it important to use indicators?
Standard indicators facilitates:
comparing the performance
Why is it important to use indicators?
Standard indicators facilitates:
comparing the performance
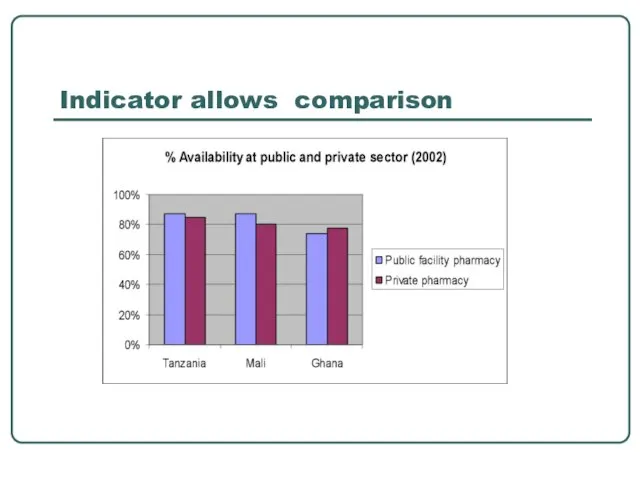
Indicator allows comparison
Indicator allows comparison
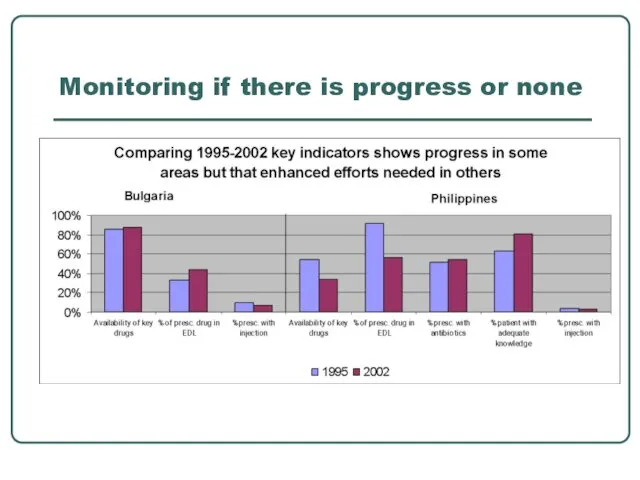
Monitoring if there is progress or none
Monitoring if there is progress or none
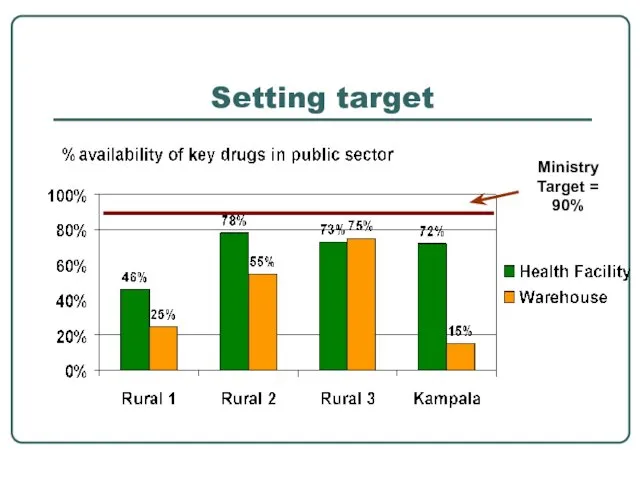
Setting target
Setting target
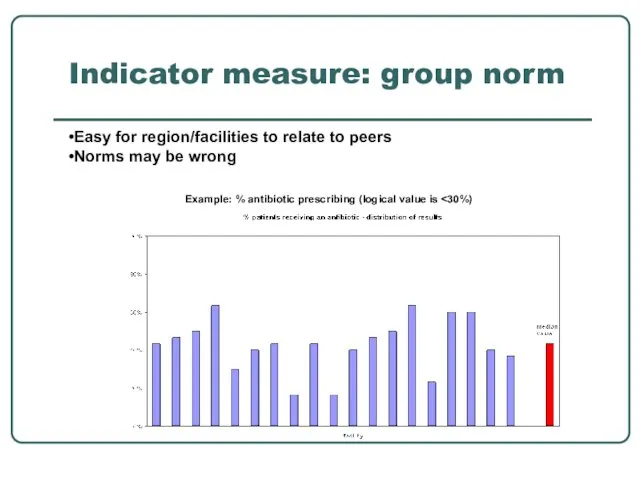
Indicator measure: group norm
Example: % antibiotic prescribing (logical value is
Indicator measure: group norm
Example: % antibiotic prescribing (logical value is
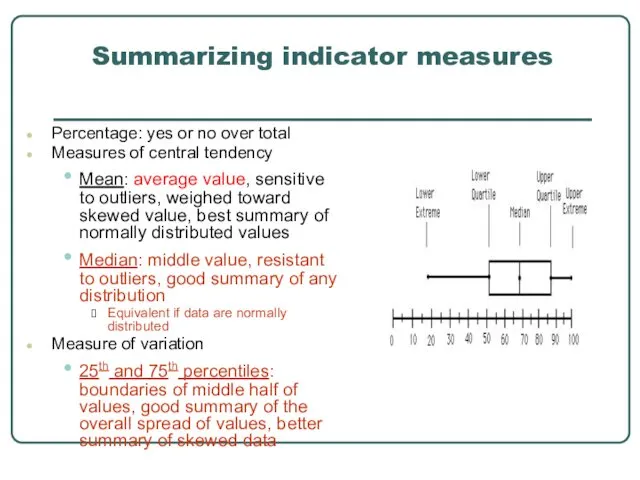
Summarizing indicator measures
Percentage: yes or no over total
Measures of central
Summarizing indicator measures
Percentage: yes or no over total
Measures of central
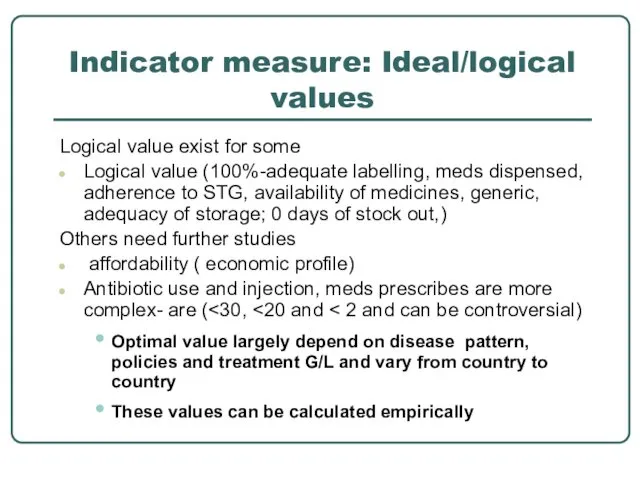
Indicator measure: Ideal/logical values
Logical value exist for some
Logical value (100%-adequate labelling,
Indicator measure: Ideal/logical values
Logical value exist for some
Logical value (100%-adequate labelling,
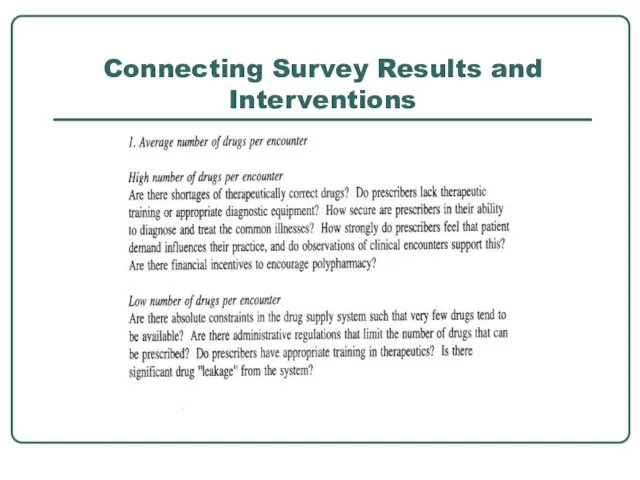
Connecting Survey Results and Interventions
Connecting Survey Results and Interventions
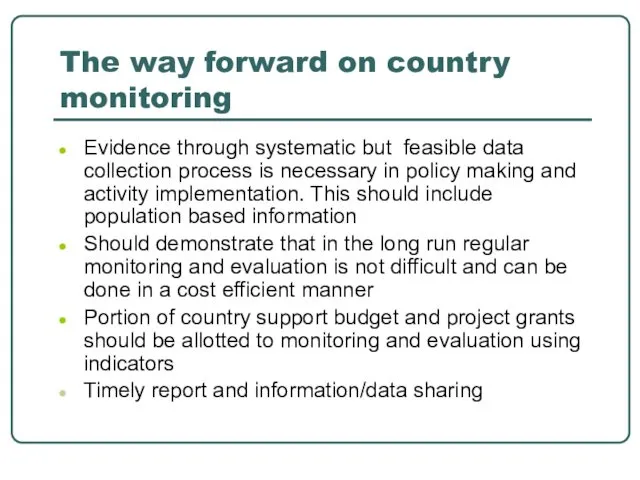
The way forward on country monitoring
Evidence through systematic but feasible data
The way forward on country monitoring
Evidence through systematic but feasible data
 Акушерлік қанағулардың қауіп қатер факторын анықтау профилактика және реабилитация
 Повреждение. Травма. Классификация. Виды травматизма. Клинические проявления и принципы лечения
 Қазақстан Республикасында сібір жарасы ауруының таралу корсеткіштері
 Introduction to Rehabilitation
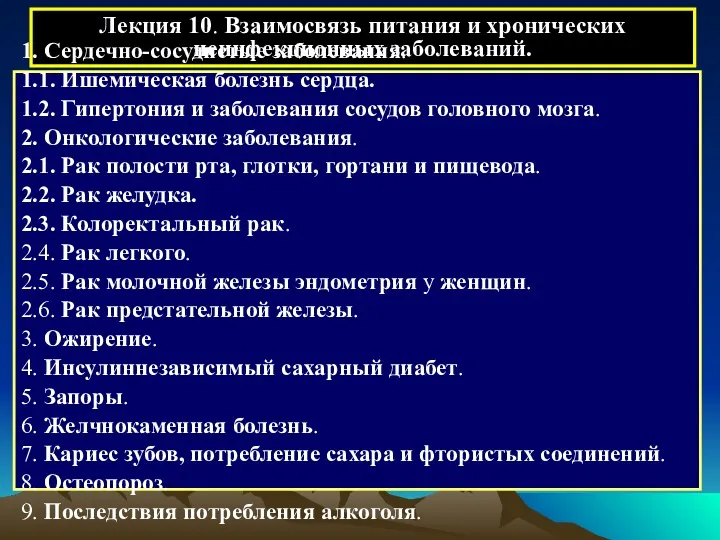 Взаимосвязь питания и хронических неинфекционных заболеваний
 Синдром Шерешевского-Тернера
 Форменные элементы крови
 Неотложная медицинская помощь и лечение при астматическом статусе
 Қабыну процесі дегеніміз
 Муковисцидоз. Этиология, патогенез. Диагностика. Емдеу әдістері
 Патология печени
 Плацентарная недостаточность
 Эпидемиологическая ситуация заболеваемости корью. Алгоритм расследования побочных эффектов при вакцинации против кори
 Ожоги и рубцовые сужения пищевода у детей
 Цитостатические препараты
 Функциональная магнитно-резонансная томография
 Гиподинамия как фактор риска развития заболеваний
 Ишемическая болезнь сердца (ИБС). Стабильные формы
 Результаты мониторинга начисления специальных социальных выплат
 Эндометрит
 Нозология ғылымы
 Пороки развития гонад – дисгенезия гонад
 Визуальная диагностика дерматитов (контактно-аллергический, атопический, токсикодермический)
 Тістем және оның түрлері
 Пародонтологиядағы иммунотерапия
 Энтеровирусная инфекция сегодня
 Доброкачественные опухоли желудка
 Прикосновение ради здоровья. Программа по сохранению и улучшению здоровья