- Evaluating a company’s. External environment. (Chapter 3)

Содержание
- 2. 3– THIS CHAPTER WILL HELP YOU UNDERSTAND: LO 1 How to recognize the factors in a
- 3. FIGURE 3.1 From Thinking Strategically about the Company’s Situation to Choosing a Strategy Chapter 3 Chapter
- 4. The macro-environment encompasses the broad environmental context in which a company’s industry is situated that includes
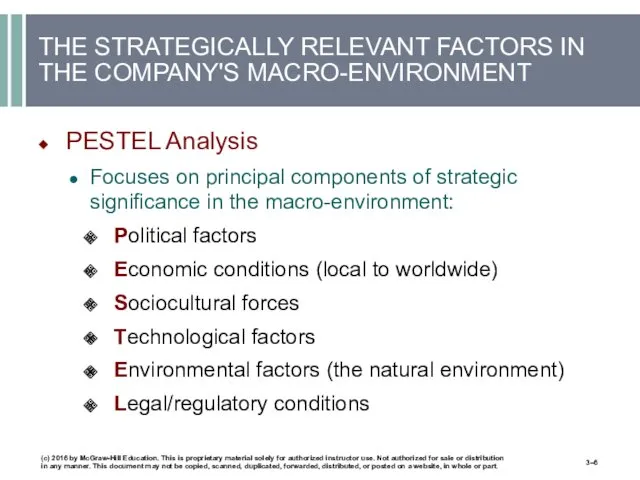
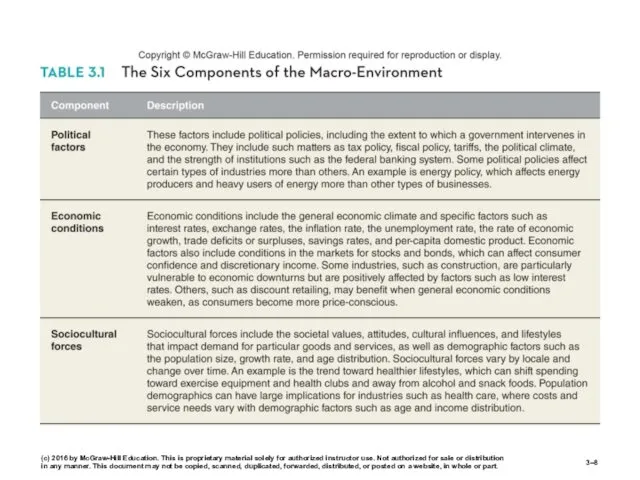
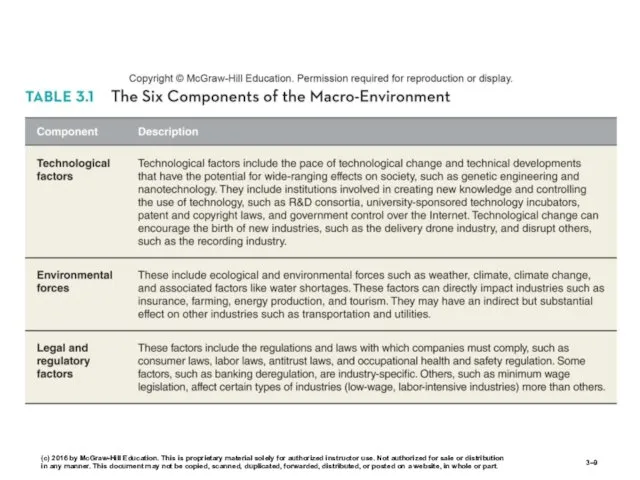
- 5. PESTEL analysis focuses on the six principal components of strategic significance in the macro-environment: Political Economic
- 6. THE STRATEGICALLY RELEVANT FACTORS IN THE COMPANY'S MACRO-ENVIRONMENT PESTEL Analysis Focuses on principal components of strategic
- 7. FIGURE 3.2 The Components of a Company’s Macro-Environment 3– (c) 2016 by McGraw-Hill Education. This is
- 8. 3– (c) 2016 by McGraw-Hill Education. This is proprietary material solely for authorized instructor use. Not
- 9. (c) 2016 by McGraw-Hill Education. This is proprietary material solely for authorized instructor use. Not authorized
- 10. ASSESSING A COMPANY’S INDUSTRY AND COMPETITIVE ENVIRONMENT How strong are the industry’s competitive forces? What are
- 11. THE FIVE FORCES FRAMEWORK The Five Competitive Forces: Competition from rival sellers Competition from potential new
- 12. FIGURE 3.3 The Five-Forces Model of Competition: A Key Analytical Tool 3– (c) 2016 by McGraw-Hill
- 13. USING THE FIVE-FORCES MODEL OF COMPETITION Step 1 For each of the five forces, identify the
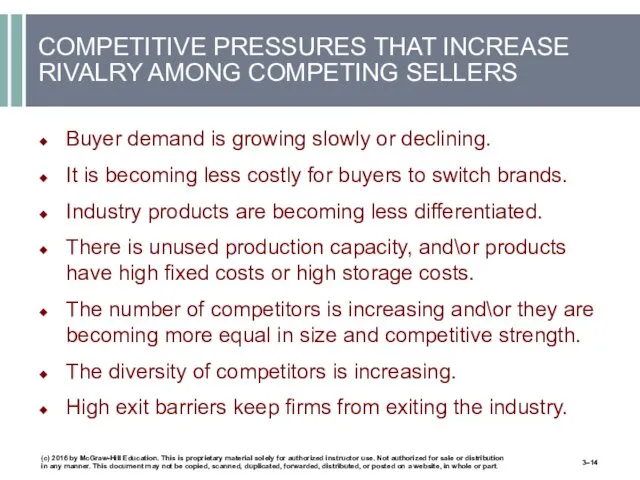
- 14. COMPETITIVE PRESSURES THAT INCREASE RIVALRY AMONG COMPETING SELLERS Buyer demand is growing slowly or declining. It
- 15. FIGURE 3.4 Factors Affecting the Strength of Rivalry 3– (c) 2016 by McGraw-Hill Education. This is
- 16. 3– (c) 2016 by McGraw-Hill Education. This is proprietary material solely for authorized instructor use. Not
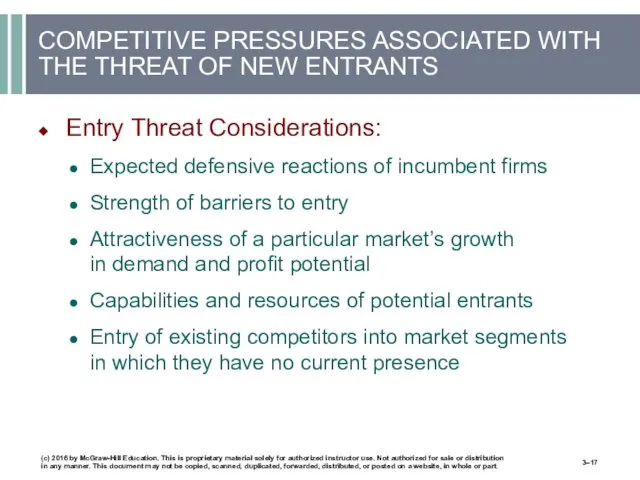
- 17. COMPETITIVE PRESSURES ASSOCIATED WITH THE THREAT OF NEW ENTRANTS Entry Threat Considerations: Expected defensive reactions of
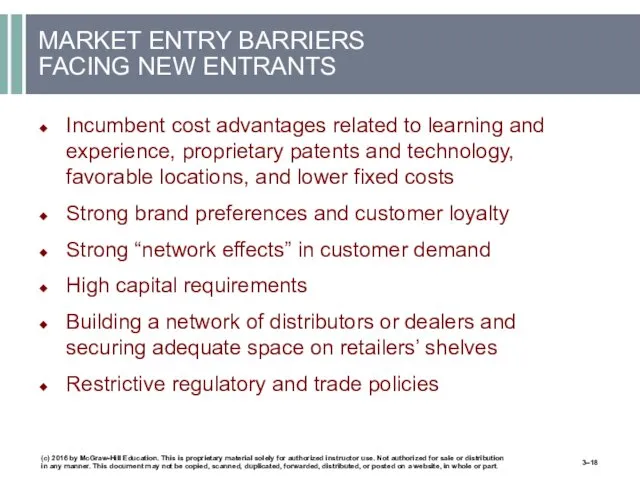
- 18. MARKET ENTRY BARRIERS FACING NEW ENTRANTS Incumbent cost advantages related to learning and experience, proprietary patents
- 19. Whether an industry’s entry barriers ought to be considered high or low depends on the resources
- 20. FIGURE 3.5 Factors Affecting the Threat of Entry 3– (c) 2016 by McGraw-Hill Education. This is
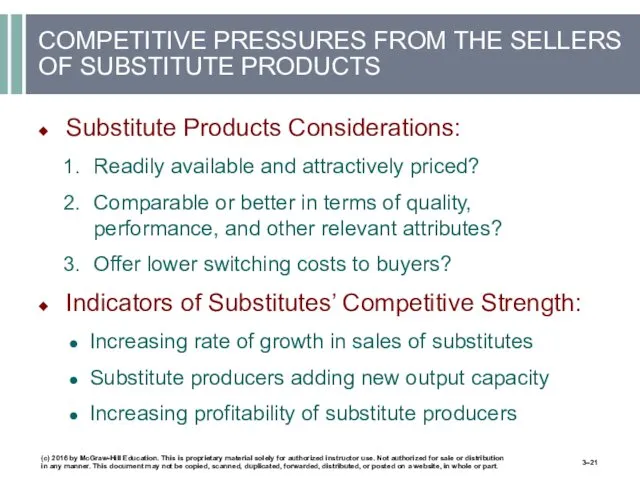
- 21. COMPETITIVE PRESSURES FROM THE SELLERS OF SUBSTITUTE PRODUCTS Substitute Products Considerations: Readily available and attractively priced?
- 22. FIGURE 3.6 Factors Affecting Competition from Substitute Products (c) 2016 by McGraw-Hill Education. This is proprietary
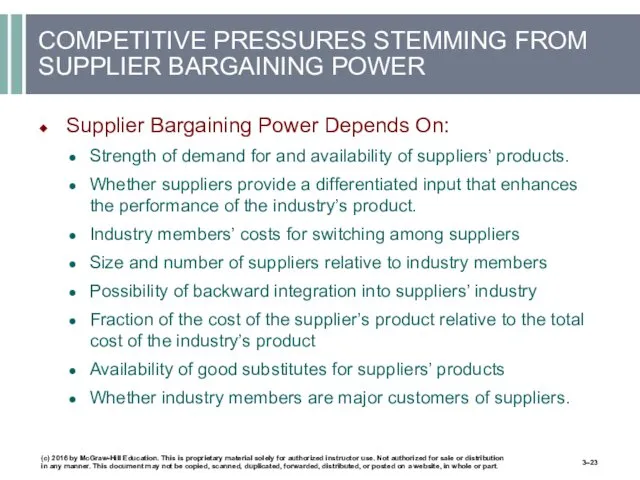
- 23. COMPETITIVE PRESSURES STEMMING FROM SUPPLIER BARGAINING POWER Supplier Bargaining Power Depends On: Strength of demand for
- 24. FIGURE 3.7 Factors Affecting the Bargaining Power of Suppliers 3– (c) 2016 by McGraw-Hill Education. This
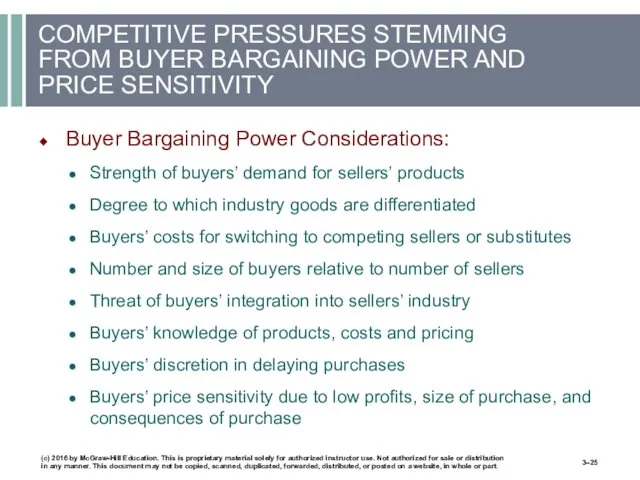
- 25. COMPETITIVE PRESSURES STEMMING FROM BUYER BARGAINING POWER AND PRICE SENSITIVITY Buyer Bargaining Power Considerations: Strength of
- 26. FIGURE 3.8 Factors Affecting the Bargaining Power of Buyers 3– (c) 2016 by McGraw-Hill Education. This
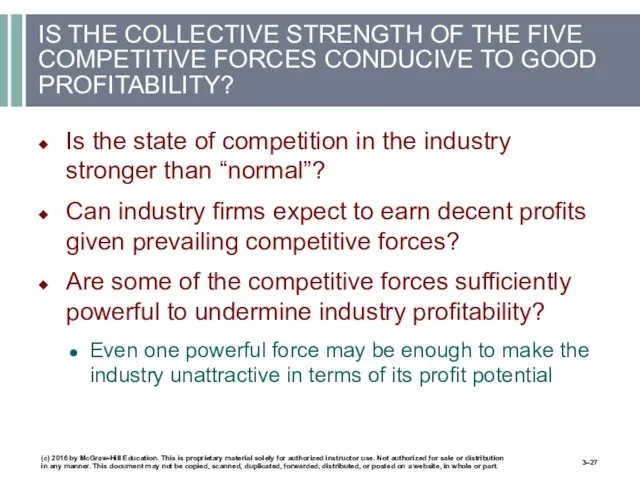
- 27. IS THE COLLECTIVE STRENGTH OF THE FIVE COMPETITIVE FORCES CONDUCIVE TO GOOD PROFITABILITY? Is the state
- 28. The strongest of the five forces determines the extent of the downward pressure on an industry’s
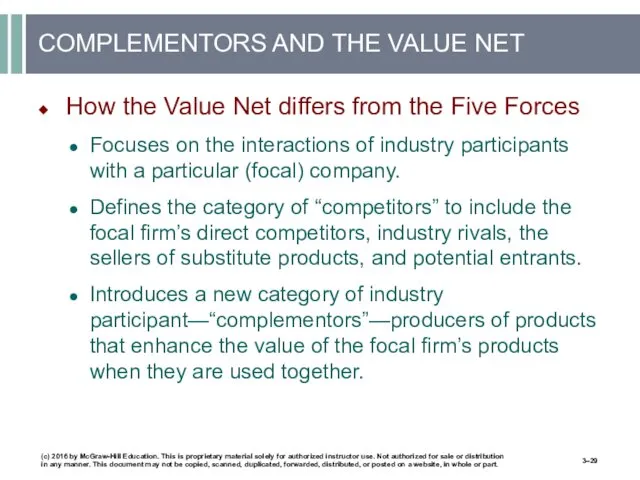
- 29. COMPLEMENTORS AND THE VALUE NET How the Value Net differs from the Five Forces Focuses on
- 30. Complementors are the producers of complementary products, which are products that enhance the value of the
- 31. FIGURE 3.9 The Value Net 3– (c) 2016 by McGraw-Hill Education. This is proprietary material solely
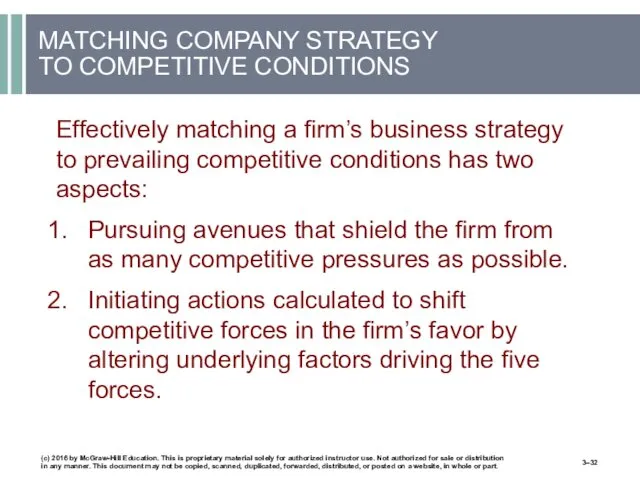
- 32. MATCHING COMPANY STRATEGY TO COMPETITIVE CONDITIONS Effectively matching a firm’s business strategy to prevailing competitive conditions
- 33. A company’s strategy is increasingly effective the more it provides some insulation from competitive pressures, shifts
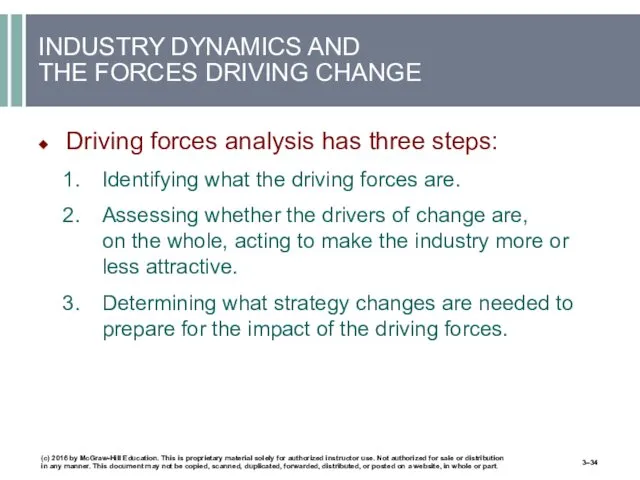
- 34. INDUSTRY DYNAMICS AND THE FORCES DRIVING CHANGE Driving forces analysis has three steps: Identifying what the
- 35. Driving forces are the major underlying causes of change in industry and competitive conditions. (c) 2016
- 36. 3– (c) 2016 by McGraw-Hill Education. This is proprietary material solely for authorized instructor use. Not
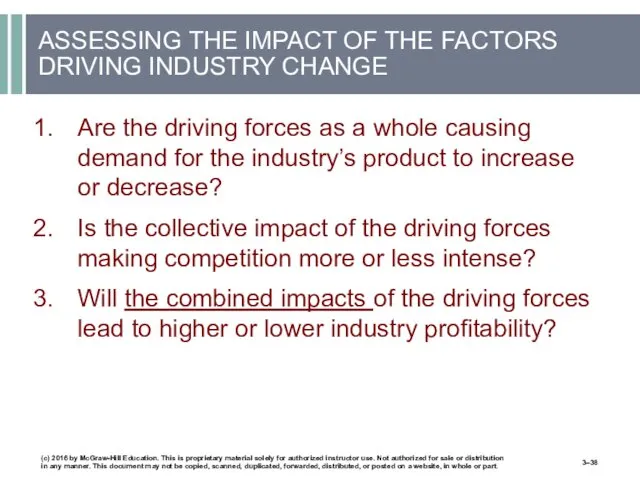
- 37. The most important part of driving forces analysis is to determine whether the collective impact of
- 38. ASSESSING THE IMPACT OF THE FACTORS DRIVING INDUSTRY CHANGE Are the driving forces as a whole
- 39. The real payoff of driving-forces analysis is to help managers understand what strategy changes are needed
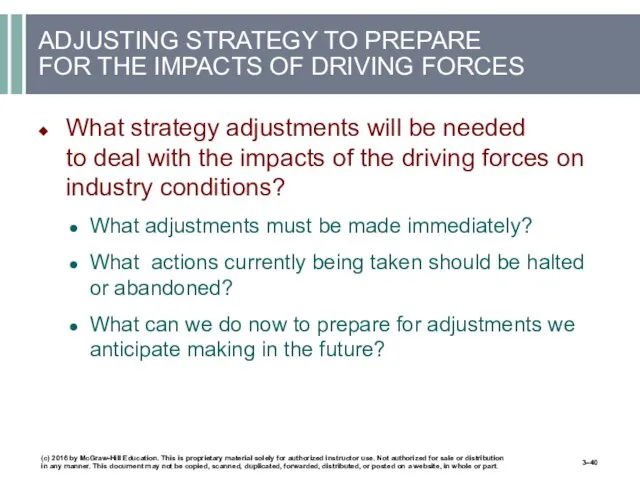
- 40. ADJUSTING STRATEGY TO PREPARE FOR THE IMPACTS OF DRIVING FORCES What strategy adjustments will be needed
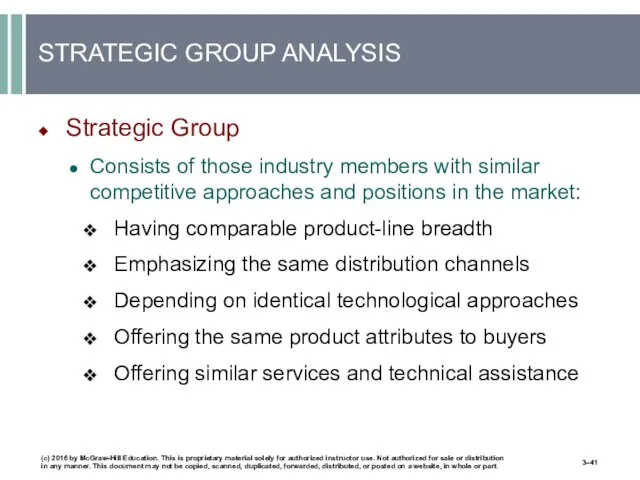
- 41. STRATEGIC GROUP ANALYSIS Strategic Group Consists of those industry members with similar competitive approaches and positions
- 42. A strategic group is a cluster of industry rivals that have similar competitive approaches and market
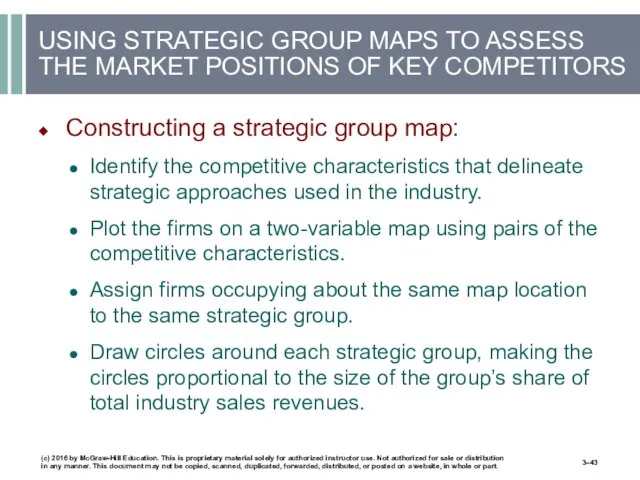
- 43. USING STRATEGIC GROUP MAPS TO ASSESS THE MARKET POSITIONS OF KEY COMPETITORS Constructing a strategic group
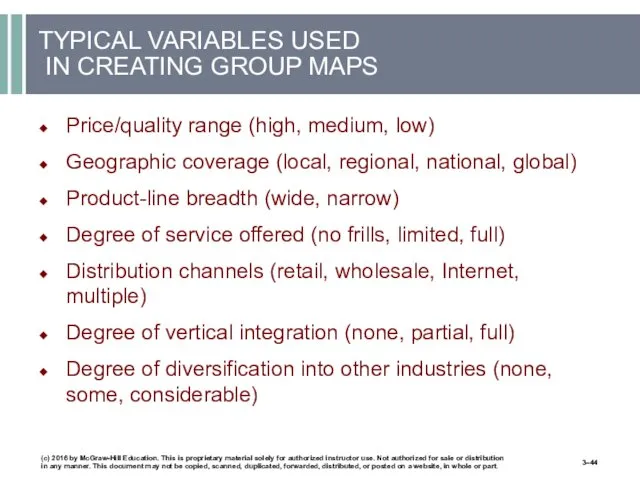
- 44. TYPICAL VARIABLES USED IN CREATING GROUP MAPS Price/quality range (high, medium, low) Geographic coverage (local, regional,
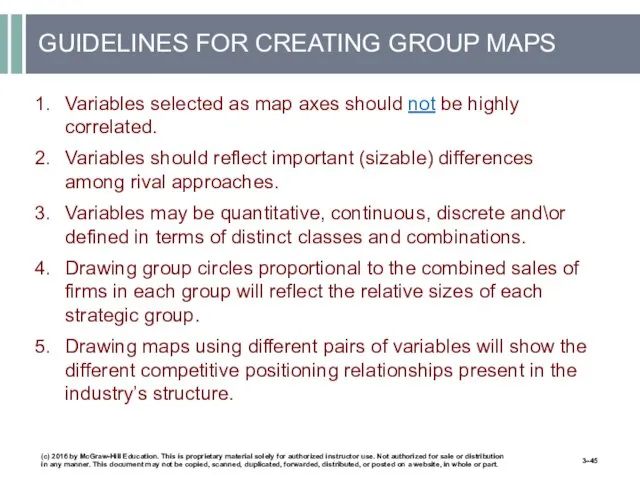
- 45. GUIDELINES FOR CREATING GROUP MAPS Variables selected as map axes should not be highly correlated. Variables
- 46. Strategic group maps reveal which companies are close competitors and which are distant competitors. (c) 2016
- 47. Footnote: Circles are drawn roughly proportional to the sizes of the chains, based on revenues. (c)
- 48. (c) 2016 by McGraw-Hill Education. This is proprietary material solely for authorized instructor use. Not authorized
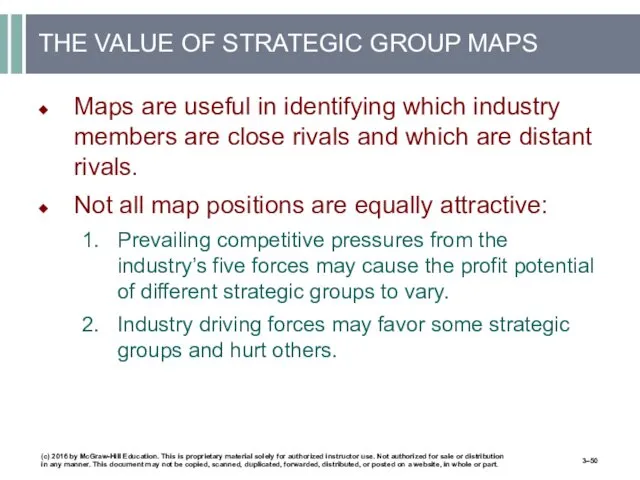
- 49. Some strategic groups are more favorably positioned than others because they confront weaker competitive forces and/
- 50. THE VALUE OF STRATEGIC GROUP MAPS Maps are useful in identifying which industry members are close
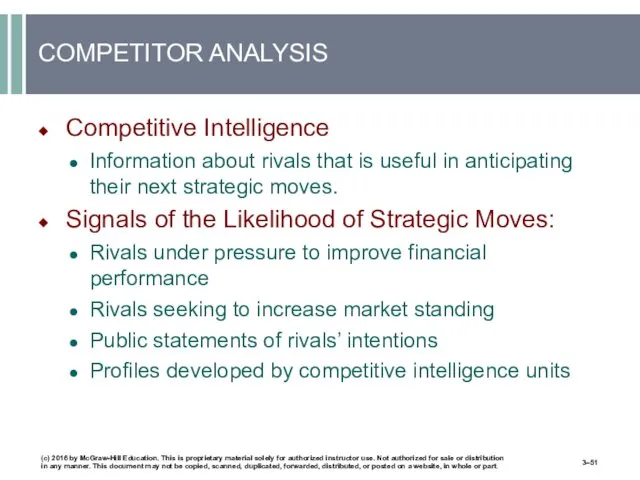
- 51. COMPETITOR ANALYSIS Competitive Intelligence Information about rivals that is useful in anticipating their next strategic moves.
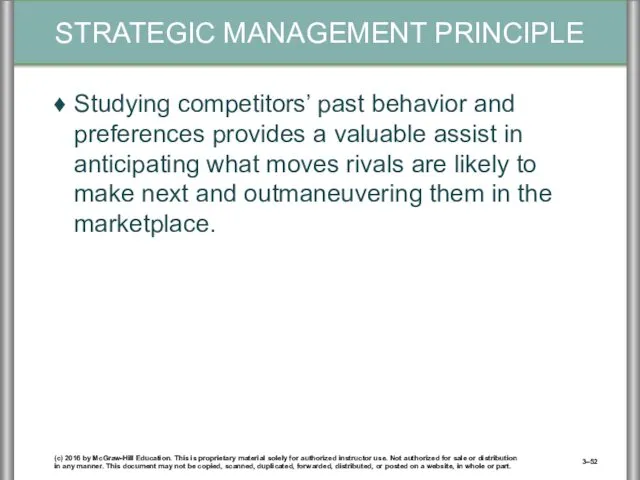
- 52. Studying competitors’ past behavior and preferences provides a valuable assist in anticipating what moves rivals are
- 53. FIGURE 3.10 A Framework for Competitor Analysis 3– (c) 2016 by McGraw-Hill Education. This is proprietary
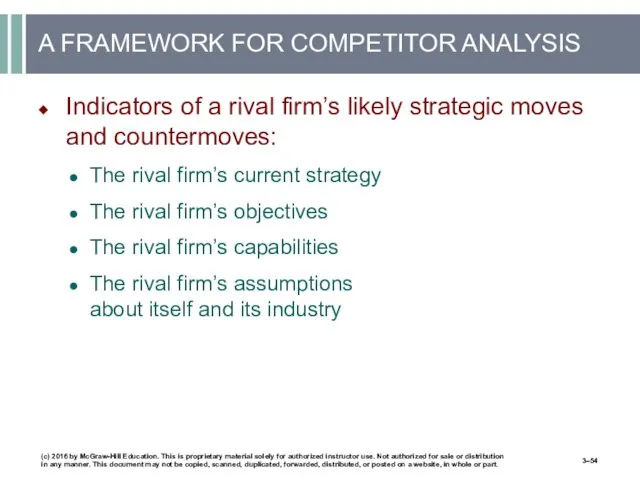
- 54. A FRAMEWORK FOR COMPETITOR ANALYSIS Indicators of a rival firm’s likely strategic moves and countermoves: The
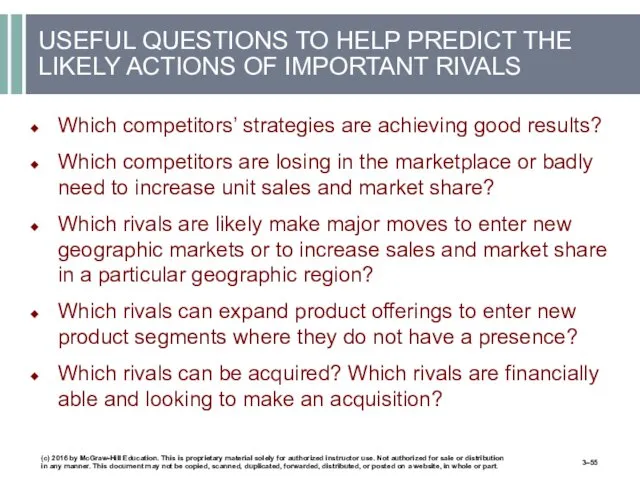
- 55. USEFUL QUESTIONS TO HELP PREDICT THE LIKELY ACTIONS OF IMPORTANT RIVALS Which competitors’ strategies are achieving
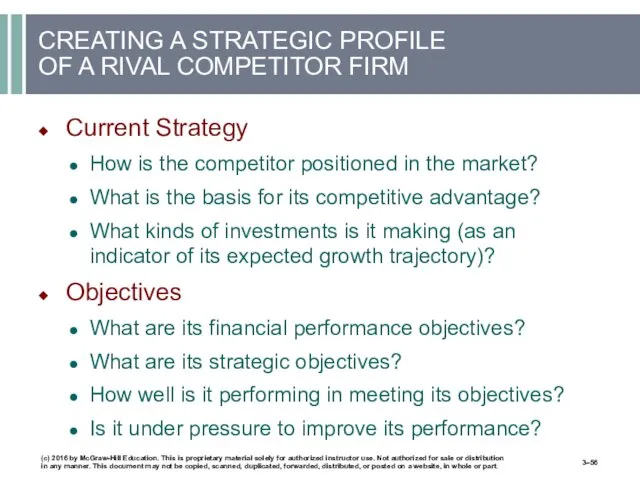
- 56. CREATING A STRATEGIC PROFILE OF A RIVAL COMPETITOR FIRM Current Strategy How is the competitor positioned
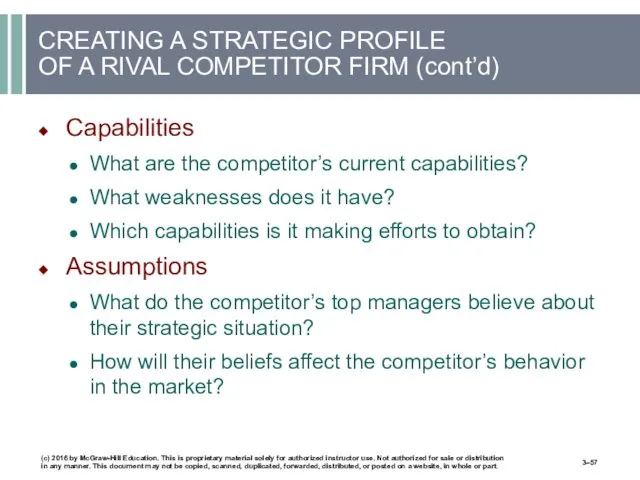
- 57. CREATING A STRATEGIC PROFILE OF A RIVAL COMPETITOR FIRM (cont’d) Capabilities What are the competitor’s current
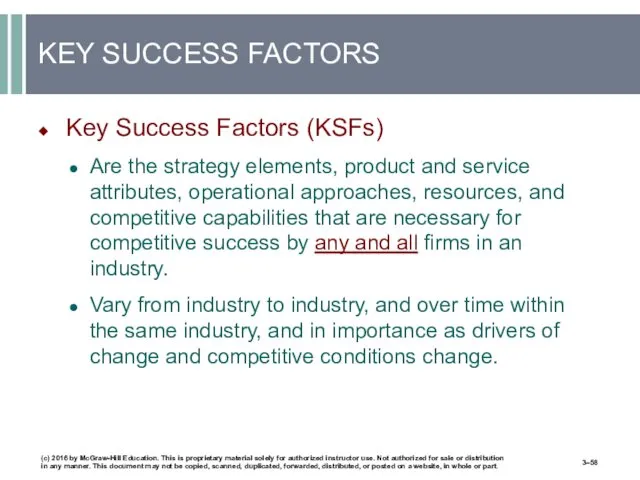
- 58. KEY SUCCESS FACTORS Key Success Factors (KSFs) Are the strategy elements, product and service attributes, operational
- 59. Key success factors are the strategy elements, product and service attributes, operational approaches, resources, and competitive
- 60. IDENTIFICATION OF KEY SUCCESS FACTORS On what basis do buyers of the industry’s product choose between
- 61. THE INDUSTRY OUTLOOK FOR PROFITABILITY An industry environment is fundamentally attractive if it presents a company
- 62. FACTORS TO CONSIDER IN ASSESSING INDUSTRY ATTRACTIVENESS How the firm is being impacted by the state
- 63. The degree to which an industry is attractive or unattractive is not the same for all
- 64. INDUSTRY ATTRACTIVENESS IS NOT THE SAME FOR ALL PARTICIPANTS Industry outsiders may conclude that they have
- 66. Скачать презентацию
3–
THIS CHAPTER WILL HELP YOU UNDERSTAND:
LO 1 How to recognize the factors
3–
THIS CHAPTER WILL HELP YOU UNDERSTAND:
LO 1 How to recognize the factors
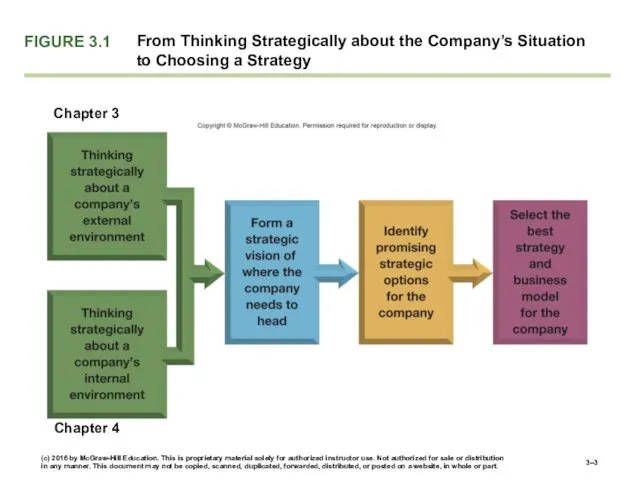
FIGURE 3.1
From Thinking Strategically about the Company’s Situation to Choosing a
FIGURE 3.1
From Thinking Strategically about the Company’s Situation to Choosing a
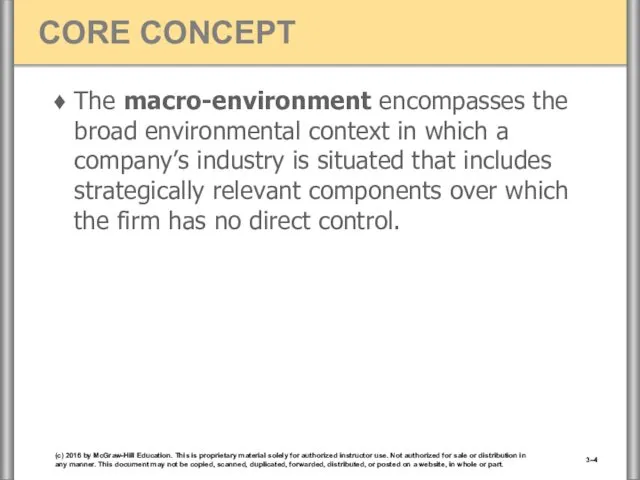
The macro-environment encompasses the broad environmental context in which a company’s
The macro-environment encompasses the broad environmental context in which a company’s
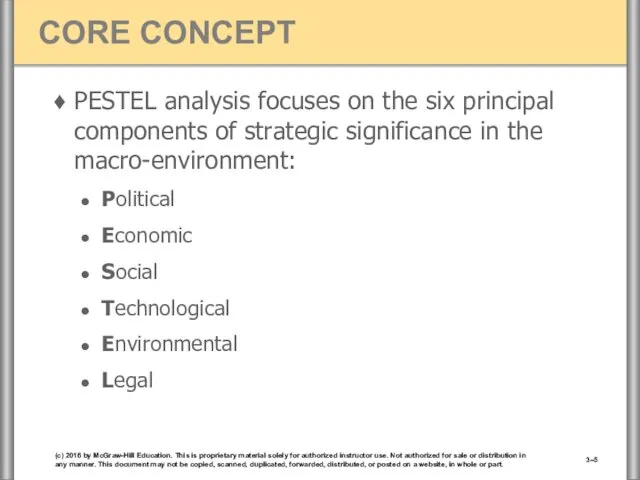
PESTEL analysis focuses on the six principal components of strategic significance
PESTEL analysis focuses on the six principal components of strategic significance
THE STRATEGICALLY RELEVANT FACTORS IN THE COMPANY'S MACRO-ENVIRONMENT
PESTEL Analysis
Focuses on principal
THE STRATEGICALLY RELEVANT FACTORS IN THE COMPANY'S MACRO-ENVIRONMENT
PESTEL Analysis
Focuses on principal
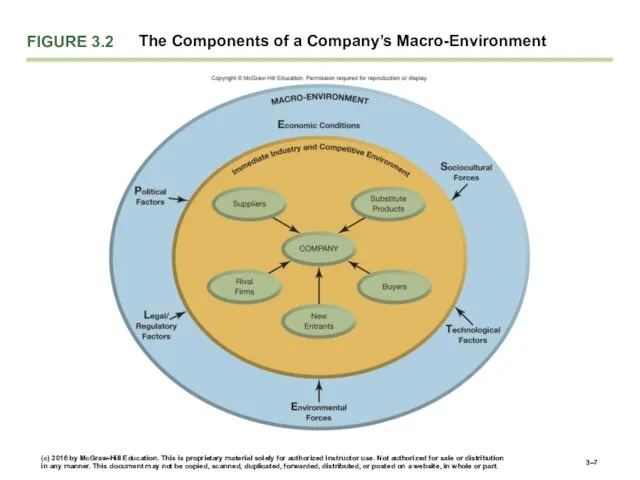
FIGURE 3.2
The Components of a Company’s Macro-Environment
3–
(c) 2016 by McGraw-Hill Education.
FIGURE 3.2
The Components of a Company’s Macro-Environment
3–
(c) 2016 by McGraw-Hill Education.
3–
(c) 2016 by McGraw-Hill Education. This is proprietary material solely for
3–
(c) 2016 by McGraw-Hill Education. This is proprietary material solely for
(c) 2016 by McGraw-Hill Education. This is proprietary material solely for
(c) 2016 by McGraw-Hill Education. This is proprietary material solely for
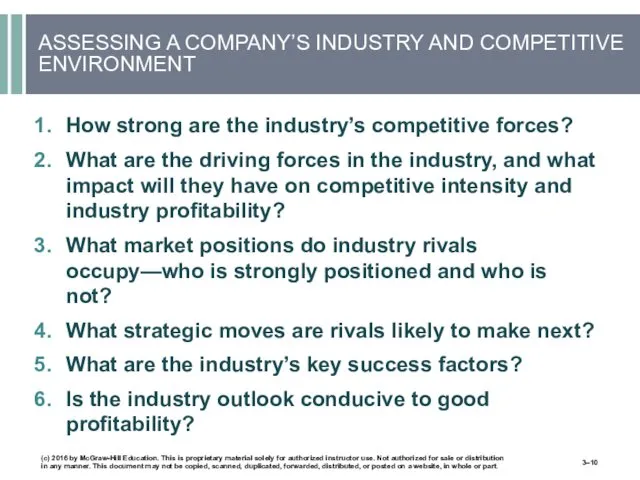
ASSESSING A COMPANY’S INDUSTRY AND COMPETITIVE ENVIRONMENT
How strong are the industry’s
ASSESSING A COMPANY’S INDUSTRY AND COMPETITIVE ENVIRONMENT
How strong are the industry’s
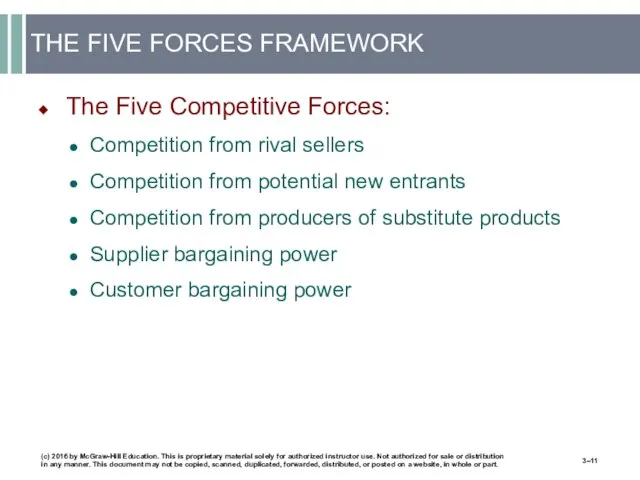
THE FIVE FORCES FRAMEWORK
The Five Competitive Forces:
Competition from rival sellers
Competition from
THE FIVE FORCES FRAMEWORK
The Five Competitive Forces:
Competition from rival sellers
Competition from
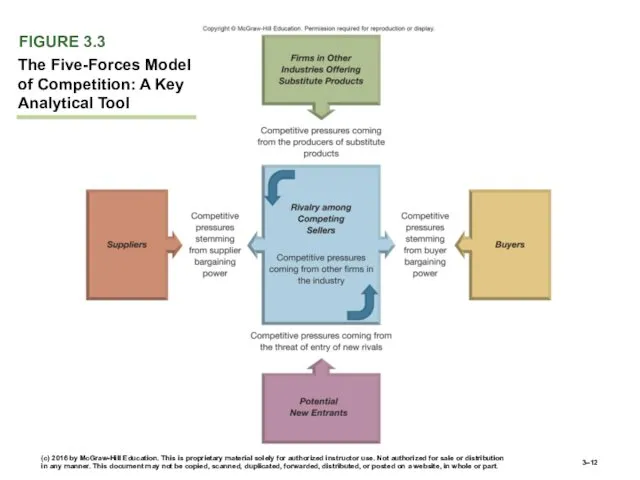
FIGURE 3.3
The Five-Forces Model of Competition: A Key Analytical Tool
3–
(c) 2016
FIGURE 3.3
The Five-Forces Model of Competition: A Key Analytical Tool
3–
(c) 2016
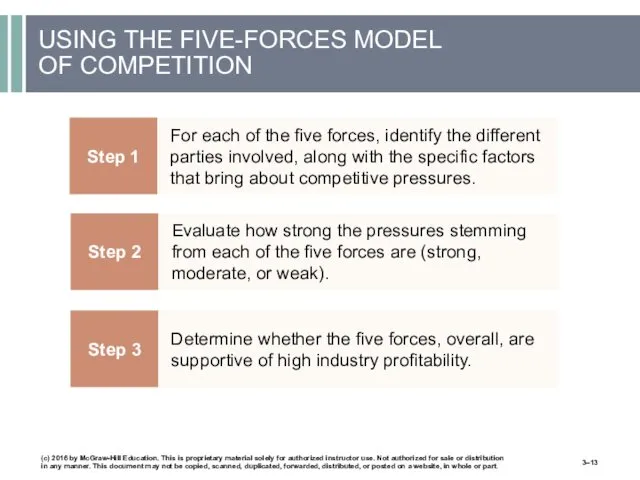
USING THE FIVE-FORCES MODEL
OF COMPETITION
Step 1
For each of the five
USING THE FIVE-FORCES MODEL
OF COMPETITION
Step 1
For each of the five
COMPETITIVE PRESSURES THAT INCREASE RIVALRY AMONG COMPETING SELLERS
Buyer demand is growing
COMPETITIVE PRESSURES THAT INCREASE RIVALRY AMONG COMPETING SELLERS
Buyer demand is growing
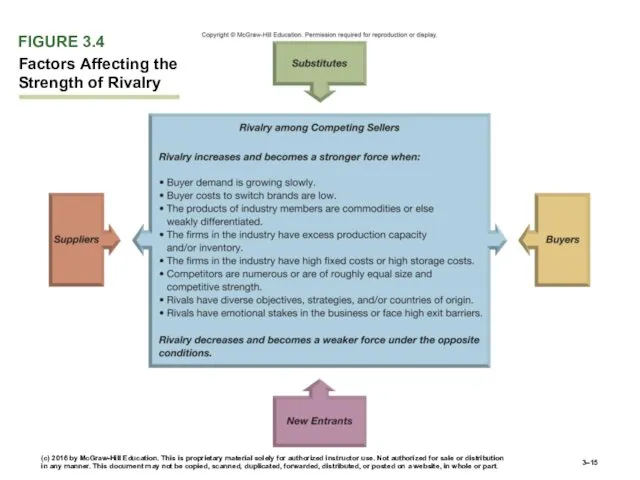
FIGURE 3.4
Factors Affecting the Strength of Rivalry
3–
(c) 2016 by McGraw-Hill Education.
FIGURE 3.4
Factors Affecting the Strength of Rivalry
3–
(c) 2016 by McGraw-Hill Education.
3–
(c) 2016 by McGraw-Hill Education. This is proprietary material solely for
3–
(c) 2016 by McGraw-Hill Education. This is proprietary material solely for
COMPETITIVE PRESSURES ASSOCIATED WITH THE THREAT OF NEW ENTRANTS
Entry Threat Considerations:
Expected
COMPETITIVE PRESSURES ASSOCIATED WITH THE THREAT OF NEW ENTRANTS
Entry Threat Considerations:
Expected
MARKET ENTRY BARRIERS
FACING NEW ENTRANTS
Incumbent cost advantages related to learning
MARKET ENTRY BARRIERS
FACING NEW ENTRANTS
Incumbent cost advantages related to learning
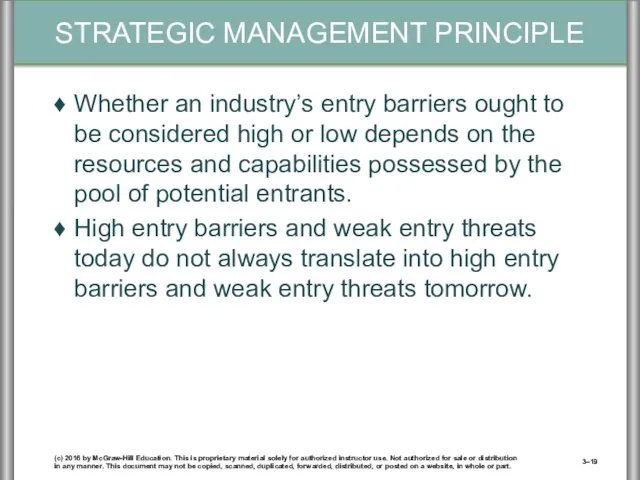
Whether an industry’s entry barriers ought to be considered high or
Whether an industry’s entry barriers ought to be considered high or
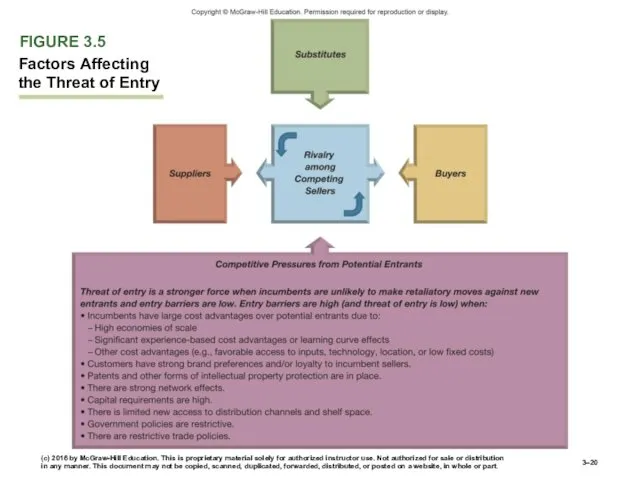
FIGURE 3.5
Factors Affecting the Threat of Entry
3–
(c) 2016 by McGraw-Hill Education.
FIGURE 3.5
Factors Affecting the Threat of Entry
3–
(c) 2016 by McGraw-Hill Education.
COMPETITIVE PRESSURES FROM THE SELLERS OF SUBSTITUTE PRODUCTS
Substitute Products Considerations:
Readily available
COMPETITIVE PRESSURES FROM THE SELLERS OF SUBSTITUTE PRODUCTS
Substitute Products Considerations:
Readily available
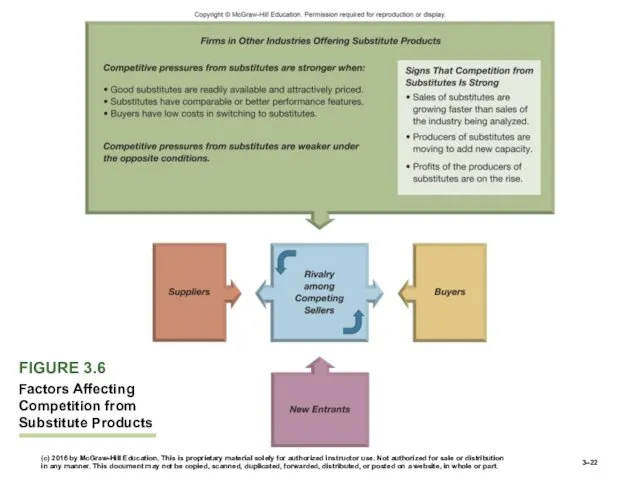
FIGURE 3.6
Factors Affecting Competition from Substitute Products
(c) 2016 by McGraw-Hill
FIGURE 3.6
Factors Affecting Competition from Substitute Products
(c) 2016 by McGraw-Hill
COMPETITIVE PRESSURES STEMMING FROM SUPPLIER BARGAINING POWER
Supplier Bargaining Power Depends On:
Strength
COMPETITIVE PRESSURES STEMMING FROM SUPPLIER BARGAINING POWER
Supplier Bargaining Power Depends On:
Strength
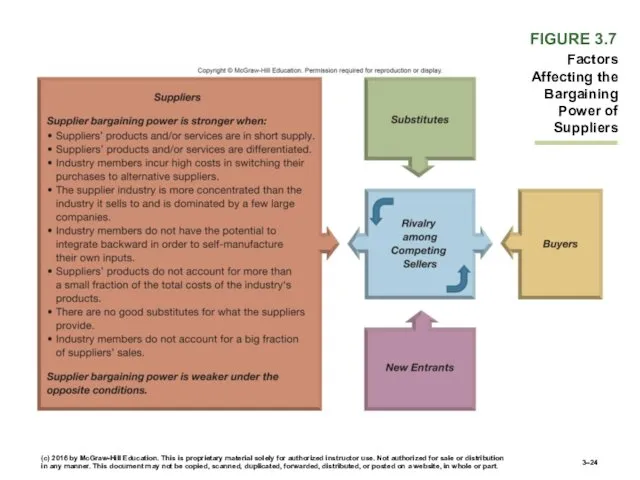
FIGURE 3.7
Factors Affecting the Bargaining Power of Suppliers
3–
(c) 2016 by McGraw-Hill
FIGURE 3.7
Factors Affecting the Bargaining Power of Suppliers
3–
(c) 2016 by McGraw-Hill
COMPETITIVE PRESSURES STEMMING
FROM BUYER BARGAINING POWER AND
PRICE SENSITIVITY
Buyer Bargaining
COMPETITIVE PRESSURES STEMMING
FROM BUYER BARGAINING POWER AND
PRICE SENSITIVITY
Buyer Bargaining
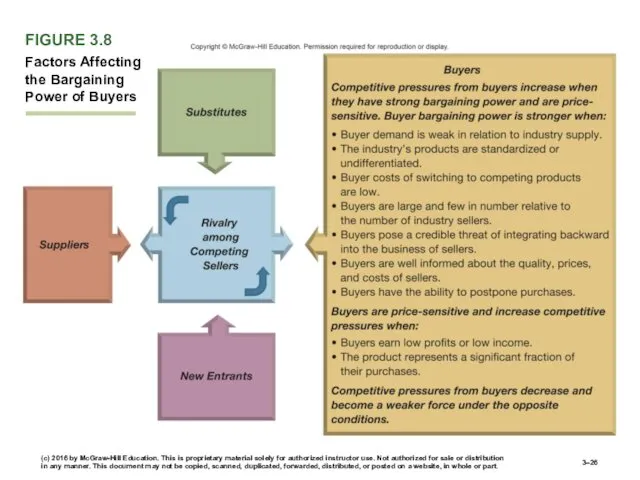
FIGURE 3.8
Factors Affecting the Bargaining Power of Buyers
3–
(c) 2016 by McGraw-Hill
FIGURE 3.8
Factors Affecting the Bargaining Power of Buyers
3–
(c) 2016 by McGraw-Hill
IS THE COLLECTIVE STRENGTH OF THE FIVE COMPETITIVE FORCES CONDUCIVE TO
IS THE COLLECTIVE STRENGTH OF THE FIVE COMPETITIVE FORCES CONDUCIVE TO
The strongest of the five forces determines the extent of the
The strongest of the five forces determines the extent of the
COMPLEMENTORS AND THE VALUE NET
How the Value Net differs from the
COMPLEMENTORS AND THE VALUE NET
How the Value Net differs from the
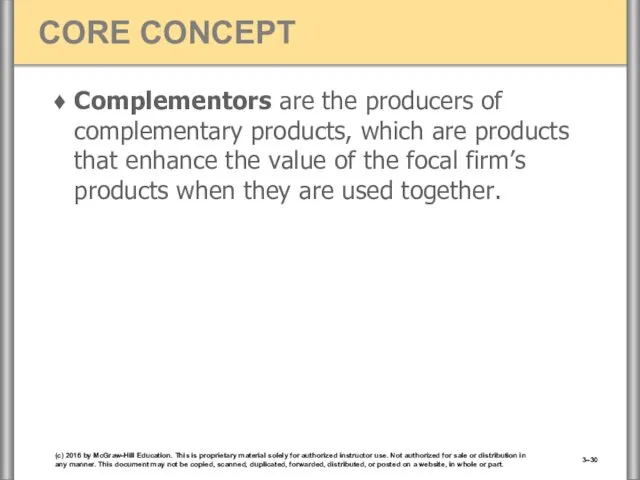
Complementors are the producers of complementary products, which are products that
Complementors are the producers of complementary products, which are products that
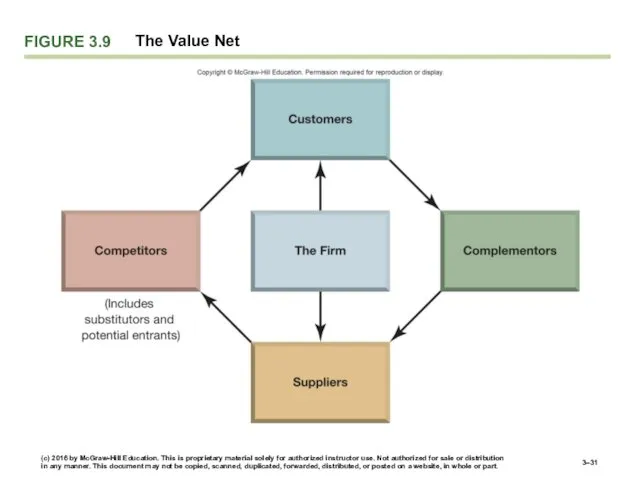
FIGURE 3.9
The Value Net
3–
(c) 2016 by McGraw-Hill Education. This is proprietary
FIGURE 3.9
The Value Net
3–
(c) 2016 by McGraw-Hill Education. This is proprietary
MATCHING COMPANY STRATEGY
TO COMPETITIVE CONDITIONS
Effectively matching a firm’s business strategy
MATCHING COMPANY STRATEGY
TO COMPETITIVE CONDITIONS
Effectively matching a firm’s business strategy
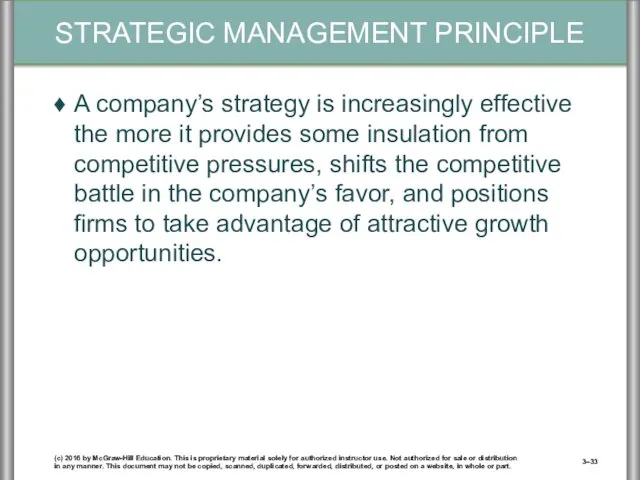
A company’s strategy is increasingly effective the more it provides some
A company’s strategy is increasingly effective the more it provides some
INDUSTRY DYNAMICS AND
THE FORCES DRIVING CHANGE
Driving forces analysis has three
INDUSTRY DYNAMICS AND
THE FORCES DRIVING CHANGE
Driving forces analysis has three
Driving forces are the major underlying causes of change in industry
Driving forces are the major underlying causes of change in industry
3–
(c) 2016 by McGraw-Hill Education. This is proprietary material solely for
3–
(c) 2016 by McGraw-Hill Education. This is proprietary material solely for
The most important part of driving forces analysis is to determine
The most important part of driving forces analysis is to determine
ASSESSING THE IMPACT OF THE FACTORS DRIVING INDUSTRY CHANGE
Are the driving
ASSESSING THE IMPACT OF THE FACTORS DRIVING INDUSTRY CHANGE
Are the driving
The real payoff of driving-forces analysis is to help managers understand
The real payoff of driving-forces analysis is to help managers understand
ADJUSTING STRATEGY TO PREPARE
FOR THE IMPACTS OF DRIVING FORCES
What strategy
ADJUSTING STRATEGY TO PREPARE
FOR THE IMPACTS OF DRIVING FORCES
What strategy
STRATEGIC GROUP ANALYSIS
Strategic Group
Consists of those industry members with similar competitive
STRATEGIC GROUP ANALYSIS
Strategic Group
Consists of those industry members with similar competitive
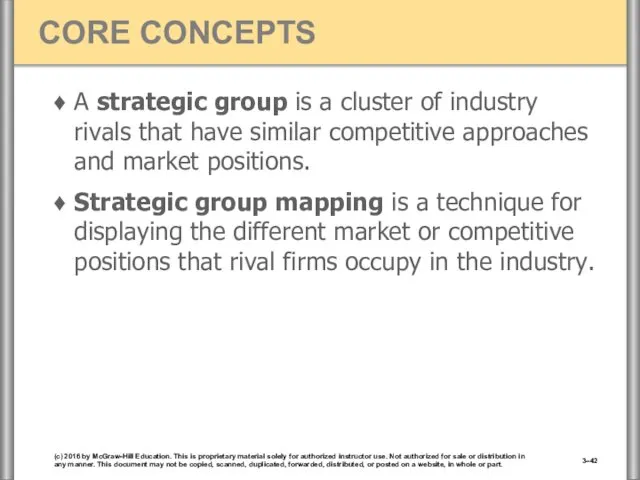
A strategic group is a cluster of industry rivals that have
A strategic group is a cluster of industry rivals that have
USING STRATEGIC GROUP MAPS TO ASSESS THE MARKET POSITIONS OF KEY
USING STRATEGIC GROUP MAPS TO ASSESS THE MARKET POSITIONS OF KEY
TYPICAL VARIABLES USED
IN CREATING GROUP MAPS
Price/quality range (high, medium, low)
Geographic
TYPICAL VARIABLES USED
IN CREATING GROUP MAPS
Price/quality range (high, medium, low)
Geographic
GUIDELINES FOR CREATING GROUP MAPS
Variables selected as map axes should not
GUIDELINES FOR CREATING GROUP MAPS
Variables selected as map axes should not
Strategic group maps reveal which companies are close competitors and which
Strategic group maps reveal which companies are close competitors and which
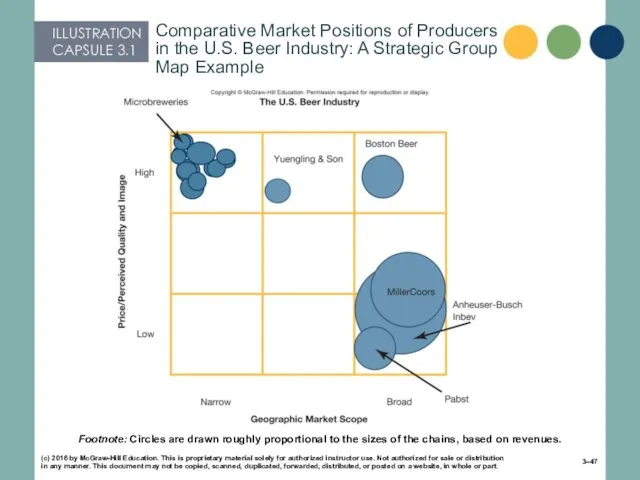
Footnote: Circles are drawn roughly proportional to the sizes of the
Footnote: Circles are drawn roughly proportional to the sizes of the
(c) 2016 by McGraw-Hill Education. This is proprietary material solely for
(c) 2016 by McGraw-Hill Education. This is proprietary material solely for
Some strategic groups are more favorably positioned than others because they
Some strategic groups are more favorably positioned than others because they
THE VALUE OF STRATEGIC GROUP MAPS
Maps are useful in identifying which
THE VALUE OF STRATEGIC GROUP MAPS
Maps are useful in identifying which
COMPETITOR ANALYSIS
Competitive Intelligence
Information about rivals that is useful in anticipating their
COMPETITOR ANALYSIS
Competitive Intelligence
Information about rivals that is useful in anticipating their
Studying competitors’ past behavior and preferences provides a valuable assist in
Studying competitors’ past behavior and preferences provides a valuable assist in
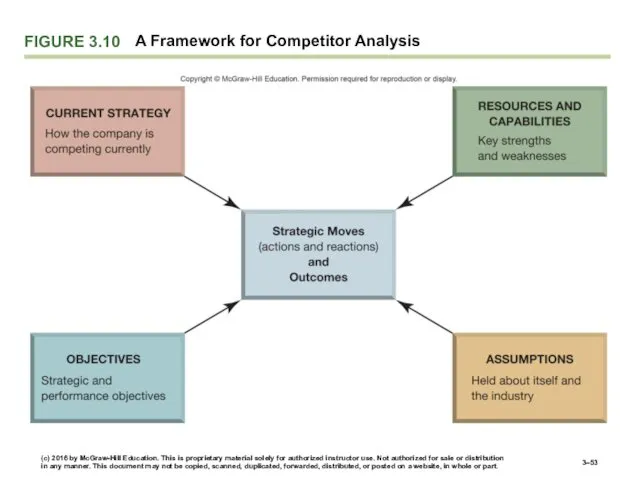
FIGURE 3.10
A Framework for Competitor Analysis
3–
(c) 2016 by McGraw-Hill Education. This
FIGURE 3.10
A Framework for Competitor Analysis
3–
(c) 2016 by McGraw-Hill Education. This
A FRAMEWORK FOR COMPETITOR ANALYSIS
Indicators of a rival firm’s likely strategic
A FRAMEWORK FOR COMPETITOR ANALYSIS
Indicators of a rival firm’s likely strategic
USEFUL QUESTIONS TO HELP PREDICT THE LIKELY ACTIONS OF IMPORTANT RIVALS
Which
USEFUL QUESTIONS TO HELP PREDICT THE LIKELY ACTIONS OF IMPORTANT RIVALS
Which
CREATING A STRATEGIC PROFILE
OF A RIVAL COMPETITOR FIRM
Current Strategy
How is
CREATING A STRATEGIC PROFILE
OF A RIVAL COMPETITOR FIRM
Current Strategy
How is
CREATING A STRATEGIC PROFILE
OF A RIVAL COMPETITOR FIRM (cont’d)
Capabilities
What are
CREATING A STRATEGIC PROFILE
OF A RIVAL COMPETITOR FIRM (cont’d)
Capabilities
What are
KEY SUCCESS FACTORS
Key Success Factors (KSFs)
Are the strategy elements, product and
KEY SUCCESS FACTORS
Key Success Factors (KSFs)
Are the strategy elements, product and
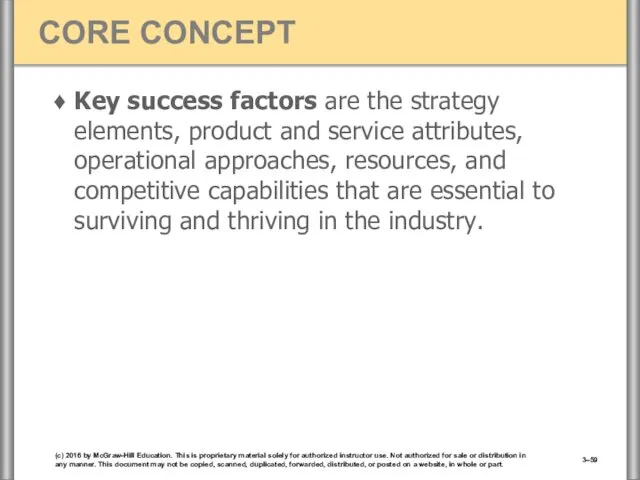
Key success factors are the strategy elements, product and service attributes,
Key success factors are the strategy elements, product and service attributes,
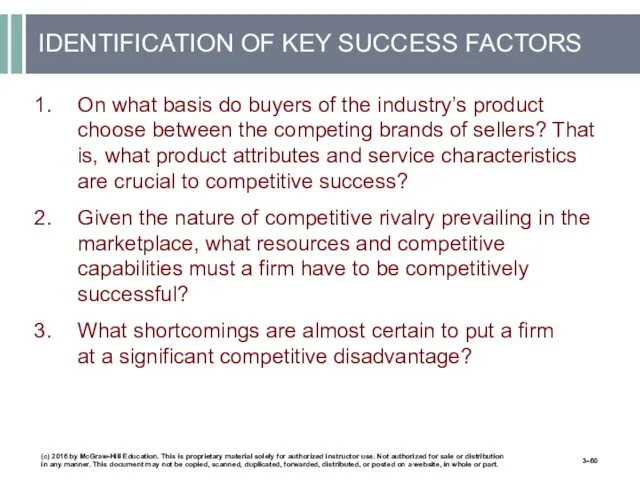
IDENTIFICATION OF KEY SUCCESS FACTORS
On what basis do buyers of the
IDENTIFICATION OF KEY SUCCESS FACTORS
On what basis do buyers of the
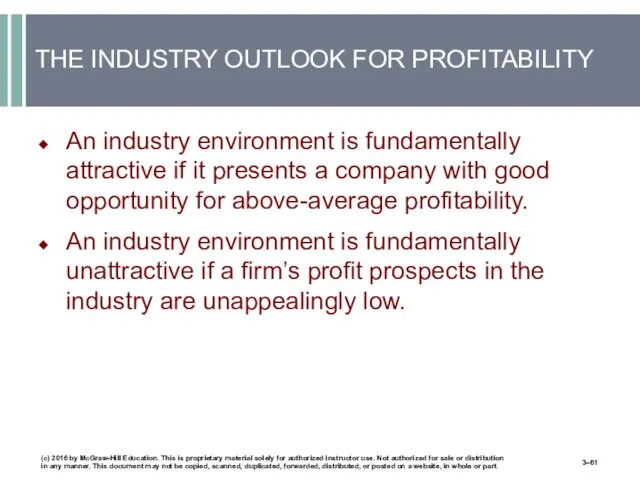
THE INDUSTRY OUTLOOK FOR PROFITABILITY
An industry environment is fundamentally attractive if
THE INDUSTRY OUTLOOK FOR PROFITABILITY
An industry environment is fundamentally attractive if
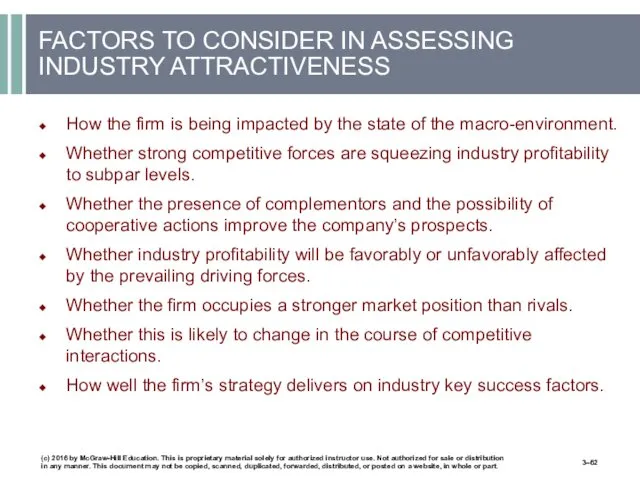
FACTORS TO CONSIDER IN ASSESSING INDUSTRY ATTRACTIVENESS
How the firm is being
FACTORS TO CONSIDER IN ASSESSING INDUSTRY ATTRACTIVENESS
How the firm is being
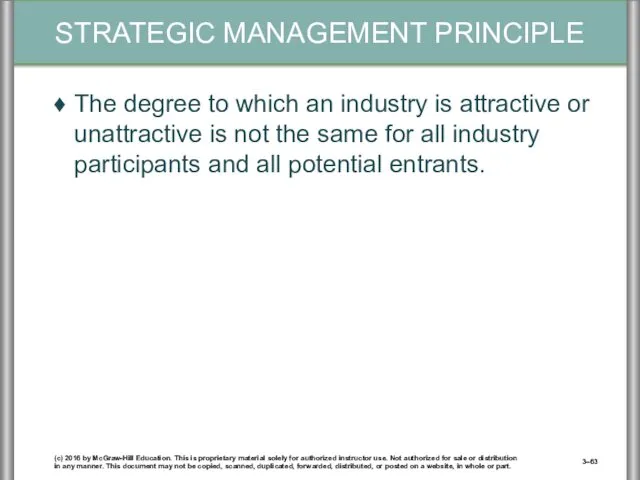
The degree to which an industry is attractive or unattractive is
The degree to which an industry is attractive or unattractive is
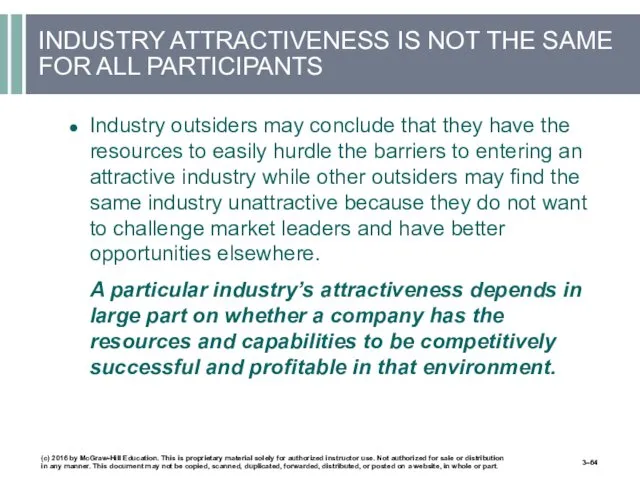
INDUSTRY ATTRACTIVENESS IS NOT THE SAME FOR ALL PARTICIPANTS
Industry outsiders may
INDUSTRY ATTRACTIVENESS IS NOT THE SAME FOR ALL PARTICIPANTS
Industry outsiders may
 Организационные структуры ПАО Иркутскэнерго и ООО Иркутскэнергосбыт
 Управление проектами
 Системный анализ в исследовании управления
 Технології та інструменти внутрішніх корпоративних зв’язків з громадськістю
 Основы управления высокотехнологичными программами и проектами
 Технология подготовки и реализации управленческих решений
 Political Aspects of the International Travel, Tourism, and Lodging Industry
 Нормирование технологических процессов
 Intercultural Communication. Programme Objectives
 Организация производства и управление предприятием
 Адаптация персонала. Понятие, цели и виды адаптации. Методы и стадии адаптации персонала
 Конференция менеджеров 2016. Второй шанс
 Оценка эффективности транспортно-технологических систем; принципы исследования эффективности, критерии оценки эффективности
 The Nature of Strategic Management
 Логистика складирования
 Объекты и субъекты управления проектами
 Отбор персонала в организацию
 Стратегия управления персоналом. Кадровая политика организации
 HR-брендинг
 Инновационная стратегия организации
 Помещения гостиниц и их оборудование
 Теории управления персоналом
 Технологія процесу управління
 Организационные структуры управления в гостиницах
 Разработка бюджета службы логистики (Тема 8)
 Рекрутинг в социальной сети. Компания Avon
 Аудит человеческих ресурсов
 Спортивный менеджмент. Сравнительный анализ государственного и местного управления ФКиС в России и зарубежных странах