- Time Management

Содержание
- 2. Understand the importance of project schedules and good project time management Define activities as the basis
- 3. Managers often cite delivering projects on time as one of their biggest challenges Time has the
- 4. One dimension of the Meyers-Briggs Type Indicator focuses on peoples’ attitudes toward structure and deadlines Some
- 5. Overview
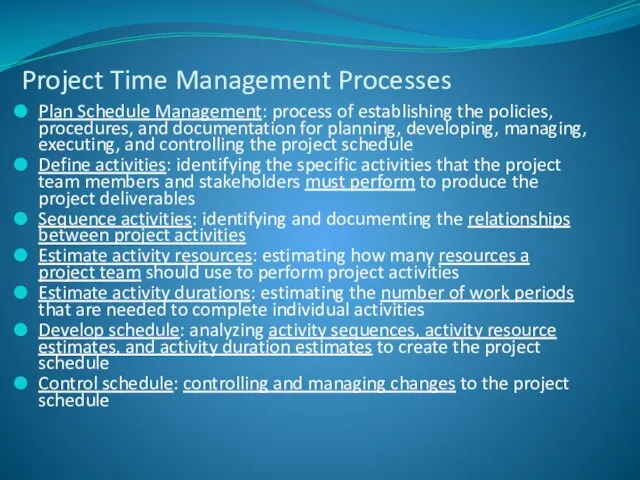
- 6. Plan Schedule Management: process of establishing the policies, procedures, and documentation for planning, developing, managing, executing,
- 7. Plan Schedule Management is the process of establishing the policies, procedures, and documentation for planning, developing,
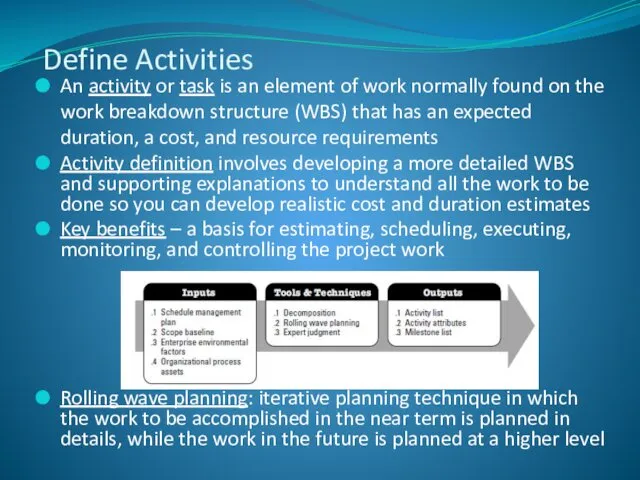
- 8. An activity or task is an element of work normally found on the work breakdown structure
- 9. An activity list is a tabulation of activities to be included on a project schedule that
- 10. A milestone is a significant event that normally has no duration It often takes several activities
- 11. Involves reviewing activities and determining dependencies Key benefit – defines the logical sequence of work to
- 12. Network diagrams are the preferred technique for showing activity sequencing A network diagram is a schematic
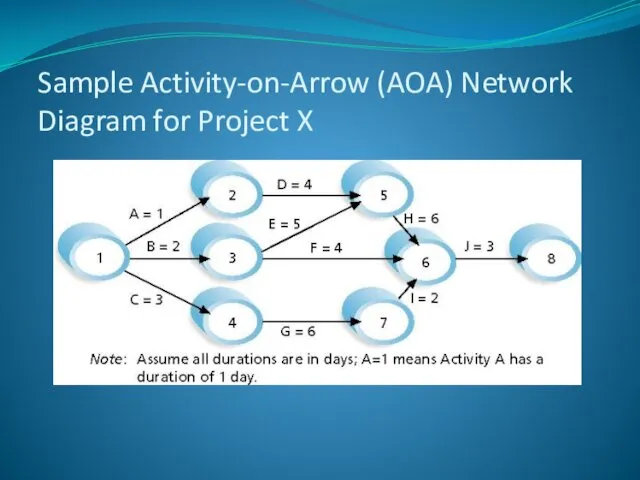
- 13. Also called activity-on-arrow (AOA) network diagrams Activities are represented by arrows Nodes or circles are the
- 14. Sample Activity-on-Arrow (AOA) Network Diagram for Project X
- 15. Activities are represented by boxes Arrows show relationships between activities More popular than ADM method and
- 16. Sample PDM Network Diagram
- 17. Task Dependency Types Examples: Finish-To-Start: Pour Foundation -> Build the room, Race -> Award ceremony Start-To-Start:
- 18. Before estimating activity durations, you must have a good idea of the quantity and type of
- 19. Estimate Activity Resources A resource breakdown structure is a hierarchical structure that identifies the project’s resources
- 20. Process of estimating the number of work periods needed to complete individual activities with estimated resources
- 21. Analogous estimating: Is a technique for estimating the duration or cost of an activity or a
- 22. Uses results of the other time management processes to determine the start and end date of
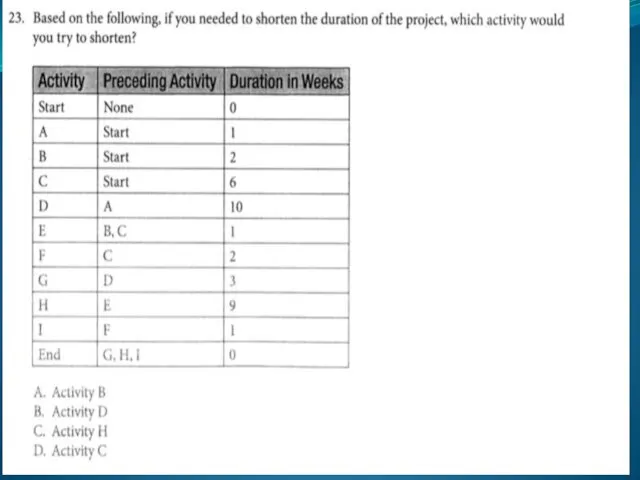
- 23. CPM is a network diagramming technique used to predict total project duration A critical path for
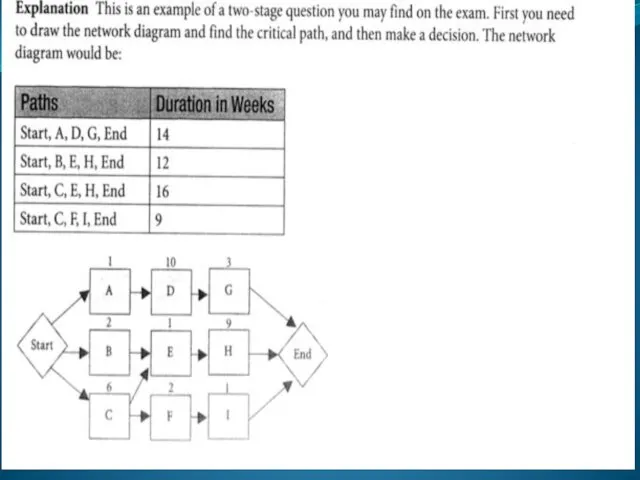
- 24. First develop a good network diagram Add the duration estimates for all activities on each path
- 25. Determining the Critical Path for Project X
- 28. Three main techniques for shortening schedules Shortening durations of critical activities/tasks by adding more resources or
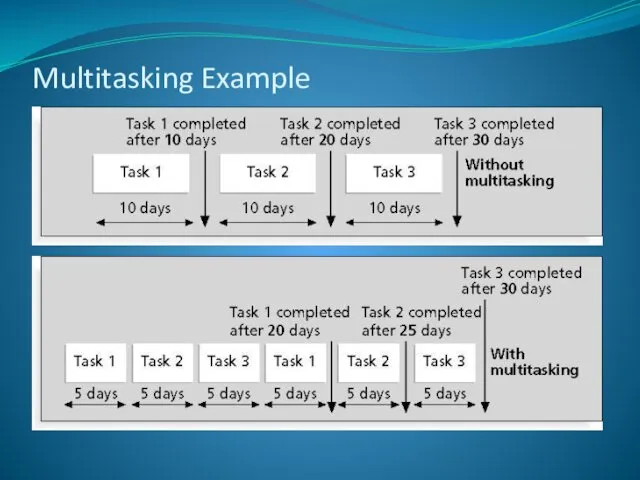
- 29. It is important to update project schedule information to meet time goals for a project The
- 30. Multitasking Example
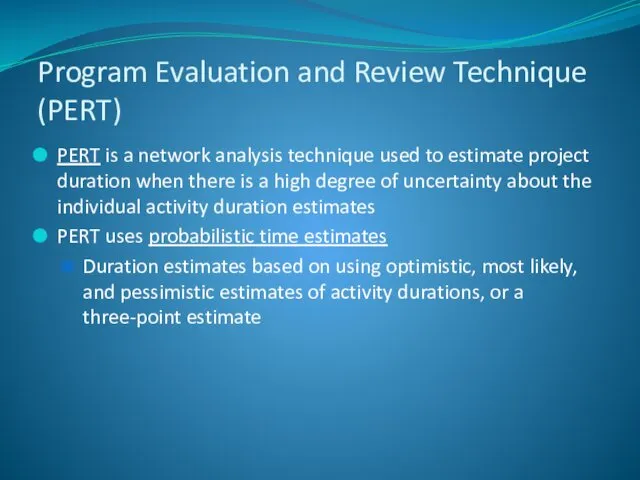
- 31. PERT is a network analysis technique used to estimate project duration when there is a high
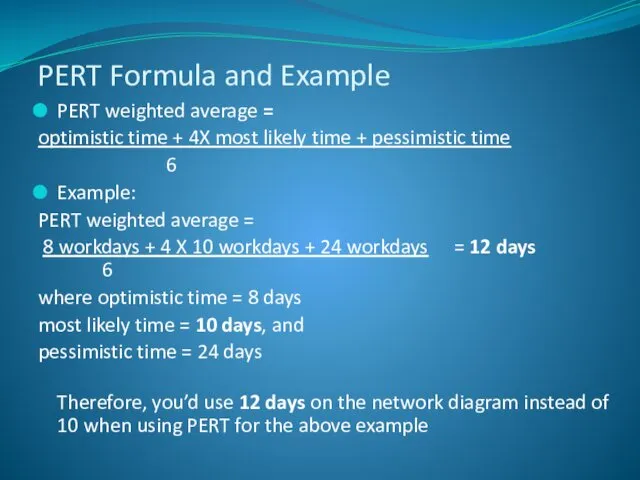
- 32. PERT weighted average = optimistic time + 4X most likely time + pessimistic time 6 Example:
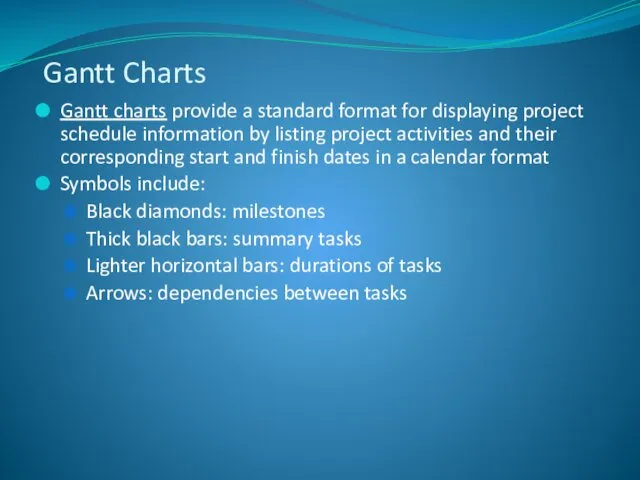
- 33. Gantt charts provide a standard format for displaying project schedule information by listing project activities and
- 34. Gantt Chart for Project X Note: Darker bars would be red in Project 2007 to represent
- 35. Gantt Chart for Software Launch Project
- 36. Goals are to know the status of the schedule, influence factors that cause schedule changes, determine
- 37. Perform reality checks on schedules Allow for contingencies Don’t plan for everyone to work at 100%
- 38. First review the draft schedule or estimated completion date in the project charter Prepare a more
- 39. Strong leadership helps projects succeed more than good PERT charts Project managers should use: Empowerment Incentives
- 41. Скачать презентацию
Understand the importance of project schedules and good project time management
Define
Understand the importance of project schedules and good project time management
Define
Managers often cite delivering projects on time as one of their
Managers often cite delivering projects on time as one of their
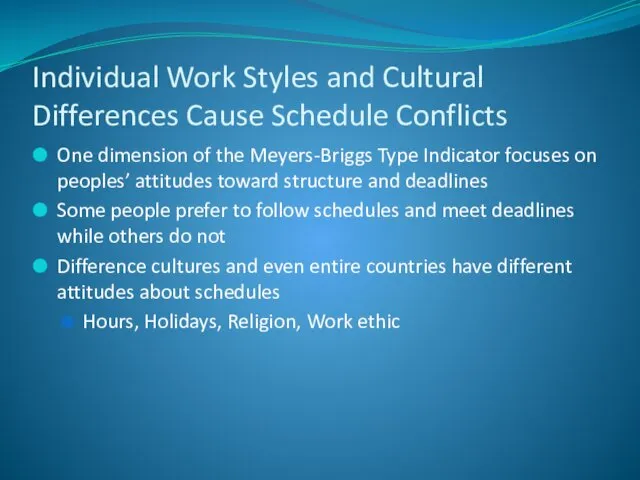
One dimension of the Meyers-Briggs Type Indicator focuses on peoples’ attitudes
One dimension of the Meyers-Briggs Type Indicator focuses on peoples’ attitudes
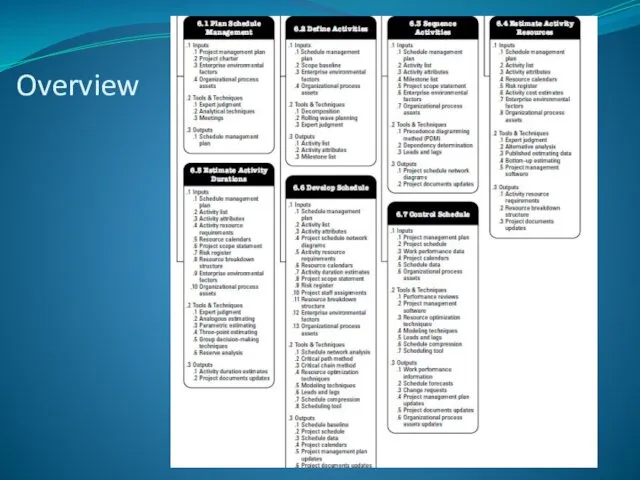
Overview
Overview
Plan Schedule Management: process of establishing the policies, procedures, and documentation
Plan Schedule Management: process of establishing the policies, procedures, and documentation
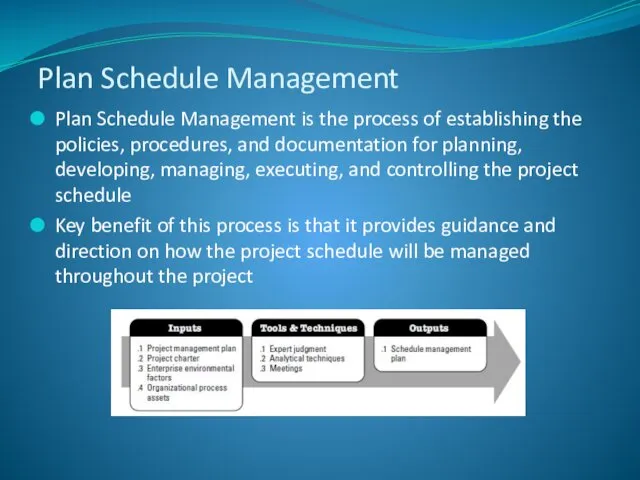
Plan Schedule Management is the process of establishing the policies, procedures,
Plan Schedule Management is the process of establishing the policies, procedures,
An activity or task is an element of work normally found
An activity or task is an element of work normally found
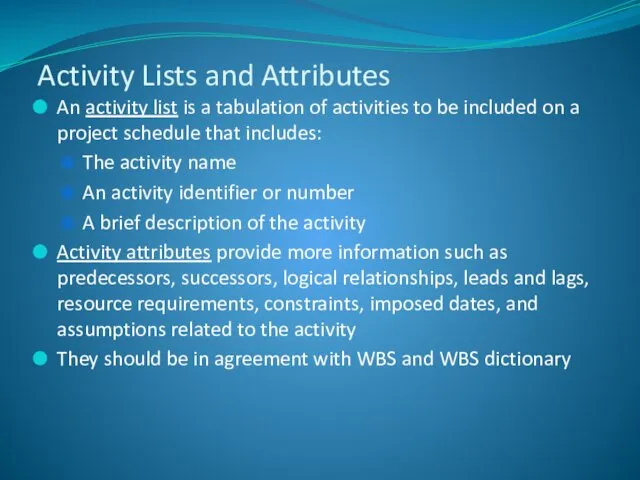
An activity list is a tabulation of activities to be included
An activity list is a tabulation of activities to be included
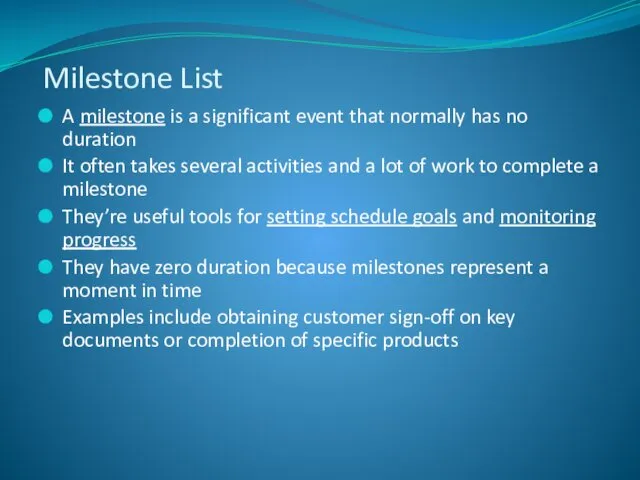
A milestone is a significant event that normally has no duration
It
A milestone is a significant event that normally has no duration
It
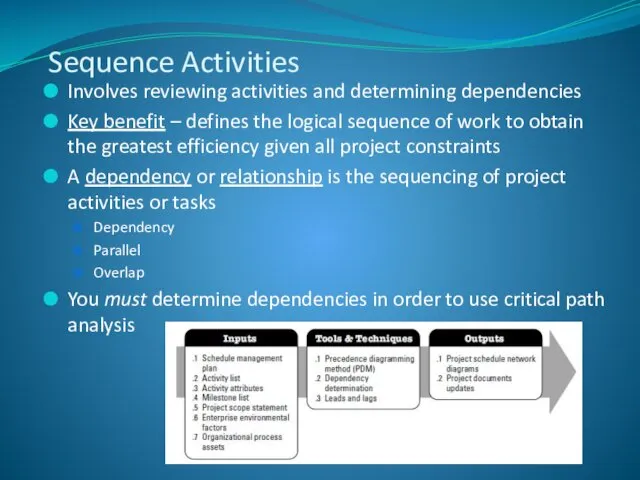
Involves reviewing activities and determining dependencies
Key benefit – defines the logical
Involves reviewing activities and determining dependencies
Key benefit – defines the logical
Network diagrams are the preferred technique for showing activity sequencing
A network
Network diagrams are the preferred technique for showing activity sequencing
A network
Also called activity-on-arrow (AOA) network diagrams
Activities are represented by arrows
Nodes or
Also called activity-on-arrow (AOA) network diagrams
Activities are represented by arrows
Nodes or
Sample Activity-on-Arrow (AOA) Network Diagram for Project X
Sample Activity-on-Arrow (AOA) Network Diagram for Project X
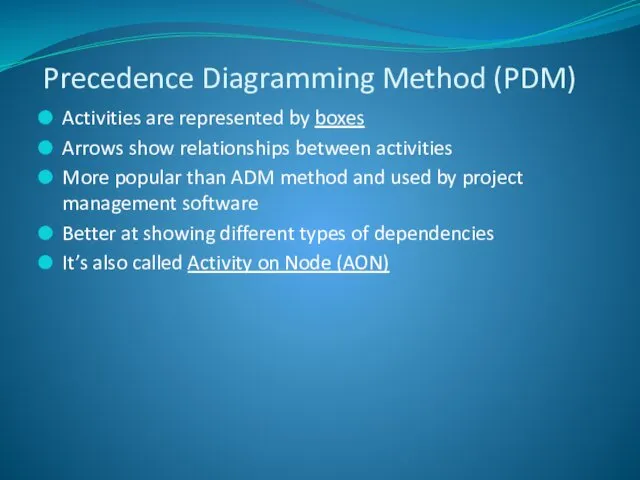
Activities are represented by boxes
Arrows show relationships between activities
More popular than
Activities are represented by boxes
Arrows show relationships between activities
More popular than
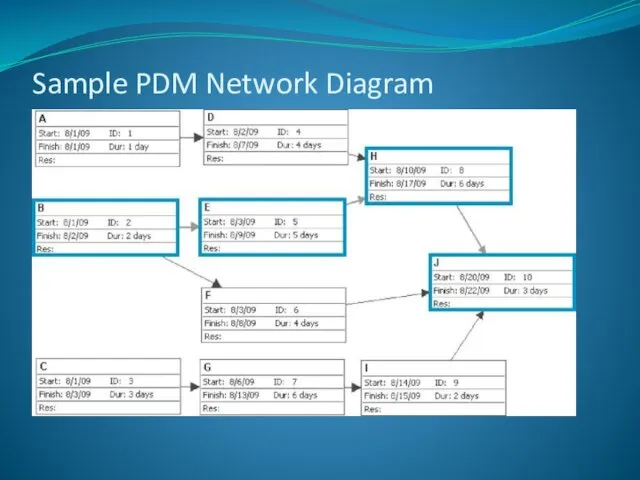
Sample PDM Network Diagram
Sample PDM Network Diagram
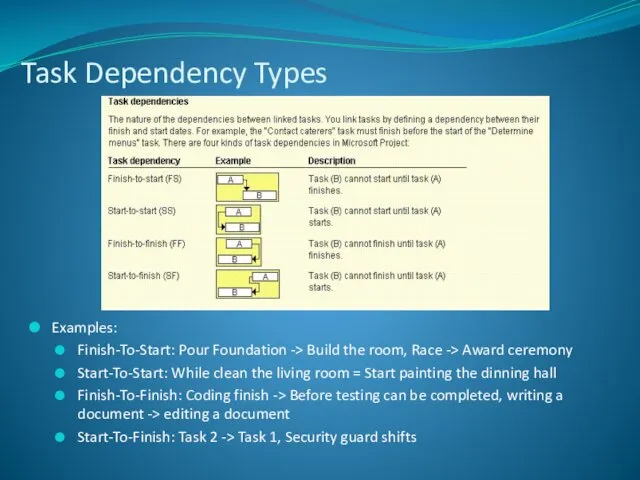
Task Dependency Types
Examples:
Finish-To-Start: Pour Foundation -> Build the room, Race ->
Task Dependency Types
Examples:
Finish-To-Start: Pour Foundation -> Build the room, Race ->
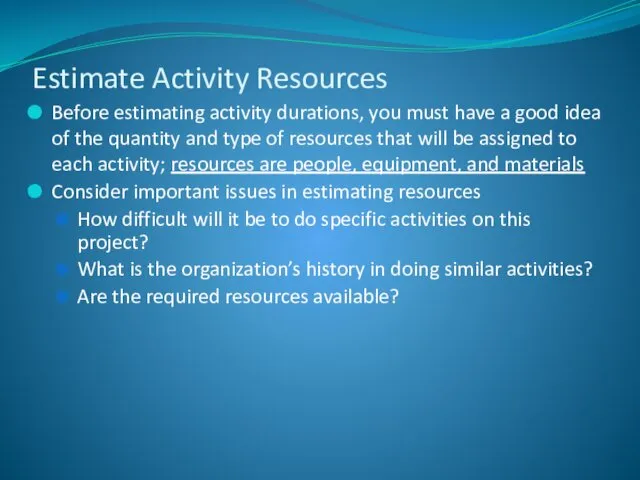
Before estimating activity durations, you must have a good idea of
Before estimating activity durations, you must have a good idea of
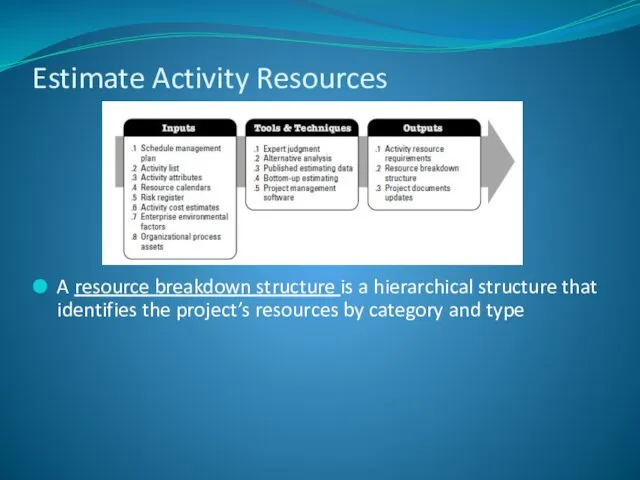
Estimate Activity Resources
A resource breakdown structure is a hierarchical structure that
Estimate Activity Resources
A resource breakdown structure is a hierarchical structure that
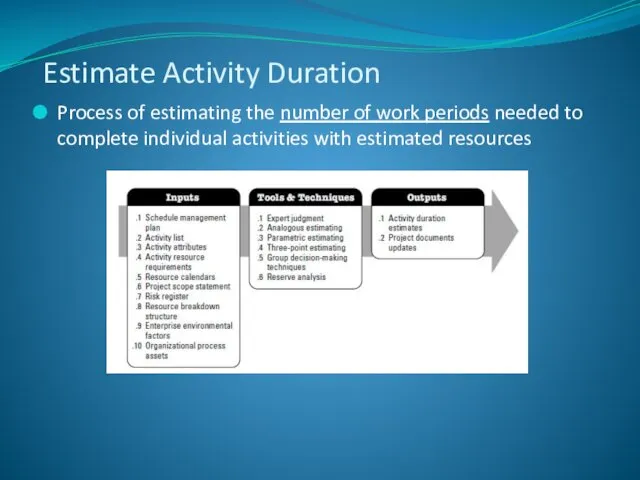
Process of estimating the number of work periods needed to complete
Process of estimating the number of work periods needed to complete
Analogous estimating: Is a technique for estimating the duration or cost
Analogous estimating: Is a technique for estimating the duration or cost
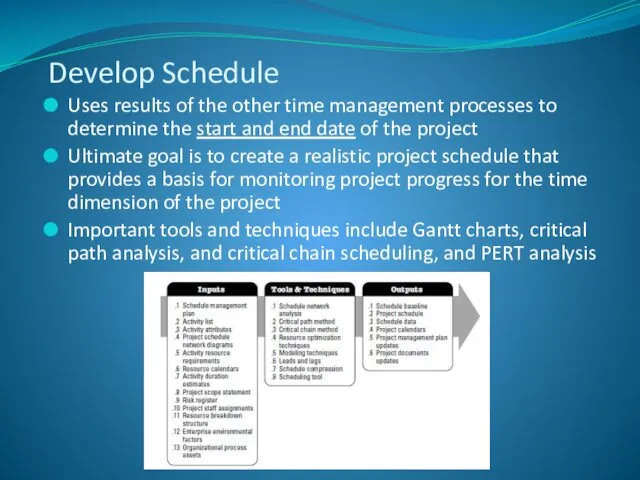
Uses results of the other time management processes to determine the
Uses results of the other time management processes to determine the
CPM is a network diagramming technique used to predict total project
CPM is a network diagramming technique used to predict total project
First develop a good network diagram
Add the duration estimates for all
First develop a good network diagram
Add the duration estimates for all
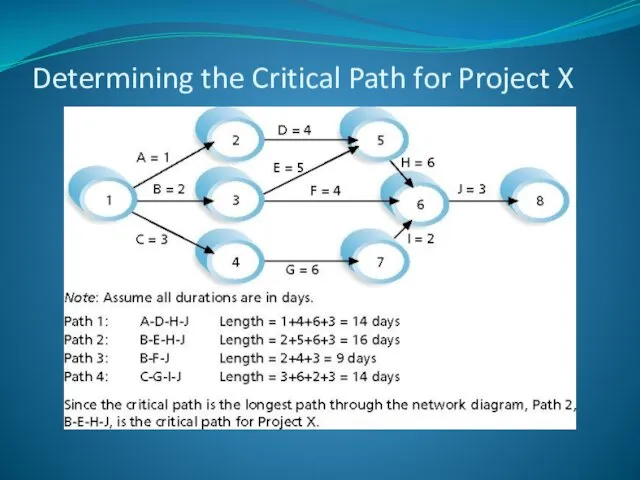
Determining the Critical Path for Project X
Determining the Critical Path for Project X
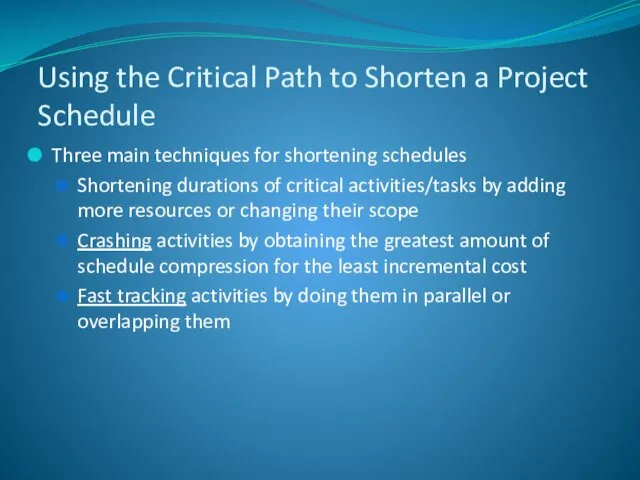
Three main techniques for shortening schedules
Shortening durations of critical activities/tasks by
Three main techniques for shortening schedules
Shortening durations of critical activities/tasks by
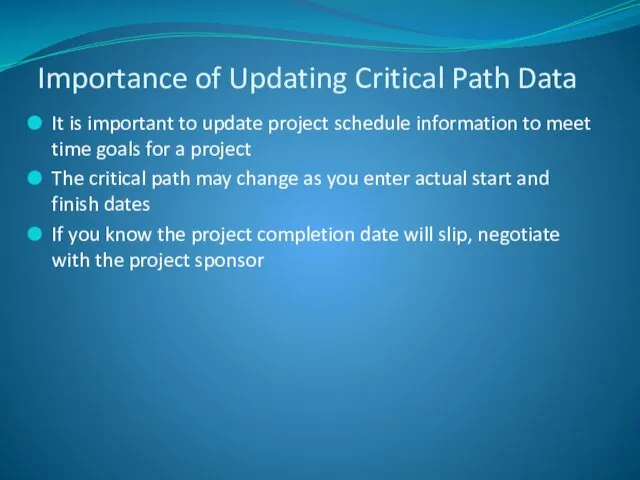
It is important to update project schedule information to meet time
It is important to update project schedule information to meet time
Multitasking Example
Multitasking Example
PERT is a network analysis technique used to estimate project duration
PERT is a network analysis technique used to estimate project duration
PERT weighted average =
optimistic time + 4X most likely time
PERT weighted average =
optimistic time + 4X most likely time
Gantt charts provide a standard format for displaying project schedule information
Gantt charts provide a standard format for displaying project schedule information
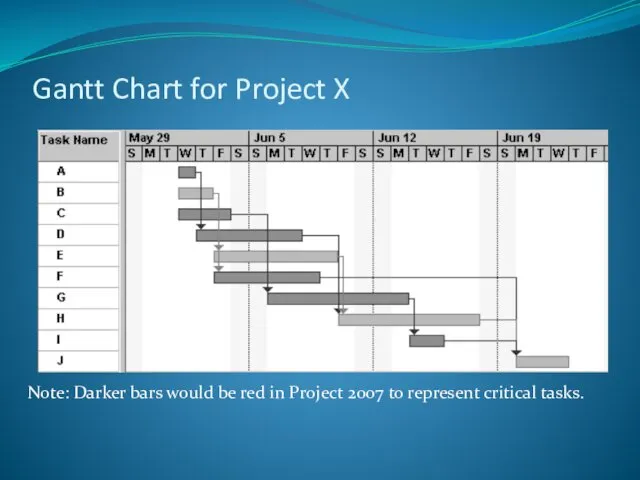
Gantt Chart for Project X
Note: Darker bars would be red in
Gantt Chart for Project X
Note: Darker bars would be red in
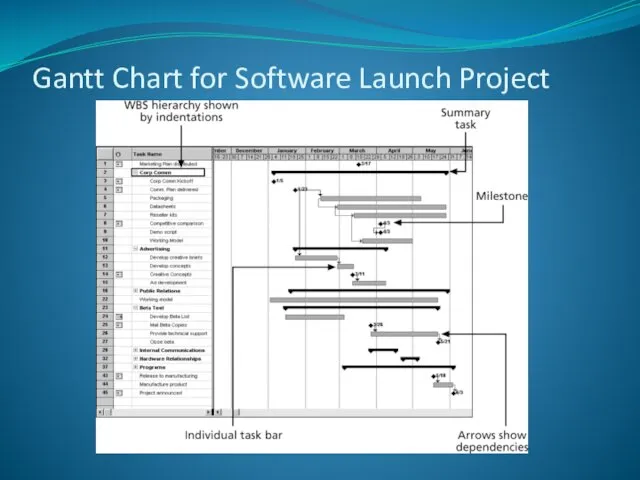
Gantt Chart for Software Launch Project
Gantt Chart for Software Launch Project
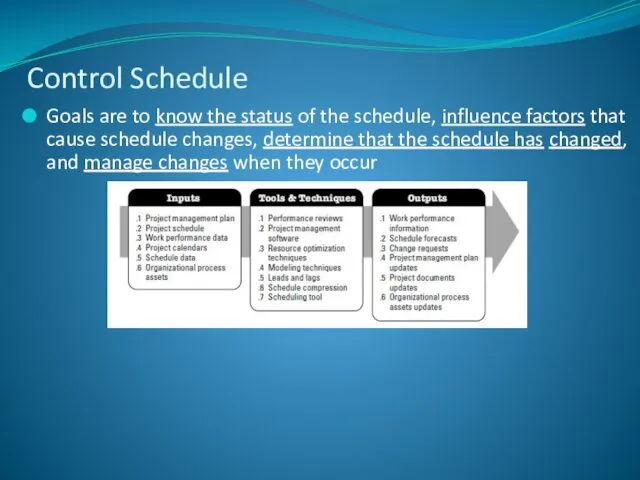
Goals are to know the status of the schedule, influence factors
Goals are to know the status of the schedule, influence factors
Perform reality checks on schedules
Allow for contingencies
Don’t plan for everyone to
Perform reality checks on schedules
Allow for contingencies
Don’t plan for everyone to
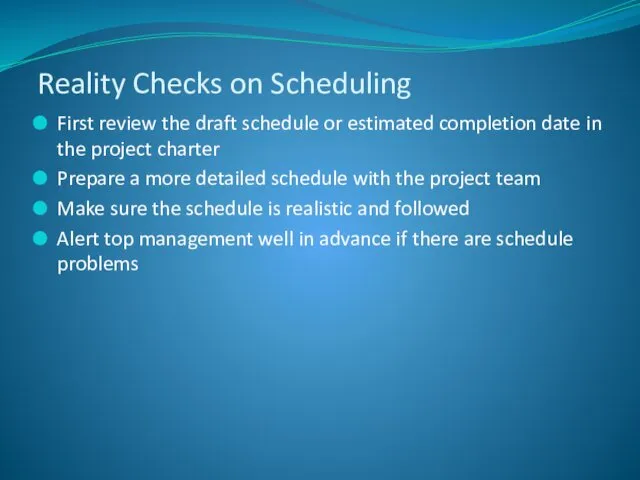
First review the draft schedule or estimated completion date in the
First review the draft schedule or estimated completion date in the
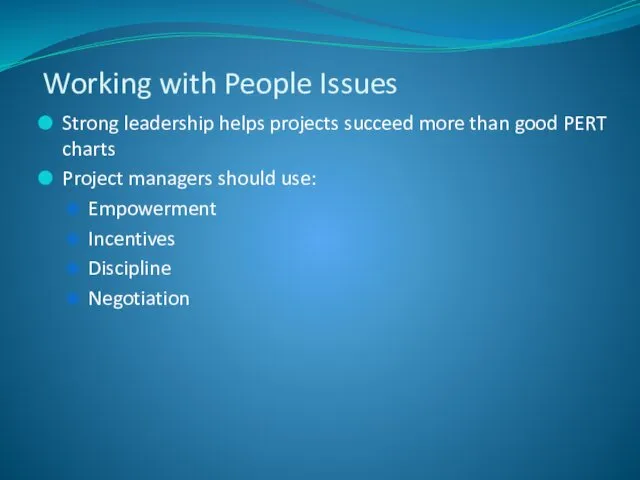
Strong leadership helps projects succeed more than good PERT charts
Project managers
Strong leadership helps projects succeed more than good PERT charts
Project managers
 Функции планирования и контроля
 Виды корпоративных культур в сравнительном менеджменте
 Конкурентоспособность предприятия. (Лекция 2)
 Управление энергетическими ресурсами. Энергетический менеджмент
 Организация ремонтного хозяйства
 Логистика складирования. Место склада в логистической системе
 Теория мотивации. Урок № 10
 Корпоративное управление в образовании
 Корпоративный кодекс ГК Вектор
 Типология управленческих решений
 Управление процессом создания и освоения новых столярных изделий на примере ООО ЗЗСИ КРОНА
 Бармен: функции, внешний вид
 Система безопасности в гостиничном бизнесе
 ООО МАЯК ТК. Организация автомобильных грузоперевозок по России, Иркутской области и городу Иркутску
 How to overcome barriers?
 Кейс-метод при отборе персонала
 SWOT-талдау
 Национальные модели менеджмента. Лекция 4
 Набор и отбор персонала
 Управление реализацией проекта
 Эволюция управленческой мысли. Тема 2
 Основы организации пассажирских перевозок. Оценка качества пассажирских перевозок
 Общая характеристика логистики
 Введение в менеджмент
 Проектный семинар: компания и потребитель
 Дизайн-мышление
 Философия управления персоналом
 Тайм-менджмент