- Deutsches Elektronen Synchrotron DESY. Halo Monitoring

Содержание
- 2. Outline Halo diagnostic: What is Halo? Halo Quantification Halo Measurements Some examples
- 3. What is Halo? “It is very difficult to give a simple definition of the “halo”. It
- 4. From the diagnostics point of view, one thing is certainly clear – by definition halo is
- 5. That’s not a halo, that’s a tail! Dynamic range What is Halo?
- 6. Sources of halo are: space charge forces of the beam Mismatch of beam with accel. optics
- 7. Outline Halo diagnostic: What is Halo? Halo Quantification Halo Measurements Some examples
- 8. It is important to have a definition of halo in 1D spatial projections for which experimental
- 9. From the Figure 2 we can see in the most locations the simulations can properly reproduce
- 10. There is no clearly defined separation between the halo and the main core of the beam.
- 11. 1) Kurtosis This method is based on analyzing the fourth moment of the beam profile. The
- 12. f(x) = A exp(-(x-x0)2/(2σ2)) In order to represent the core, a Gaussian fit is performed on
- 13. Fit the raw data to the function: f(x) = g(x) + l(x); where g(x) = N
- 14. HALO QUANTIFICATION 4. Ratio of halo to core: a) Define core-halo limit: The core-halo limit can
- 15. Outline Halo diagnostic: What is Halo? Halo Quantification Halo Measurements Some examples
- 16. The focus of the accelerator physicists is on designing and operating their machines to minimize this
- 17. Profile monitors like Wire, IPM, LPM, Laser Wire, … are typically not designed for halo measurements.
- 18. J-Parc RCS: Idea to use additional MCP arrangement with lower resolution but high gain for halo
- 19. Scraper data are spatially differentiated and averaged, Wire and scraper data are acquired with sufficient spatial
- 20. Wire Scanners at LEDA => + + -Y and + Y scrape signal and derivative. The
- 21. linear amplification and 105 dynamic range => 16-bit D/A converter As an alternative solution is to
- 22. Wire Scanners PMTs AND (Coincidence unit) Scaler Timer 1234 Wire position Normalize counts to time interval!
- 23. Huge dynamic range (108) by coincident counting: Wire Scanners at Jefferson Lab Talk Large Dynamic Range
- 24. 4 σ 2 σ Fast scan E=920 GeV/c p-e+ collisions Huge dynamic range by scanning +
- 25. Vibrating wire scanner 6 σ
- 26. Vibrating wire scanner HINS: M. Chung et al. IPAC13 J-PARC L3BT: K. Okabe et al, IPAC13
- 27. Halo scraping by collimators beam loss monitors x In a synchrotron one jaw will scrape both
- 28. Measurement (left) and simulation (right) of the horizontal beam tails for a beam energy of 80.5
- 29. W. Scandale IPAC11 Bent Crystals for Halo Collimation Talk
- 30. Concept The hollow electron beam collimator is a cylindrical, hollow, magnetically confined, possibly pulsed electron beam
- 31. DESIGN OF A PROTON-ELECTRON BEAM OVERLAP MONITOR FOR THE NEW RHIC ELECTRON LENS BASED ON DETECTING
- 32. Beam Gas Vertex monitor (BGV) Beam imaging with vertex reconstruction of beam gas interactions Reconstruct the
- 33. Ion chamber, SEM PROSCAN Direct measurement by inserting monitor or by an intercepting monitor. No absolute
- 34. Optical Methods
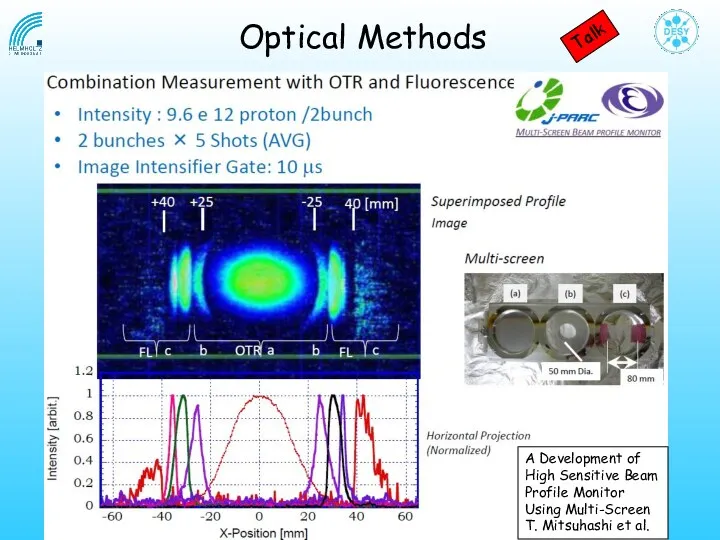
- 35. Optical Methods A Development of High Sensitive Beam Profile Monitor Using Multi-Screen T. Mitsuhashi et al.
- 36. NON-DESTRUCTIVE VERTICAL HALO MONITOR ON THE ESRF’S 6GeV ELECTRON BEAM B.K. Scheidt, IBIC2014 Optical Methods; X-Ray
- 37. CID Camera Subarray Control RoI Each pixel on the CID array is individually addressable and allows
- 38. C.P. Welsch et al, EPAC06 CID Camera
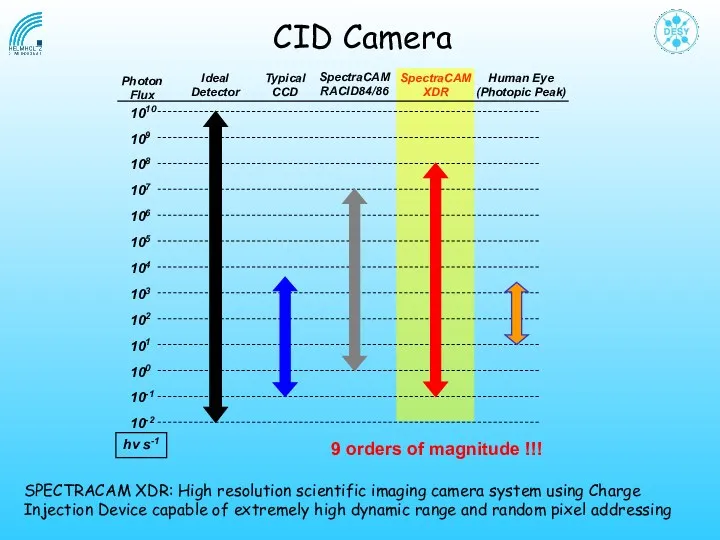
- 39. SPECTRACAM XDR: High resolution scientific imaging camera system using Charge Injection Device capable of extremely high
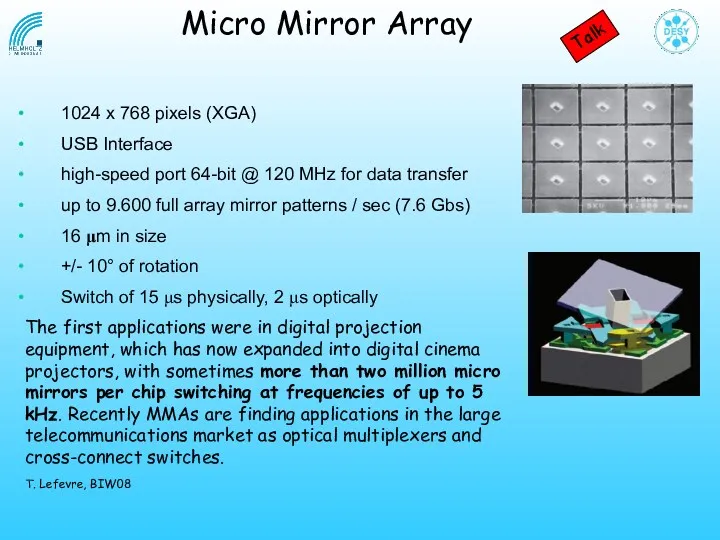
- 40. 1024 x 768 pixels (XGA) USB Interface high-speed port 64-bit @ 120 MHz for data transfer
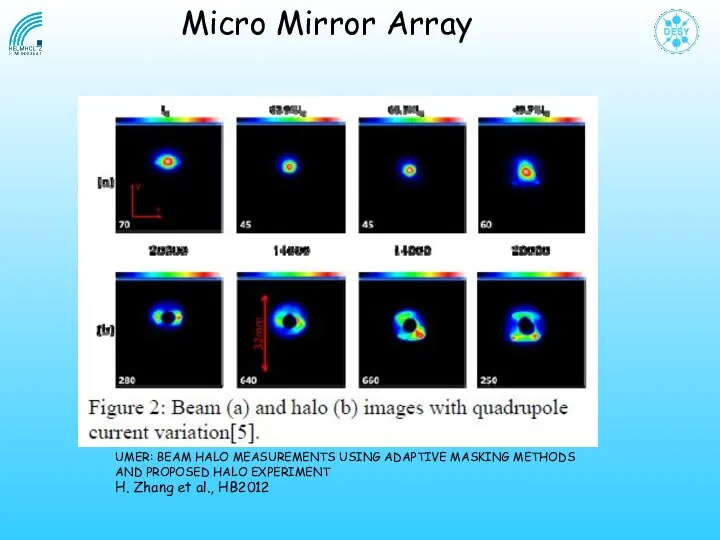
- 41. Micro Mirror Array UMER: BEAM HALO MEASUREMENTS USING ADAPTIVE MASKING METHODS AND PROPOSED HALO EXPERIMENT H.
- 42. Directional optical radiation (e.g. Synchrotron radiation or OTR) with small opening angles (≈ 1/γ) suffer from
- 43. A coronagraph is a telescopic attachment designed specifically to block out the direct light from a
- 44. 9/19/2014 The End of the Introduction
- 46. Скачать презентацию
Outline
Halo diagnostic:
What is Halo?
Halo Quantification
Halo Measurements
Some examples
Outline
Halo diagnostic:
What is Halo?
Halo Quantification
Halo Measurements
Some examples
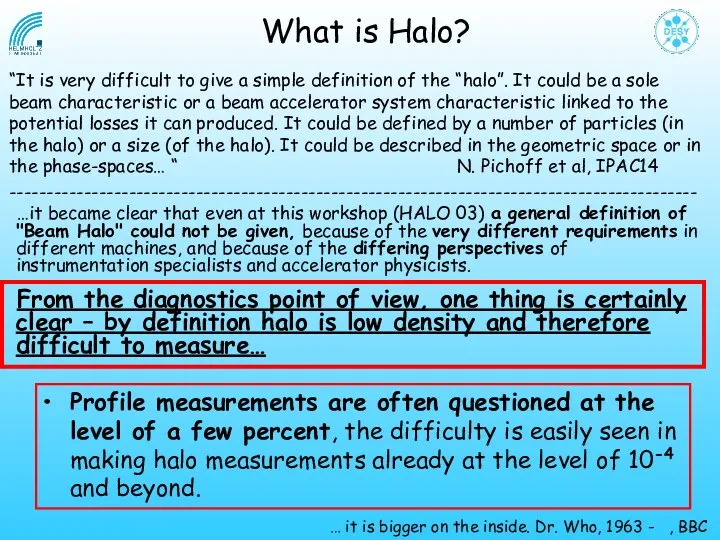
What is Halo?
“It is very difficult to give a simple definition
What is Halo?
“It is very difficult to give a simple definition
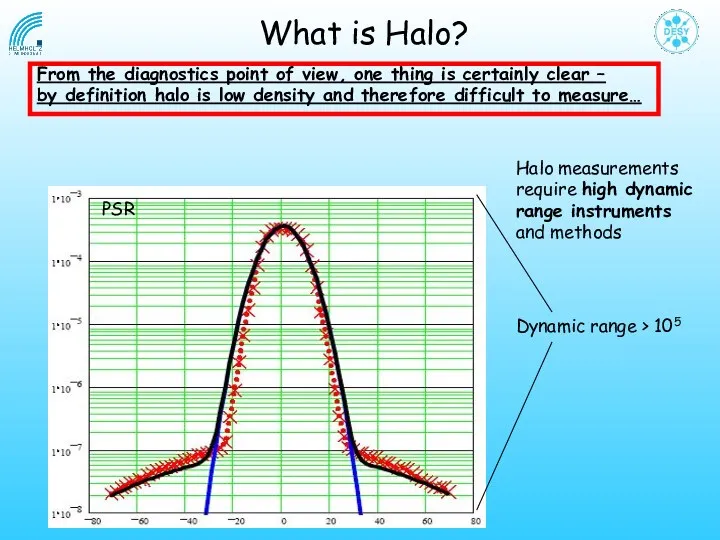
From the diagnostics point of view, one thing is certainly clear
From the diagnostics point of view, one thing is certainly clear
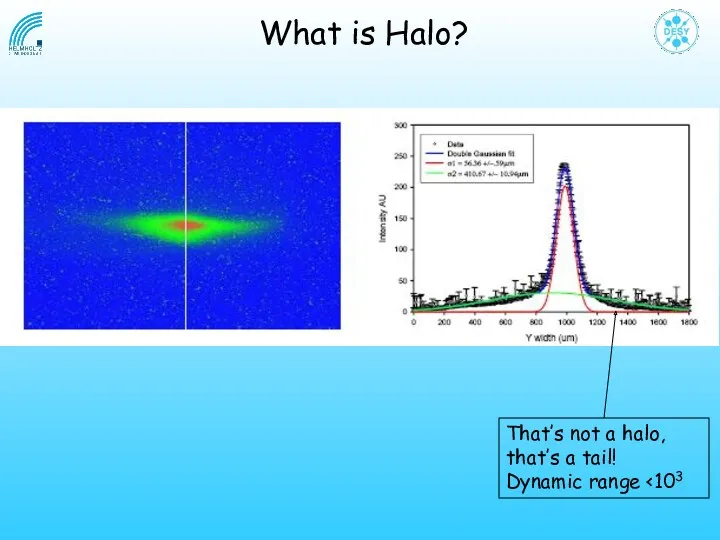
That’s not a halo,
that’s a tail!
Dynamic range <103
What is Halo?
That’s not a halo,
that’s a tail!
Dynamic range <103
What is Halo?
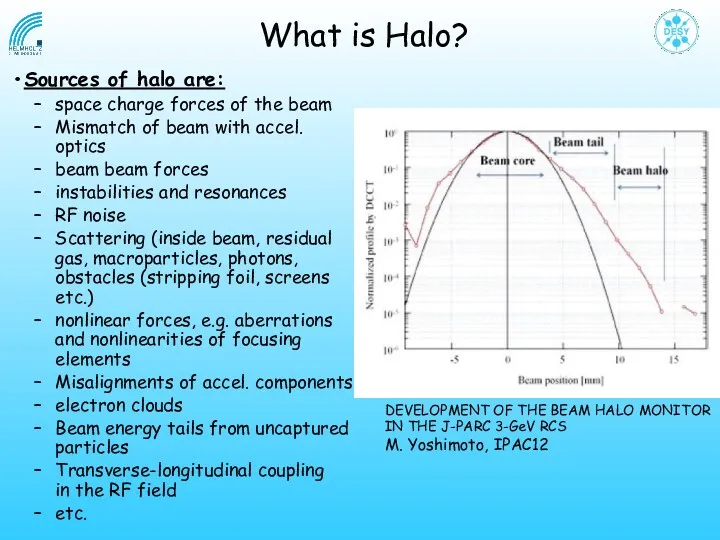
Sources of halo are:
space charge forces of the beam
Mismatch of beam
Sources of halo are:
space charge forces of the beam
Mismatch of beam
Outline
Halo diagnostic:
What is Halo?
Halo Quantification
Halo Measurements
Some examples
Outline
Halo diagnostic:
What is Halo?
Halo Quantification
Halo Measurements
Some examples
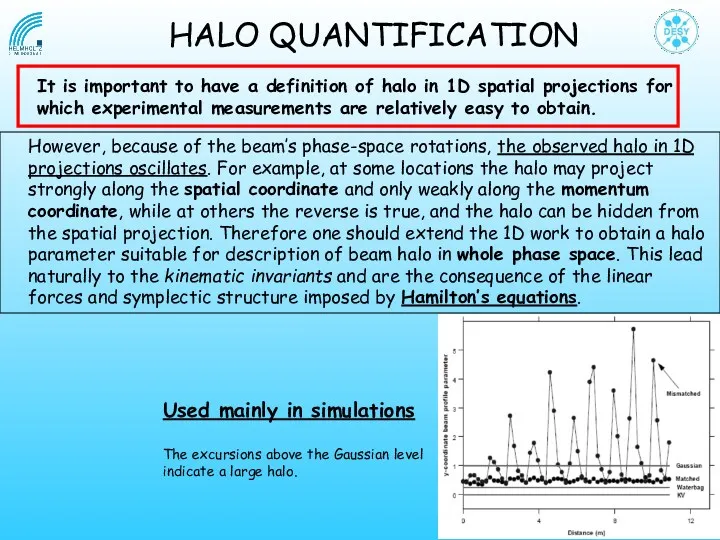
It is important to have a definition of halo in 1D
It is important to have a definition of halo in 1D
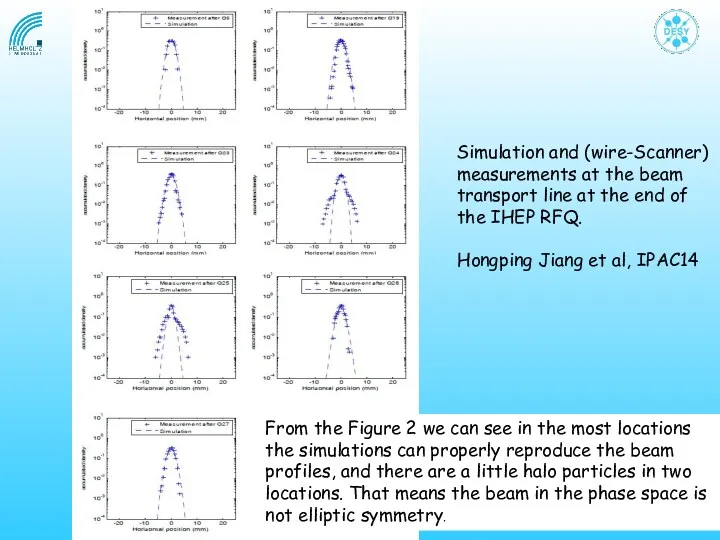
From the Figure 2 we can see in the most locations
the
From the Figure 2 we can see in the most locations
the
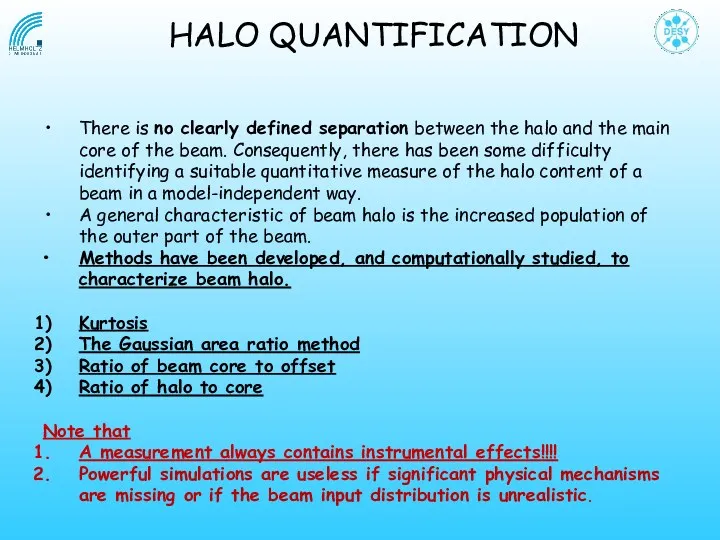
There is no clearly defined separation between the halo and the
There is no clearly defined separation between the halo and the
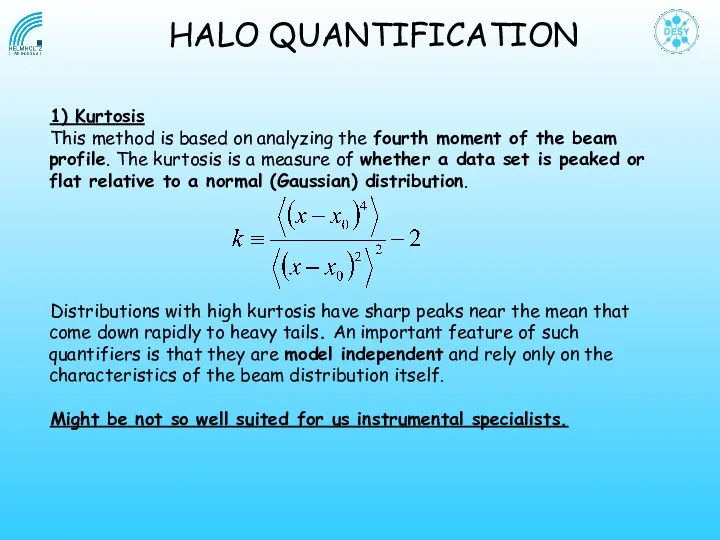
1) Kurtosis
This method is based on analyzing the fourth moment of
1) Kurtosis
This method is based on analyzing the fourth moment of
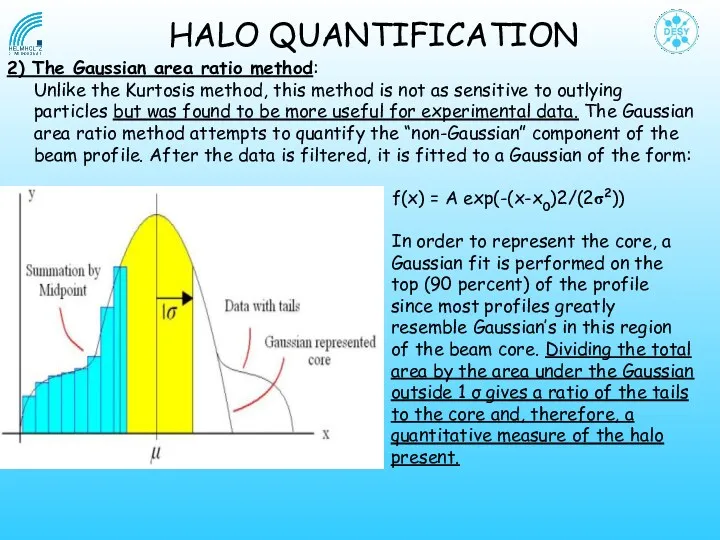
f(x) = A exp(-(x-x0)2/(2σ2))
In order to represent the core, a Gaussian
In order to represent the core, a Gaussian
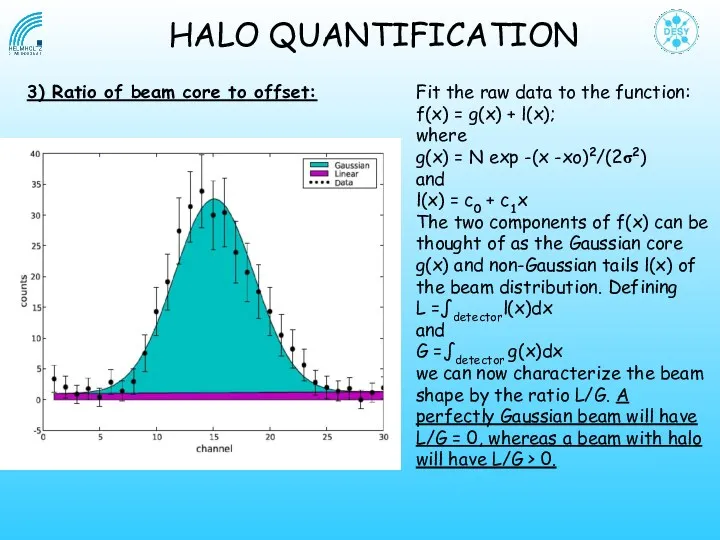
Fit the raw data to the function:
f(x) = g(x) + l(x);
where
g(x)
Fit the raw data to the function:
f(x) = g(x) + l(x);
where
g(x)
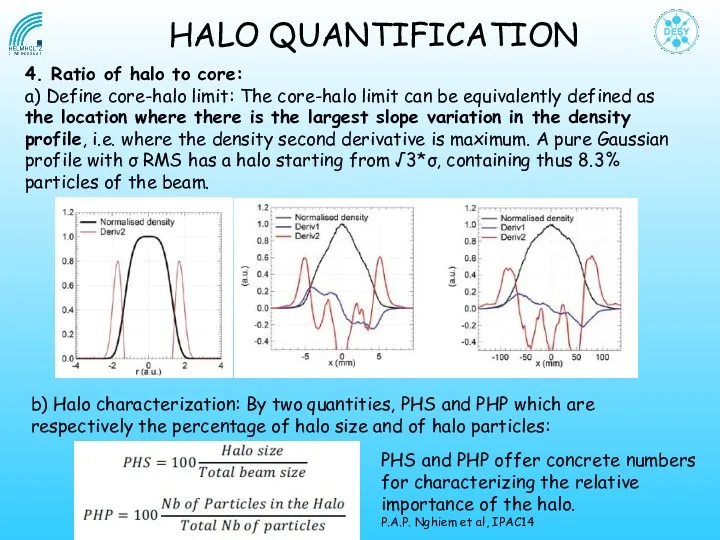
HALO QUANTIFICATION
4. Ratio of halo to core:
a) Define core-halo limit: The
HALO QUANTIFICATION
4. Ratio of halo to core:
a) Define core-halo limit: The
Outline
Halo diagnostic:
What is Halo?
Halo Quantification
Halo Measurements
Some examples
Outline
Halo diagnostic:
What is Halo?
Halo Quantification
Halo Measurements
Some examples
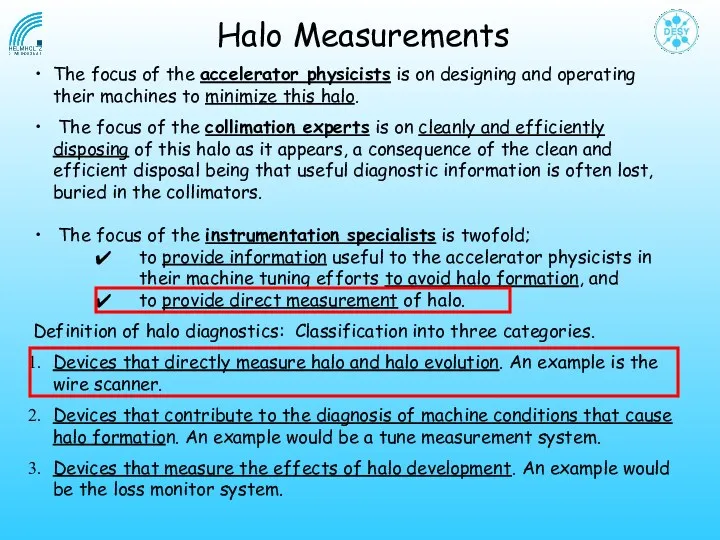
The focus of the accelerator physicists is on designing and operating
The focus of the accelerator physicists is on designing and operating
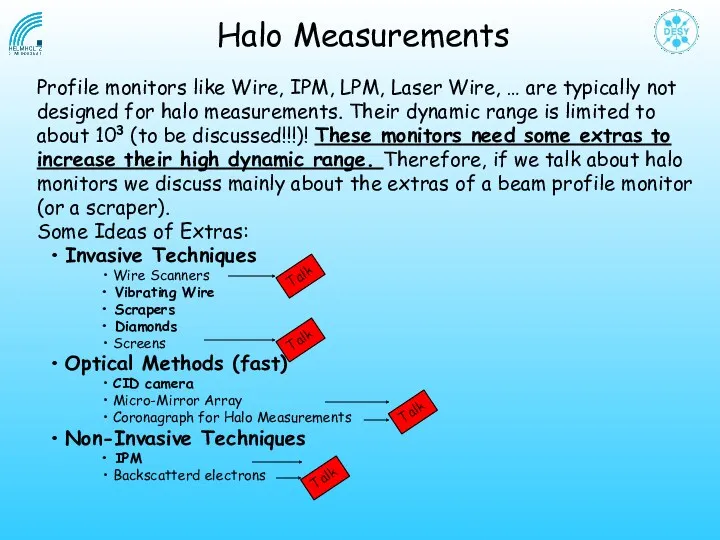
Profile monitors like Wire, IPM, LPM, Laser Wire, … are typically
Profile monitors like Wire, IPM, LPM, Laser Wire, … are typically
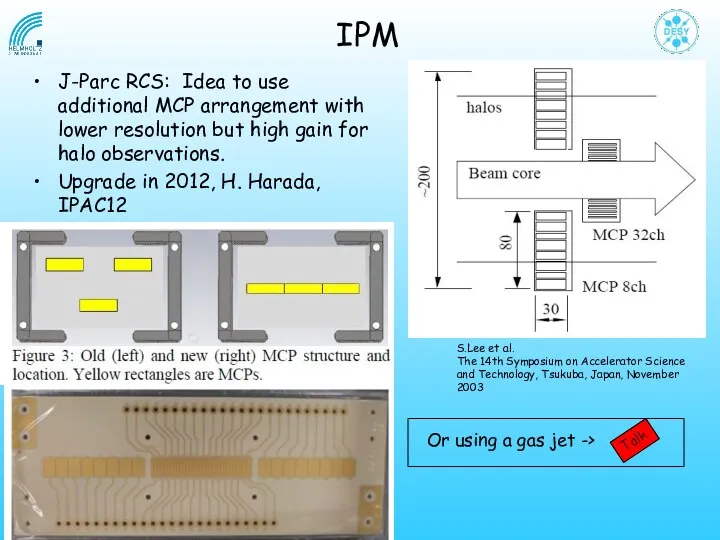
J-Parc RCS: Idea to use additional MCP arrangement with lower resolution
J-Parc RCS: Idea to use additional MCP arrangement with lower resolution
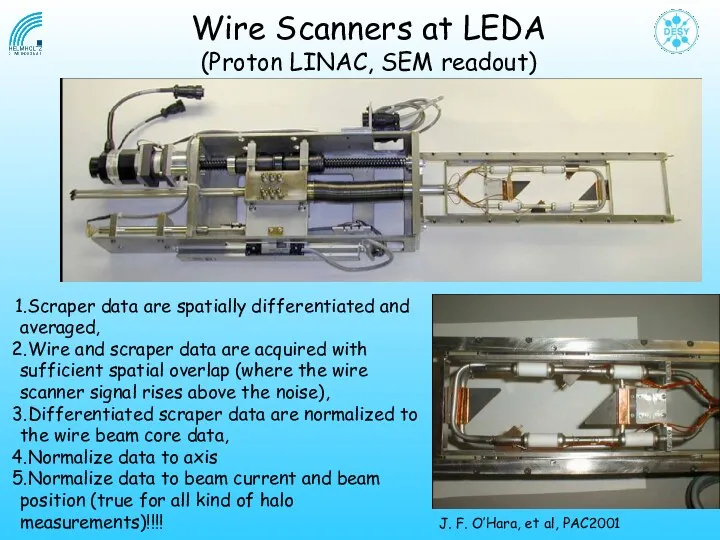
Scraper data are spatially differentiated and averaged,
Wire and scraper data are
Scraper data are spatially differentiated and averaged,
Wire and scraper data are
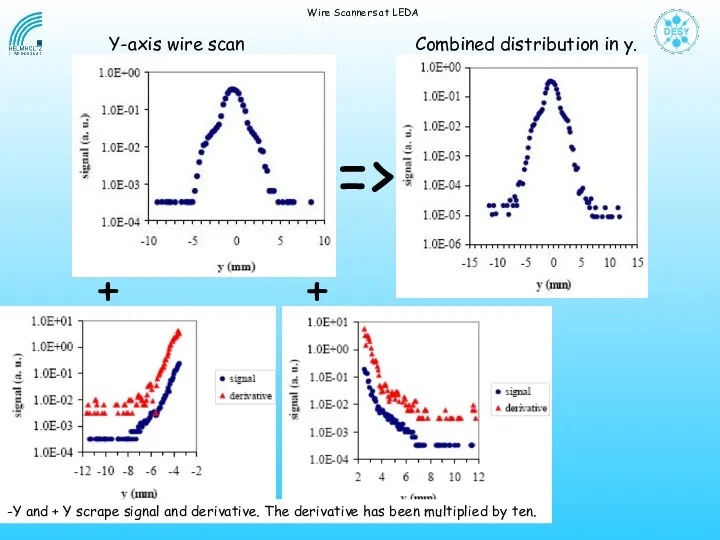
Wire Scanners at LEDA
=>
+ +
-Y and + Y scrape signal and
Wire Scanners at LEDA
=>
+ +
-Y and + Y scrape signal and
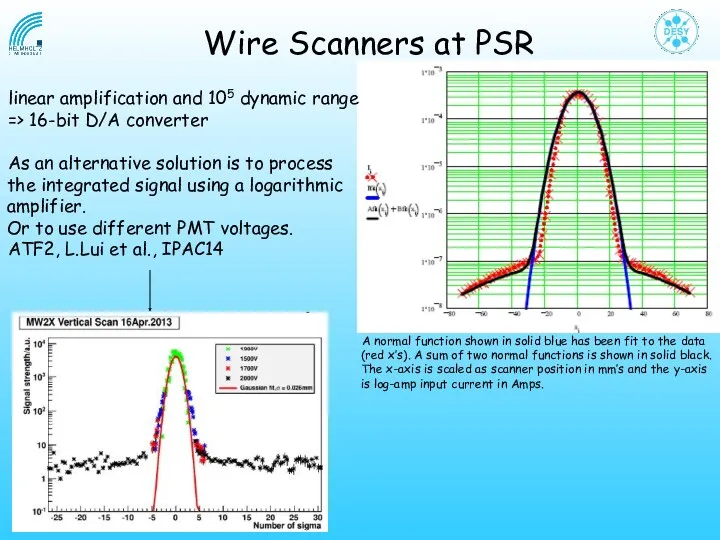
linear amplification and 105 dynamic range
=> 16-bit D/A converter
As an
linear amplification and 105 dynamic range
=> 16-bit D/A converter
As an
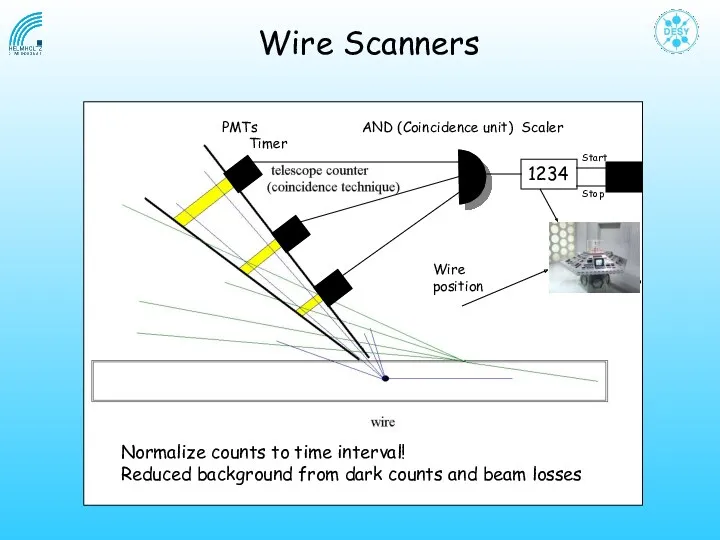
Wire Scanners
PMTs AND (Coincidence unit) Scaler Timer
1234
Wire
position
Normalize counts to time interval!
Reduced
Wire Scanners
PMTs AND (Coincidence unit) Scaler Timer
1234
Wire
position
Normalize counts to time interval!
Reduced
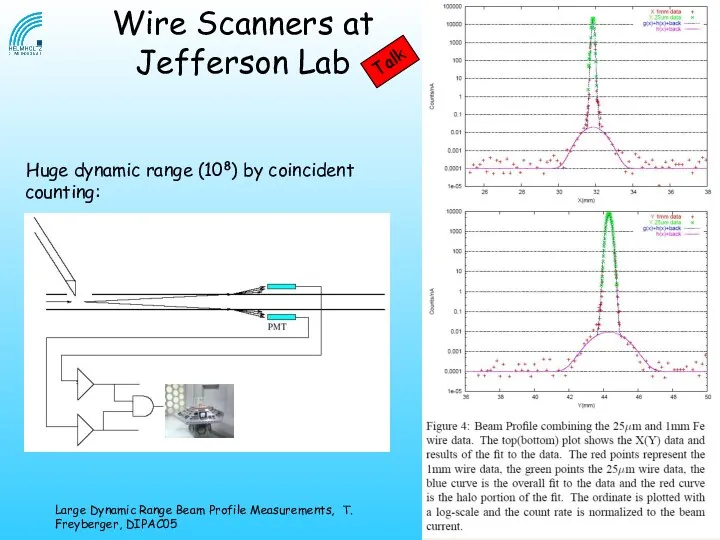
Huge dynamic range (108) by coincident counting:
Wire Scanners at Jefferson
Huge dynamic range (108) by coincident counting:
Wire Scanners at Jefferson
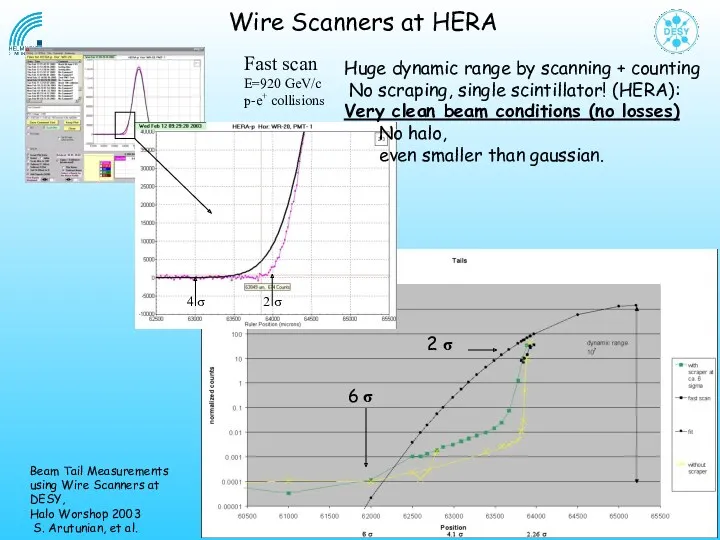
4 σ 2 σ
Fast scan
E=920 GeV/c
p-e+ collisions
Huge dynamic range by
4 σ 2 σ
Fast scan
E=920 GeV/c
p-e+ collisions
Huge dynamic range by
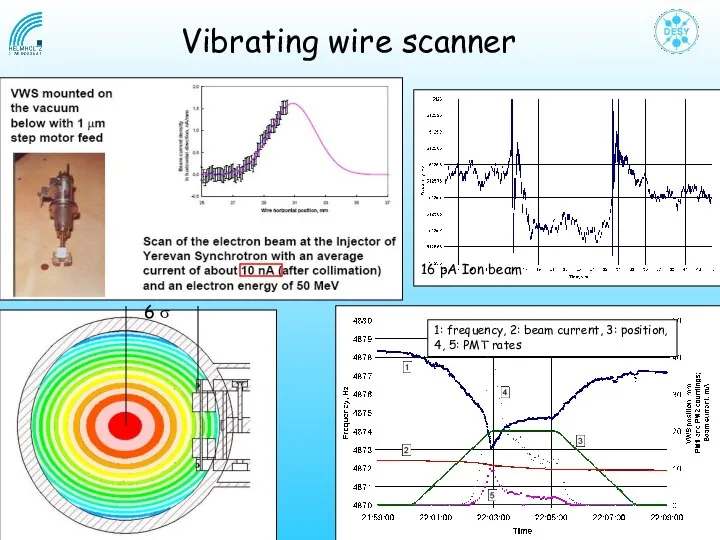
Vibrating wire scanner
6 σ
Vibrating wire scanner
6 σ
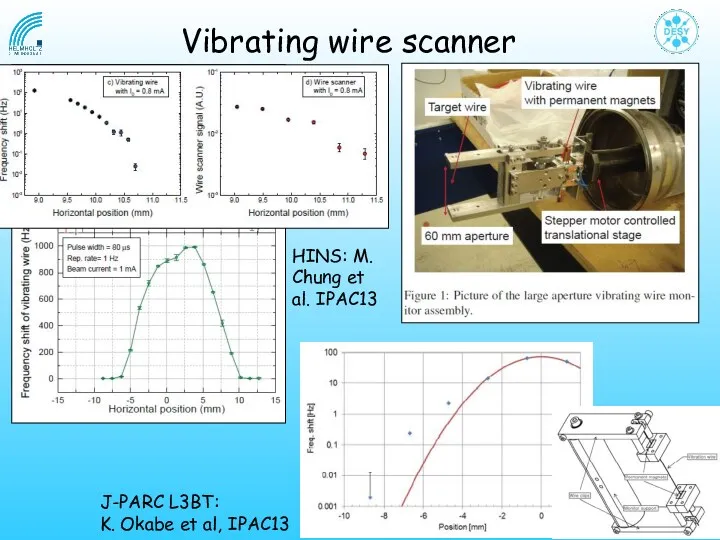
Vibrating wire scanner
HINS: M. Chung et al. IPAC13
J-PARC L3BT:
K. Okabe
Vibrating wire scanner
HINS: M. Chung et al. IPAC13
J-PARC L3BT:
K. Okabe
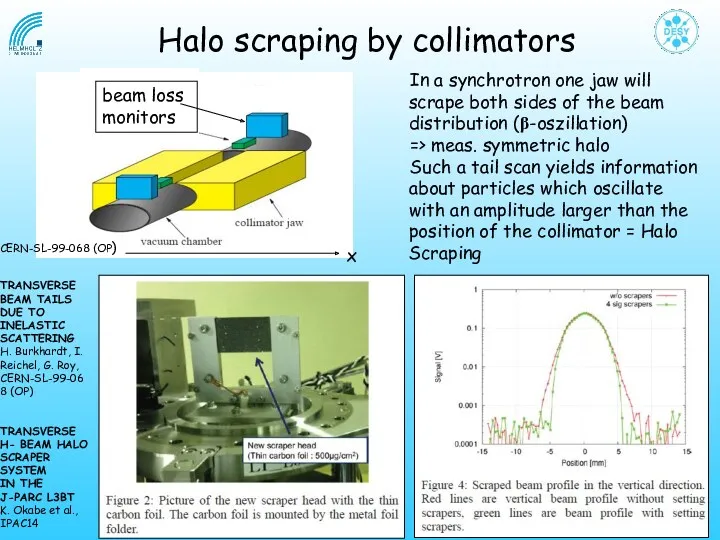
Halo scraping by collimators
beam loss
monitors
x
In a synchrotron one jaw will
Halo scraping by collimators
beam loss
monitors
x
In a synchrotron one jaw will
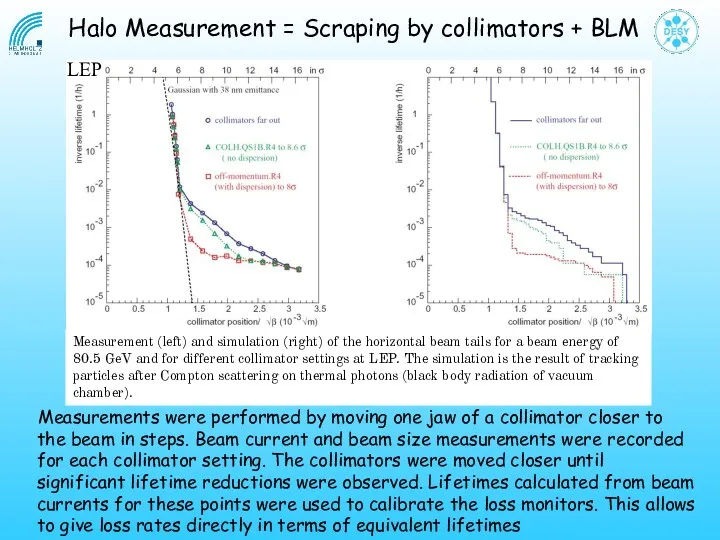
Measurement (left) and simulation (right) of the horizontal beam tails for
Measurement (left) and simulation (right) of the horizontal beam tails for
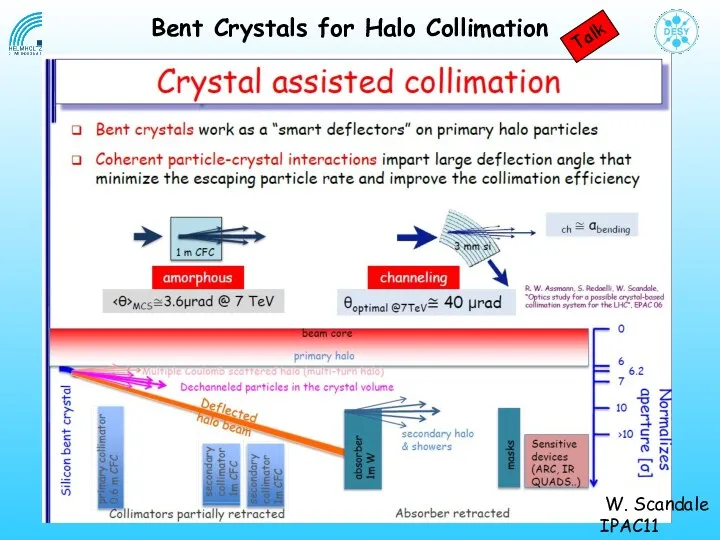
W. Scandale
IPAC11
Bent Crystals for Halo Collimation
Talk
W. Scandale
IPAC11
Bent Crystals for Halo Collimation
Talk
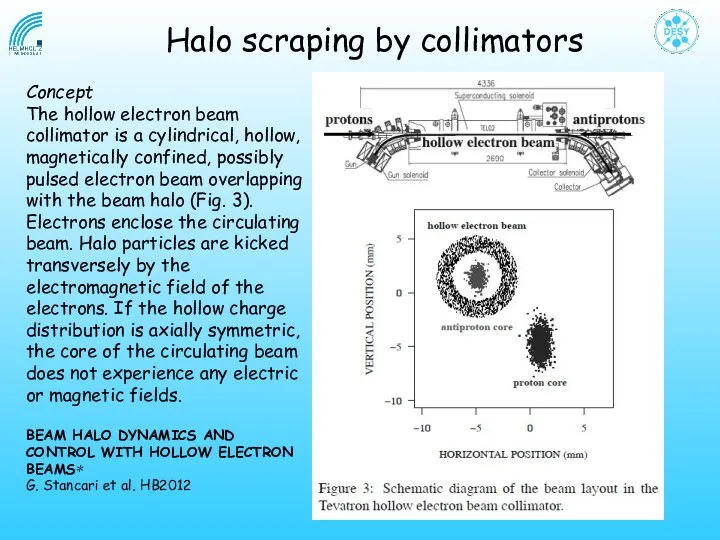
Concept
The hollow electron beam collimator is a cylindrical, hollow, magnetically confined,
Concept
The hollow electron beam collimator is a cylindrical, hollow, magnetically confined,
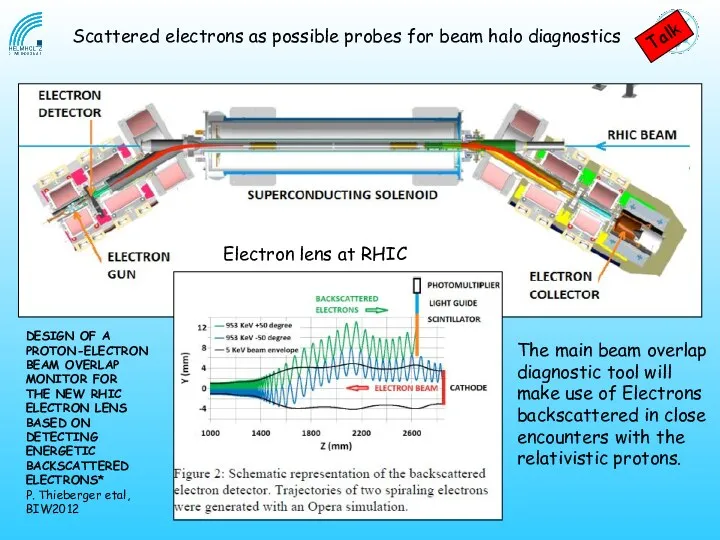
DESIGN OF A PROTON-ELECTRON BEAM OVERLAP MONITOR FOR
THE NEW RHIC ELECTRON
DESIGN OF A PROTON-ELECTRON BEAM OVERLAP MONITOR FOR
THE NEW RHIC ELECTRON
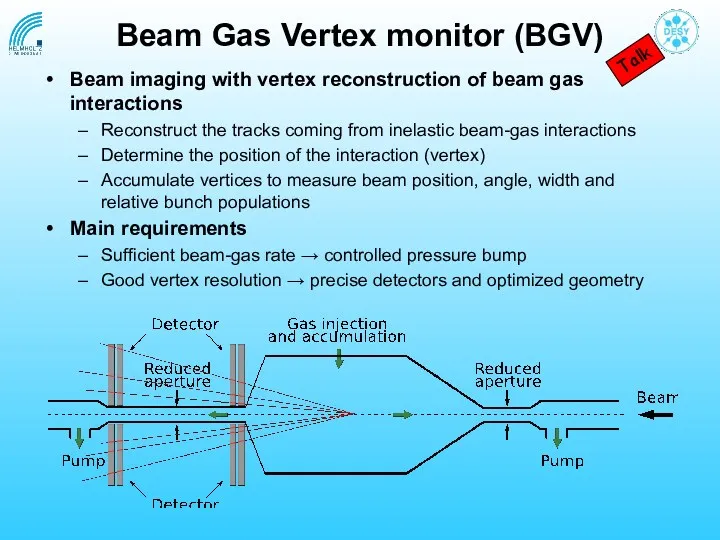
Beam Gas Vertex monitor (BGV)
Beam imaging with vertex reconstruction of beam
Beam Gas Vertex monitor (BGV)
Beam imaging with vertex reconstruction of beam
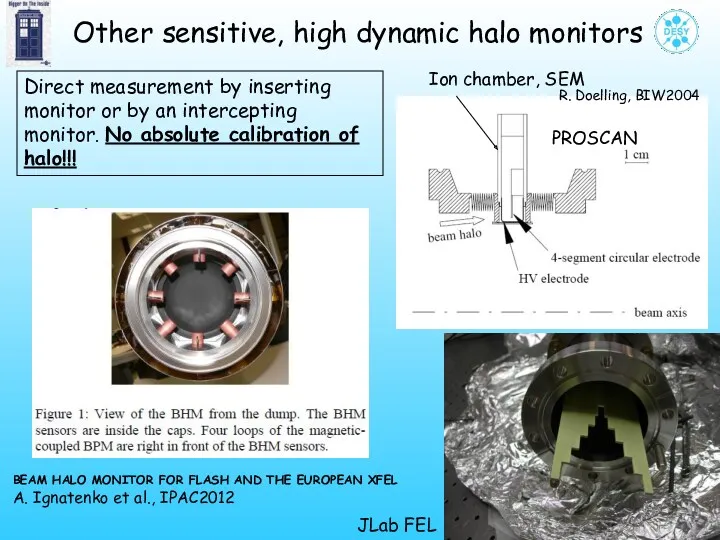
Ion chamber, SEM
PROSCAN
Direct measurement by inserting monitor or by an intercepting
Ion chamber, SEM
PROSCAN
Direct measurement by inserting monitor or by an intercepting
Optical Methods
Optical Methods
Optical Methods
A Development of High Sensitive Beam Profile Monitor Using Multi-Screen
Optical Methods
A Development of High Sensitive Beam Profile Monitor Using Multi-Screen
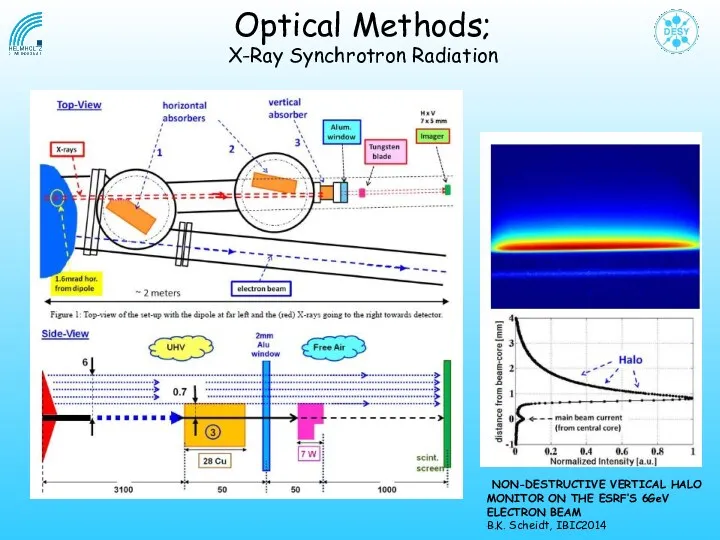
NON-DESTRUCTIVE VERTICAL HALO
MONITOR ON THE ESRF’S 6GeV
ELECTRON BEAM
NON-DESTRUCTIVE VERTICAL HALO
MONITOR ON THE ESRF’S 6GeV
ELECTRON BEAM
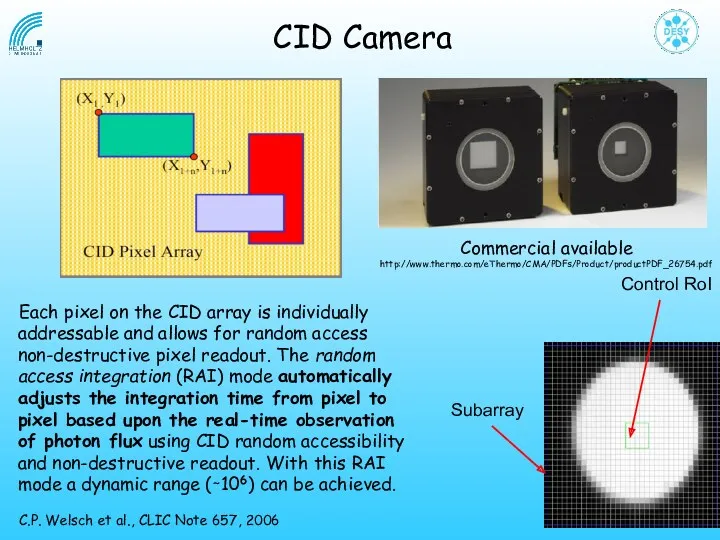
CID Camera
Subarray
Control RoI
Each pixel on the CID array is individually addressable
CID Camera
Subarray
Control RoI
Each pixel on the CID array is individually addressable
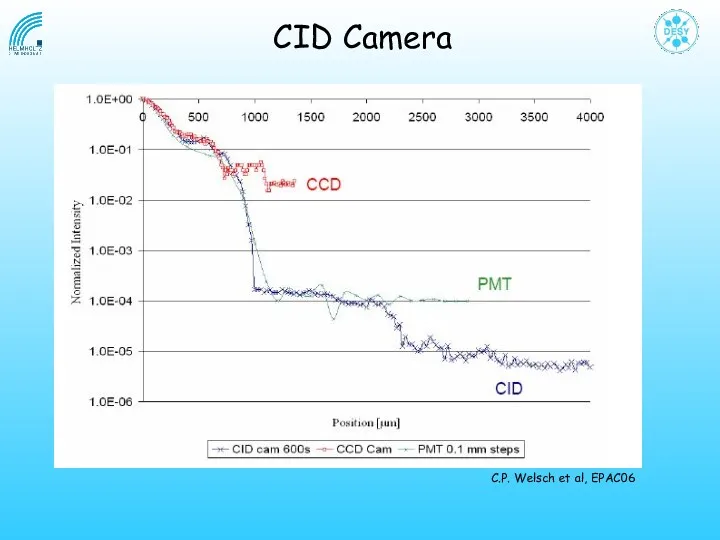
C.P. Welsch et al, EPAC06
CID Camera
C.P. Welsch et al, EPAC06
CID Camera
SPECTRACAM XDR: High resolution scientific imaging camera system using Charge Injection
SPECTRACAM XDR: High resolution scientific imaging camera system using Charge Injection
1024 x 768 pixels (XGA)
USB Interface
high-speed port 64-bit @ 120 MHz
USB Interface
high-speed port 64-bit @ 120 MHz
Micro Mirror Array
UMER: BEAM HALO MEASUREMENTS USING ADAPTIVE MASKING METHODS
AND PROPOSED
Micro Mirror Array
UMER: BEAM HALO MEASUREMENTS USING ADAPTIVE MASKING METHODS
AND PROPOSED
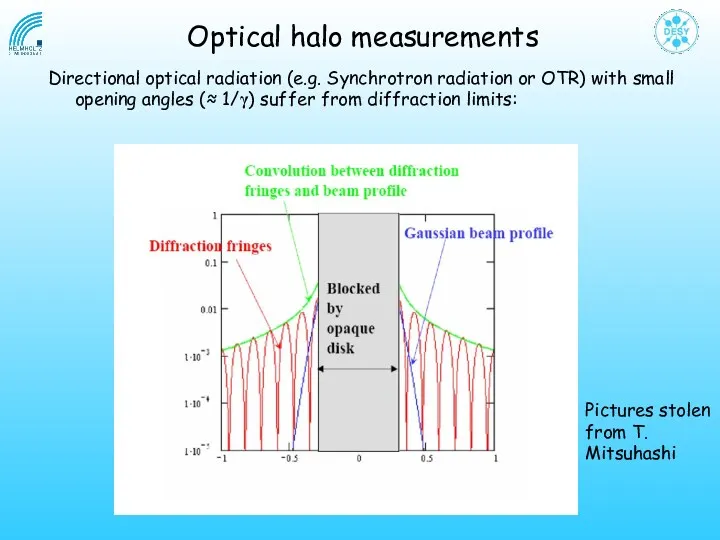
Directional optical radiation (e.g. Synchrotron radiation or OTR) with small opening
Directional optical radiation (e.g. Synchrotron radiation or OTR) with small opening
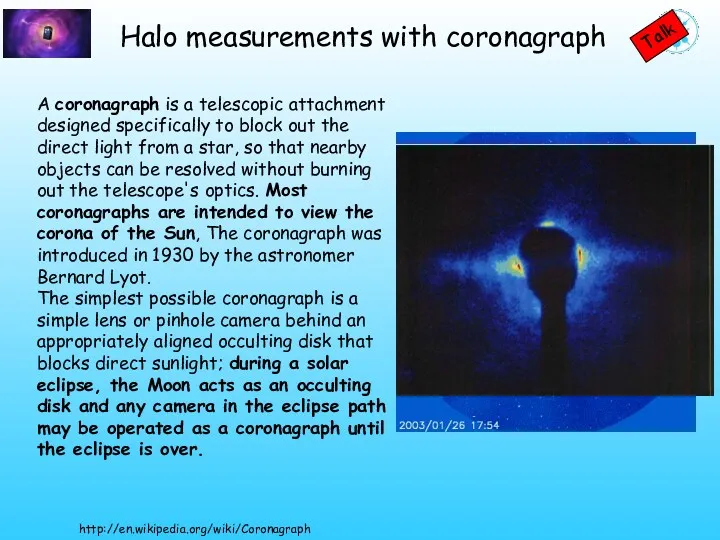
A coronagraph is a telescopic attachment designed specifically to block out
A coronagraph is a telescopic attachment designed specifically to block out
9/19/2014
The End
of the
Introduction
9/19/2014
The End
of the
Introduction
 Нравственные диллемы начальной школы
 Сосуды города
 А.В.Суворов- гений военного искусства.
 Почему мы играем в ЛЕГО
 Полевые транзисторы
 ГБПОУ НАТК. Портфолио. Профессиональный модуль ПМ. 04
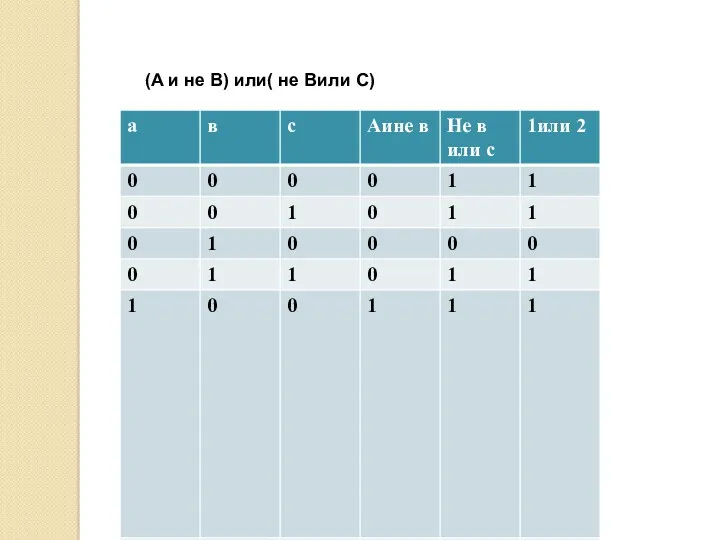 Триггеры, сумматоры
 Definitions of motivation
 Коррекция фонематической дислексии
 Организация профориентационной работы: опыт, проблемы, перспективы
 Тепломассообмен. Расчёт теплообменных аппаратов. (Лекция 14)
 Социальная сфера жизни общества
 Познавательное мероприятие для младших школьников Жизнь без опасности
 Материалы по внесению изменений в ПЗЗ в части технико-экономических показателей и ВРИ по объекту
 Оказание первой доврачебной помощи
 Подключение к Tele2. Тарифы и услуги
 Пародонтологиядағы иммунотерапия
 Тромбоцитопеническая пурпура (ТПП)
 Padezhi_imen_suschestvitelnykh
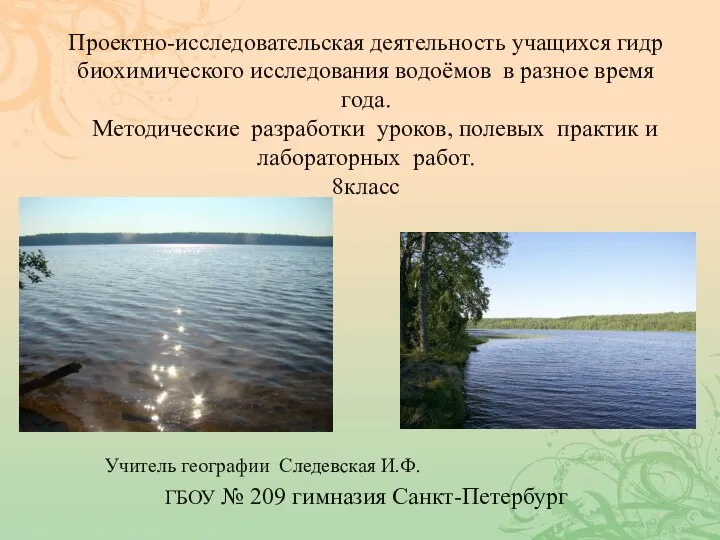 Методические разработки уроков, полевых практик и лабораторных работ. 8класс
 Психология рекламы
 Capitolul III. Logistica în amonte
 Мониторинг уровня сформированности у детей коммуникативных умений
 Ноотропы
 Учебный тренажёр и проверочный тест по теме: Члены предложения
 Презентация Детям о дне Победы
 Бурибаевская солнечная электростанция
 Структура образовательной деятельности (занятий) в соответствий с ФГОС в ДО