- Modern and efficient public transport system

Содержание
- 2. THE CONTEXT OF URBAN MOBILITY Urban sprawl Growing car ownership Increasing traffic congestion Improved energy/environmental technologies
- 3. CHANGING CITIZENS‘ EXPECTATIONS Demographic changes Changing urban rythms Changing citizens‘ behaviour and habits Growing concern for
- 4. THE VICIOUS CIRCLE OF URBAN DECLINE
- 5. WE MUST BREAK THE VICIOUS CIRCLE
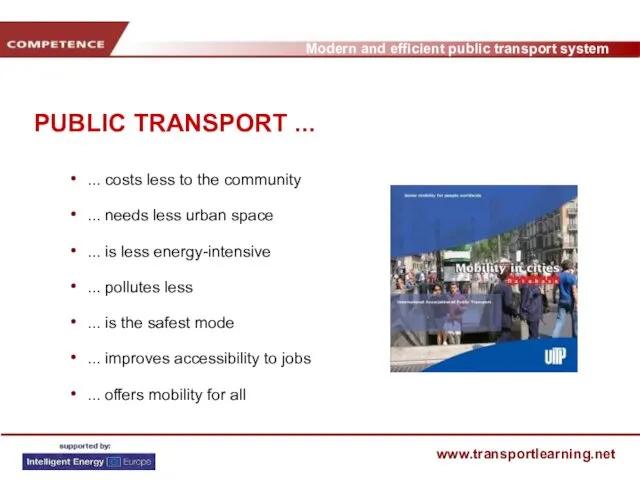
- 6. PUBLIC TRANSPORT ... ... costs less to the community ... needs less urban space ... is
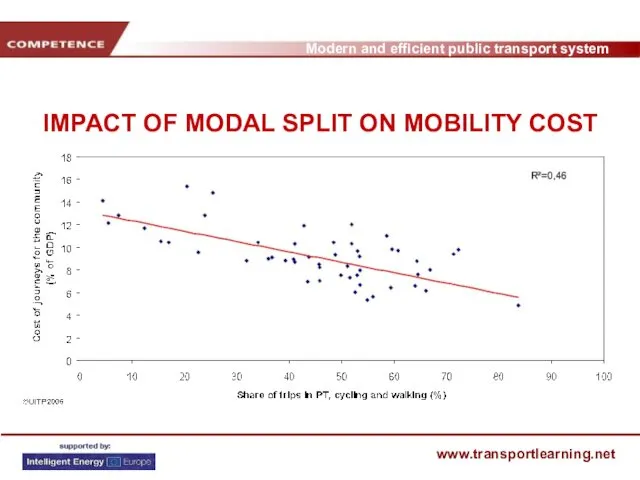
- 7. IMPACT OF MODAL SPLIT ON MOBILITY COST
- 8. IMPACT OF MODAL SPLIT ON MOBILITY COST AND ENERGY DEMAND
- 9. IMPACT OF MODAL SPLIT ON ACCESS TO JOBS
- 10. IMPACT OF MODAL SPLIT ON MOBILITY COST The cost of transport for the community in cities
- 11. IMPACT OF MODAL SPLIT ON ENERGY CONSUMPTION
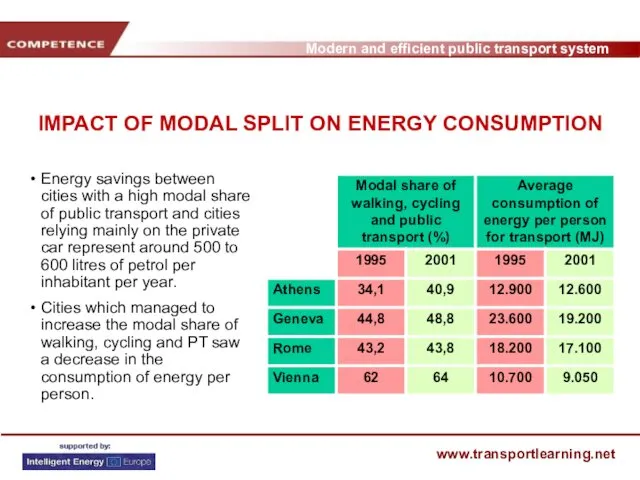
- 12. IMPACT OF MODAL SPLIT ON ENERGY CONSUMPTION Energy savings between cities with a high modal share
- 13. CARS TAKE UP PRECIOUS URBAN SPACE
- 14. THE THREE PILLARS OF AN INTEGRATED URBAN MOBILITY SYSTEM
- 15. PUBLIC TRANSPORT ORIENTED URBAN PLANNING Urban density is more cost-effective than urban sprawl Put and end
- 16. IMPACT OF URBAN DENSITY ON MOBILITY COSTS
- 17. IMPACT OF URBAN DENSITY ON ENERGY CONSUMPTION
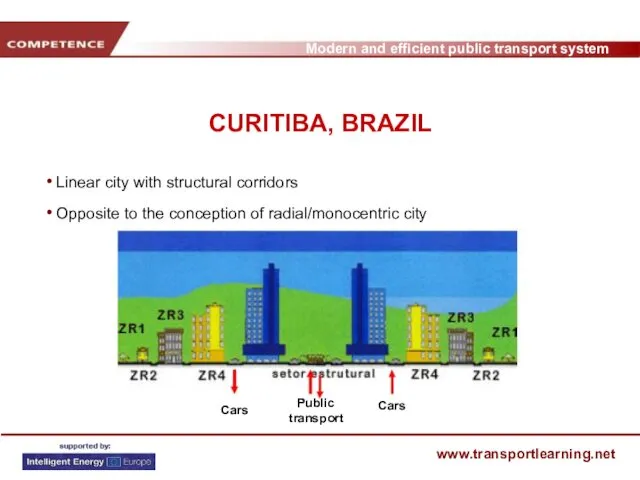
- 18. CURITIBA, BRAZIL Linear city with structural corridors Opposite to the conception of radial/monocentric city
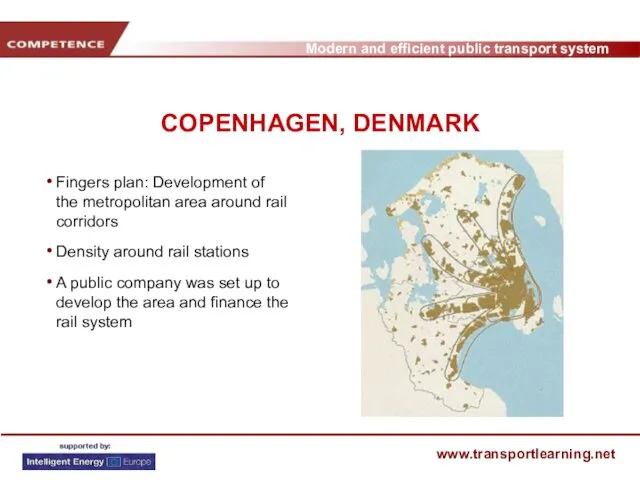
- 19. COPENHAGEN, DENMARK Fingers plan: Development of the metropolitan area around rail corridors Density around rail stations
- 20. CONTROL OF CAR TRAFFIC Congestion costs represent 2% of the EU GDP, i.e. 4 times what
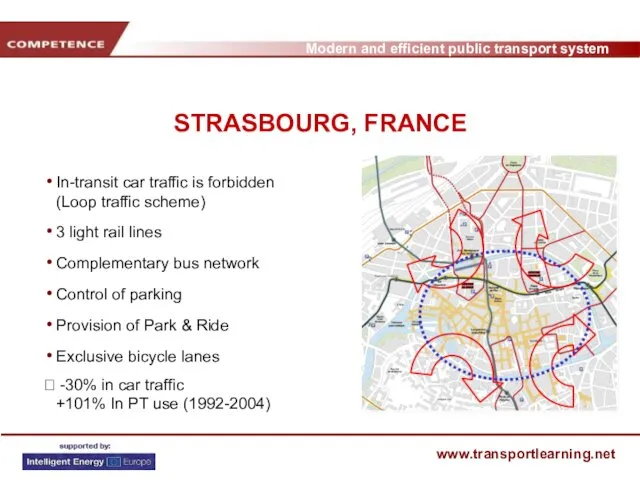
- 21. STRASBOURG, FRANCE In-transit car traffic is forbidden (Loop traffic scheme) 3 light rail lines Complementary bus
- 22. LONDON, UK Traffic delays reduced by 30% Number of cars reduced by 30% 50 to 60%
- 23. IMPACT OF PARKING PROVISION
- 24. PEDESTRIAN AREAS
- 25. QUALITY PUBLIC TRANSPORT SYSTEM Integration, at all levels, is a prerequisite of a modern and efficient
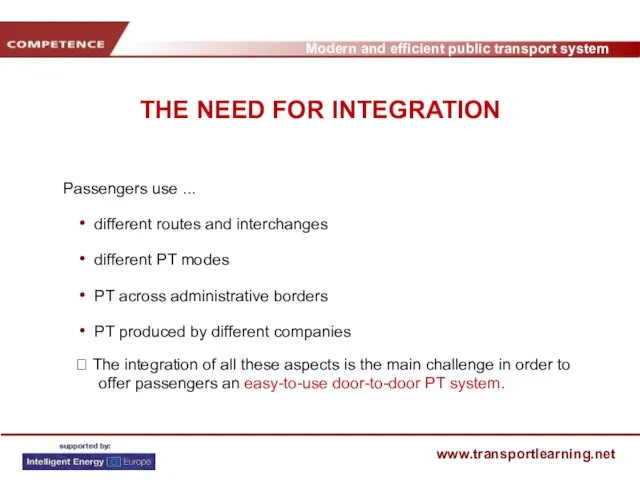
- 26. THE NEED FOR INTEGRATION Passengers use ... different routes and interchanges different PT modes PT across
- 27. PUBLIC TRANSPORT ORGANISATION Management
- 28. BUILDING SOLID AND FAIR PARTNERSHIP A strong institutional framework: The organising authority plays a decisive role
- 29. INTERCONNECTING NETWORKS AND MODES Adopting a network approach Reducing the number of unnecessary transfers Integrating timetables
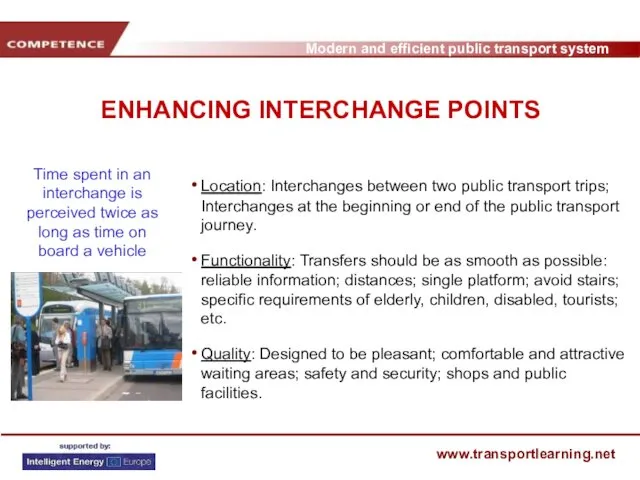
- 30. ENHANCING INTERCHANGE POINTS Location: Interchanges between two public transport trips; Interchanges at the beginning or end
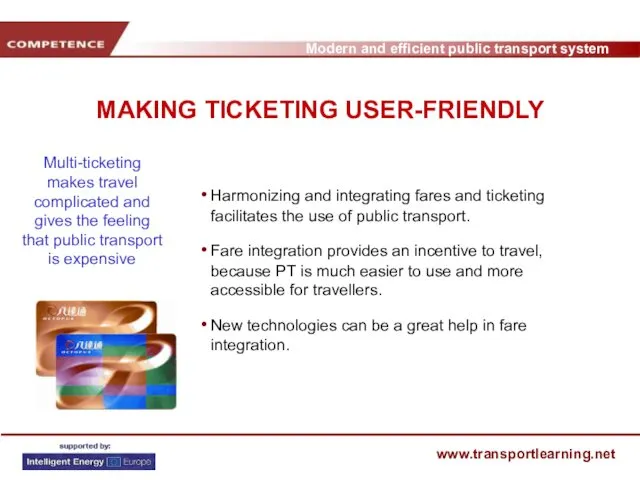
- 31. MAKING TICKETING USER-FRIENDLY Harmonizing and integrating fares and ticketing facilitates the use of public transport. Fare
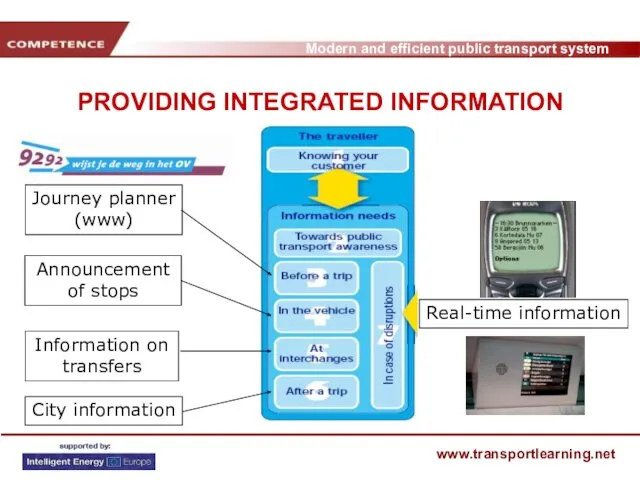
- 32. PROVIDING INTEGRATED INFORMATION
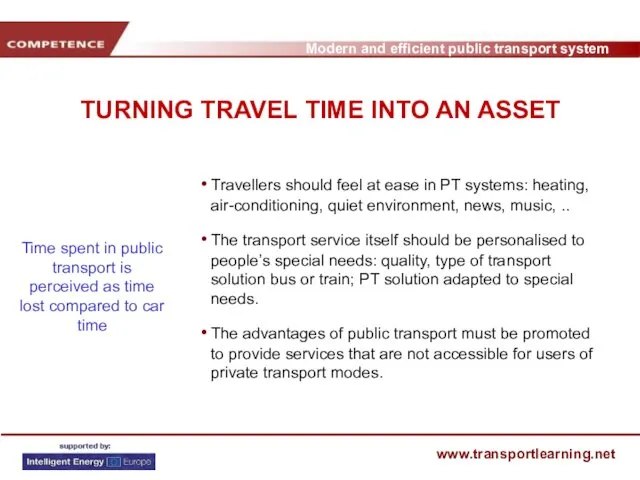
- 33. TURNING TRAVEL TIME INTO AN ASSET Travellers should feel at ease in PT systems: heating, air-conditioning,
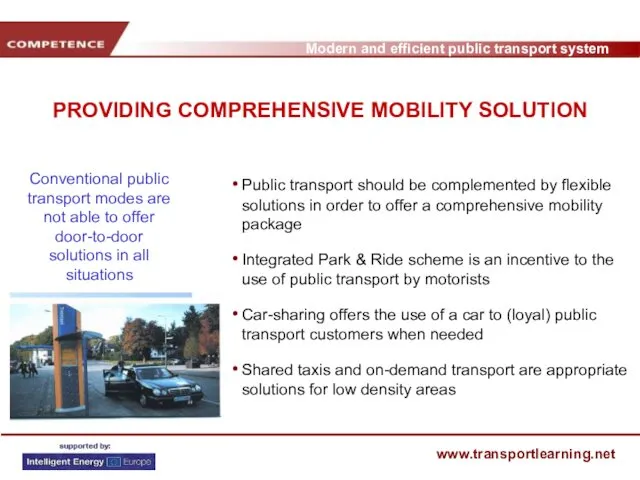
- 34. PROVIDING COMPREHENSIVE MOBILITY SOLUTION Public transport should be complemented by flexible solutions in order to offer
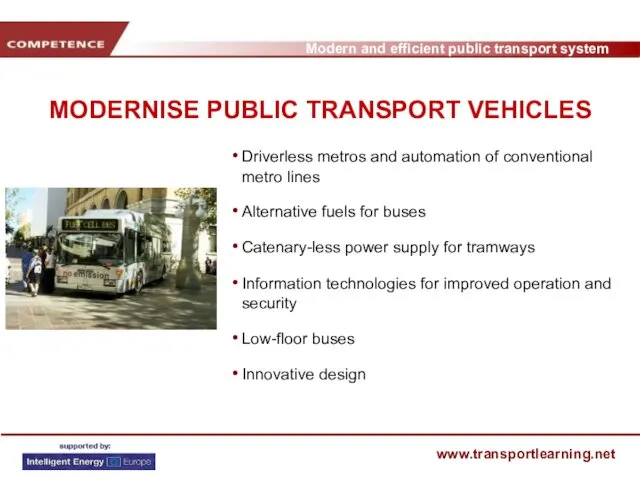
- 35. MODERNISE PUBLIC TRANSPORT VEHICLES Driverless metros and automation of conventional metro lines Alternative fuels for buses
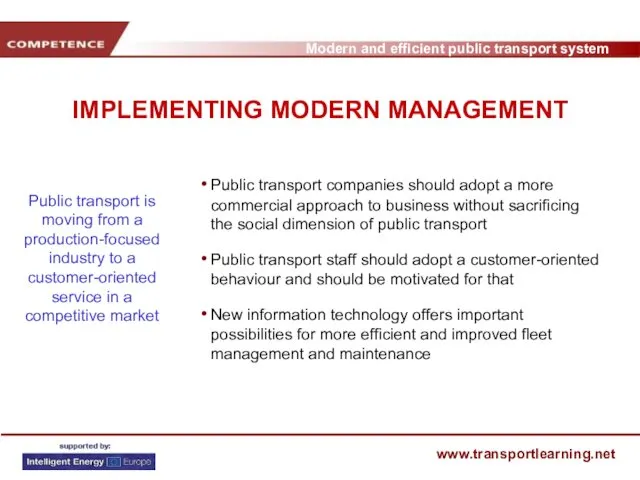
- 36. IMPLEMENTING MODERN MANAGEMENT Public transport companies should adopt a more commercial approach to business without sacrificing
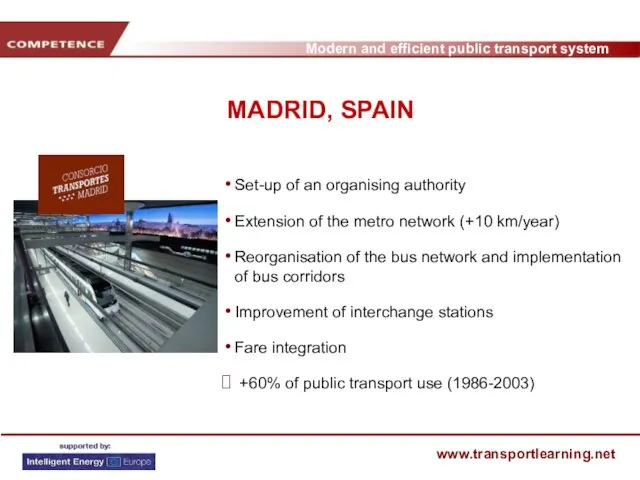
- 37. MADRID, SPAIN Set-up of an organising authority Extension of the metro network (+10 km/year) Reorganisation of
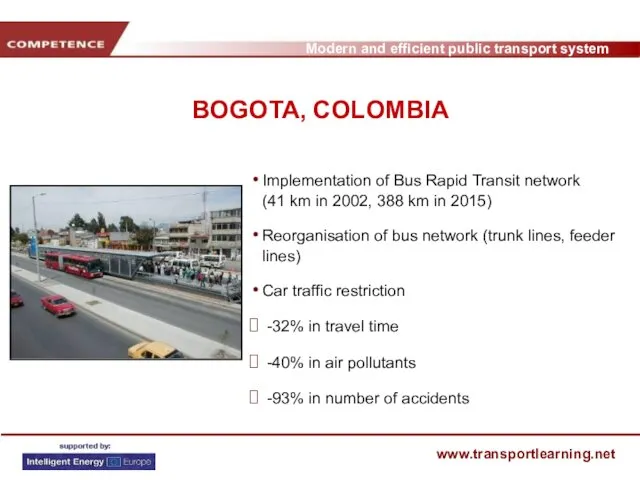
- 38. BOGOTA, COLOMBIA Implementation of Bus Rapid Transit network (41 km in 2002, 388 km in 2015)
- 39. DUBLIN, IRELAND Implementation of 100 km of bus corridors Provision of Park & Ride parking with
- 40. BRUSSELS, BELGIUM Increase of public transport supply Improved quality (new buses, frequency, night services) New tariff
- 41. SEOUL, SOUTH KOREA Implementation of Bus Rapid Transit system (84 km in 2005) Reorganisation of bus
- 42. HONG KONG Easy use of PT and increased attractiveness Speeding up access to train platforms (100
- 43. MARKETING AND BRANDING Retaining and attracting customers
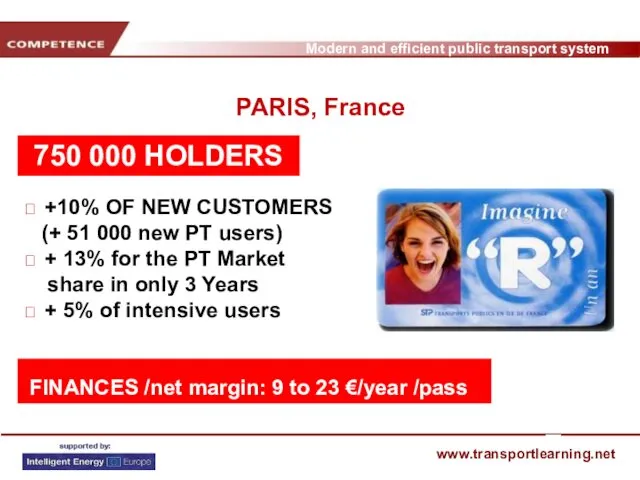
- 44. = ? +10% OF NEW CUSTOMERS (+ 51 000 new PT users) ? + 13% for
- 45. “Transport is not a technical, but a political issue. Technically and economically it is possible and
- 47. Скачать презентацию
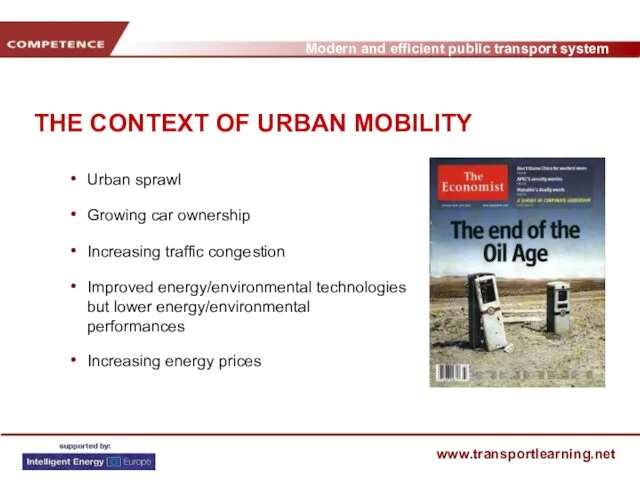
THE CONTEXT OF URBAN MOBILITY
Urban sprawl
Growing car ownership
Increasing traffic congestion
Improved energy/environmental
THE CONTEXT OF URBAN MOBILITY
Urban sprawl
Growing car ownership
Increasing traffic congestion
Improved energy/environmental
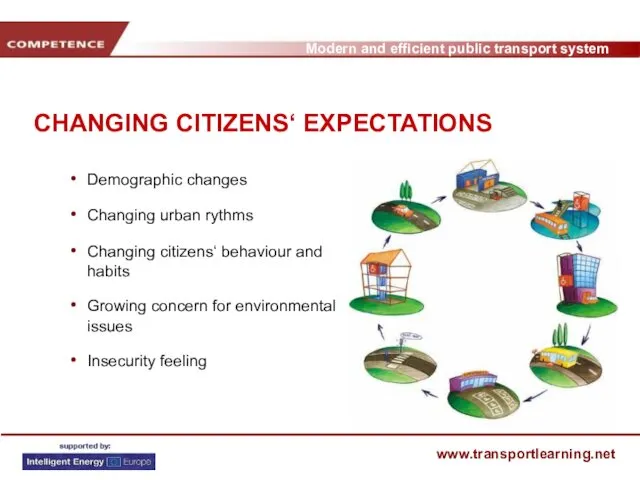
CHANGING CITIZENS‘ EXPECTATIONS
Demographic changes
Changing urban rythms
Changing citizens‘ behaviour and habits
Growing concern
CHANGING CITIZENS‘ EXPECTATIONS
Demographic changes
Changing urban rythms
Changing citizens‘ behaviour and habits
Growing concern
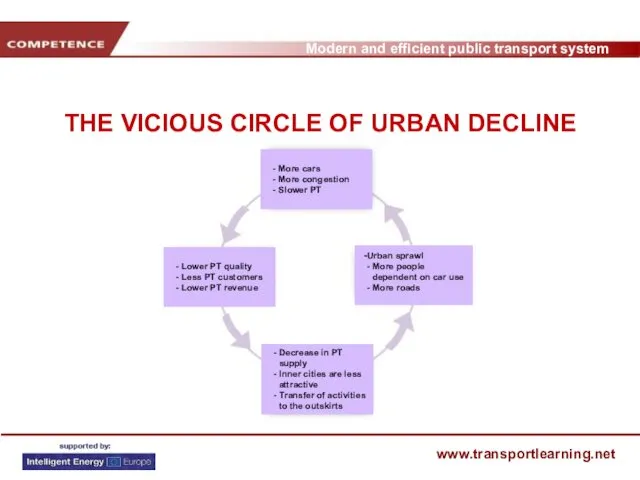
THE VICIOUS CIRCLE OF URBAN DECLINE
THE VICIOUS CIRCLE OF URBAN DECLINE
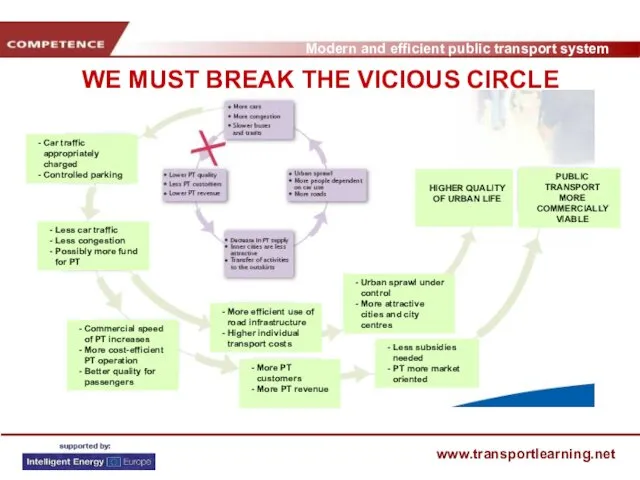
WE MUST BREAK THE VICIOUS CIRCLE
WE MUST BREAK THE VICIOUS CIRCLE
PUBLIC TRANSPORT ...
... costs less to the community
... needs less urban
PUBLIC TRANSPORT ...
... costs less to the community
... needs less urban
IMPACT OF MODAL SPLIT ON MOBILITY COST
IMPACT OF MODAL SPLIT ON MOBILITY COST
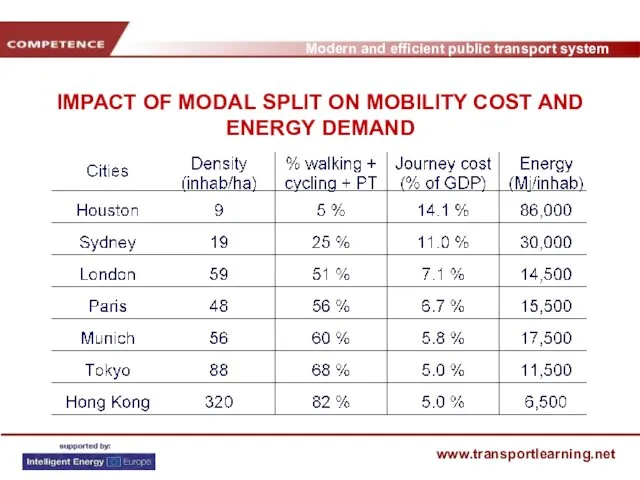
IMPACT OF MODAL SPLIT ON MOBILITY COST AND ENERGY DEMAND
IMPACT OF MODAL SPLIT ON MOBILITY COST AND ENERGY DEMAND
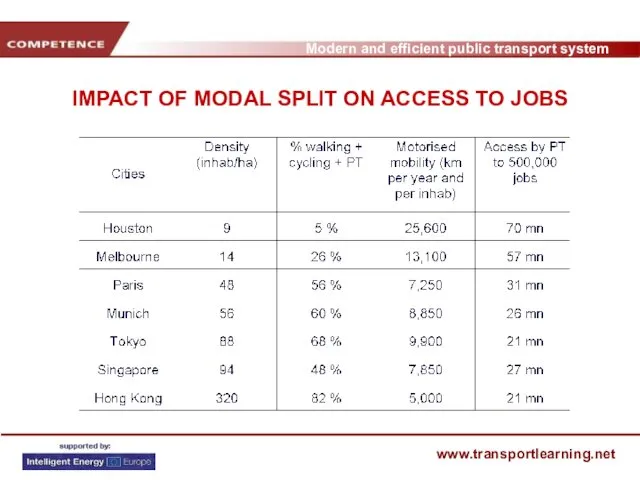
IMPACT OF MODAL SPLIT ON ACCESS TO JOBS
IMPACT OF MODAL SPLIT ON ACCESS TO JOBS
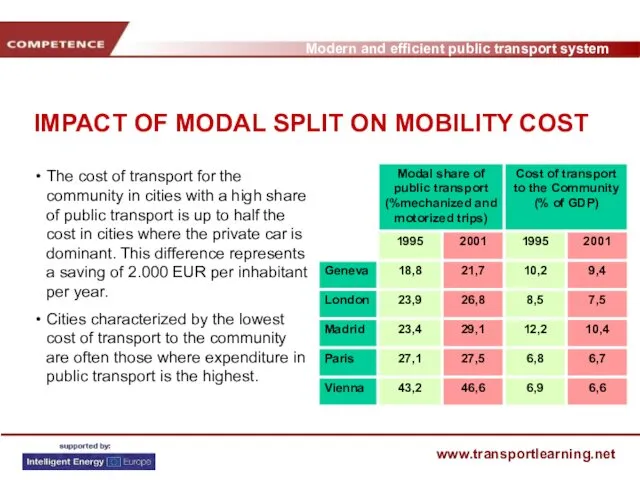
IMPACT OF MODAL SPLIT ON MOBILITY COST
The cost of transport for
IMPACT OF MODAL SPLIT ON MOBILITY COST
The cost of transport for
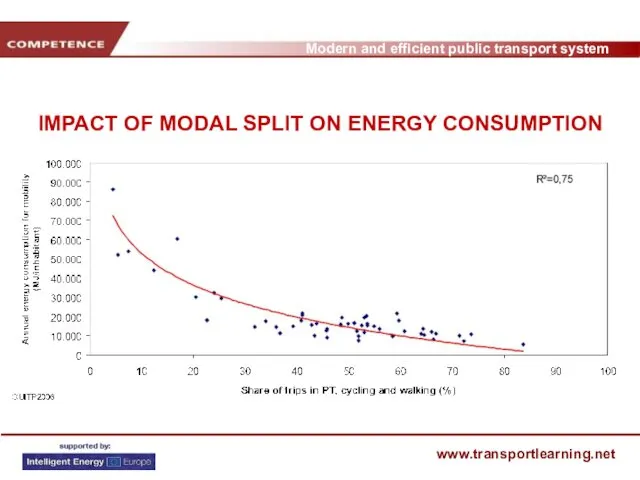
IMPACT OF MODAL SPLIT ON ENERGY CONSUMPTION
IMPACT OF MODAL SPLIT ON ENERGY CONSUMPTION
IMPACT OF MODAL SPLIT ON ENERGY CONSUMPTION
Energy savings between cities with
IMPACT OF MODAL SPLIT ON ENERGY CONSUMPTION
Energy savings between cities with
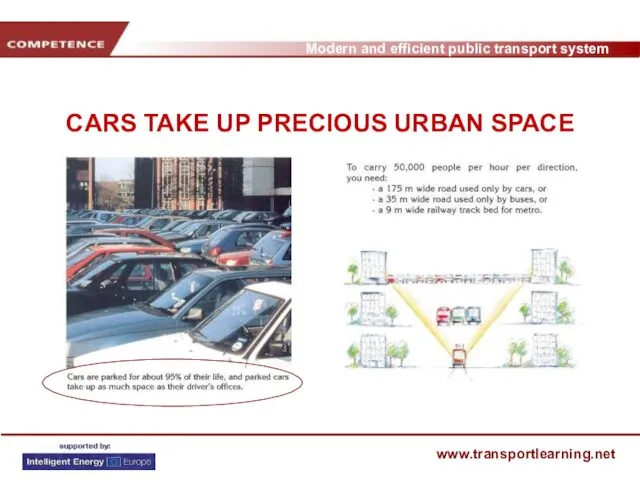
CARS TAKE UP PRECIOUS URBAN SPACE
CARS TAKE UP PRECIOUS URBAN SPACE
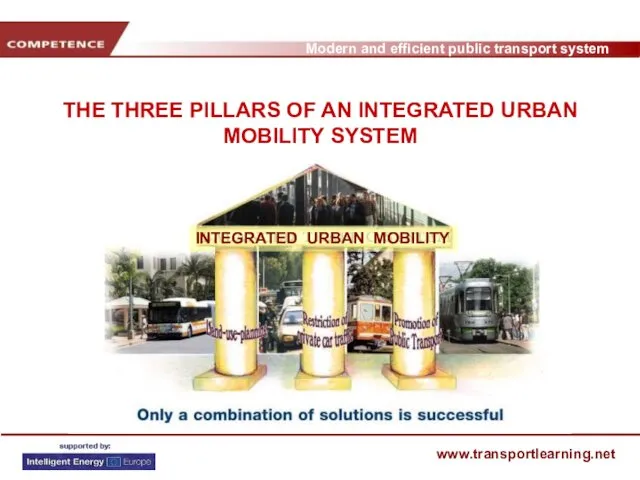
THE THREE PILLARS OF AN INTEGRATED URBAN MOBILITY SYSTEM
THE THREE PILLARS OF AN INTEGRATED URBAN MOBILITY SYSTEM
PUBLIC TRANSPORT ORIENTED URBAN PLANNING
Urban density is more cost-effective than urban
PUBLIC TRANSPORT ORIENTED URBAN PLANNING Urban density is more cost-effective than urban
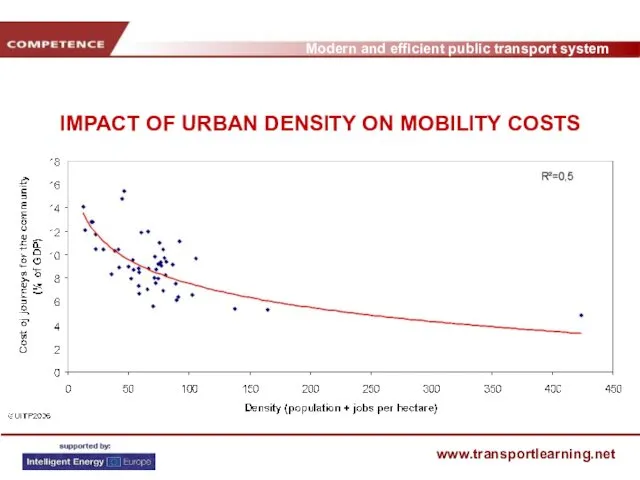
IMPACT OF URBAN DENSITY ON MOBILITY COSTS
IMPACT OF URBAN DENSITY ON MOBILITY COSTS
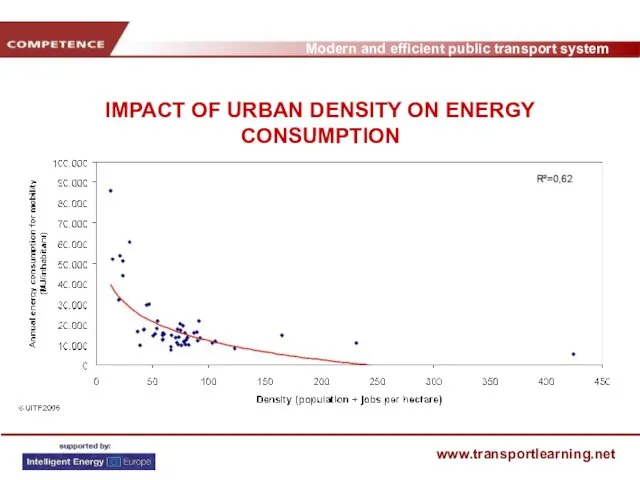
IMPACT OF URBAN DENSITY ON ENERGY CONSUMPTION
IMPACT OF URBAN DENSITY ON ENERGY CONSUMPTION
CURITIBA, BRAZIL
Linear city with structural corridors
Opposite to the conception of
CURITIBA, BRAZIL
Linear city with structural corridors
Opposite to the conception of
COPENHAGEN, DENMARK
Fingers plan: Development of the metropolitan area around rail
COPENHAGEN, DENMARK
Fingers plan: Development of the metropolitan area around rail
CONTROL OF CAR TRAFFIC
Congestion costs represent 2% of the EU GDP,
i.e.
CONTROL OF CAR TRAFFIC Congestion costs represent 2% of the EU GDP, i.e.
STRASBOURG, FRANCE
In-transit car traffic is forbidden (Loop traffic scheme)
3 light
STRASBOURG, FRANCE
In-transit car traffic is forbidden (Loop traffic scheme)
3 light
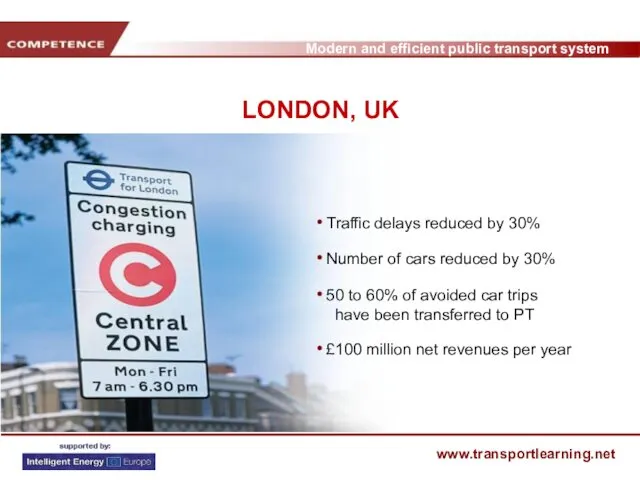
LONDON, UK
Traffic delays reduced by 30%
Number of cars reduced by
LONDON, UK
Traffic delays reduced by 30%
Number of cars reduced by
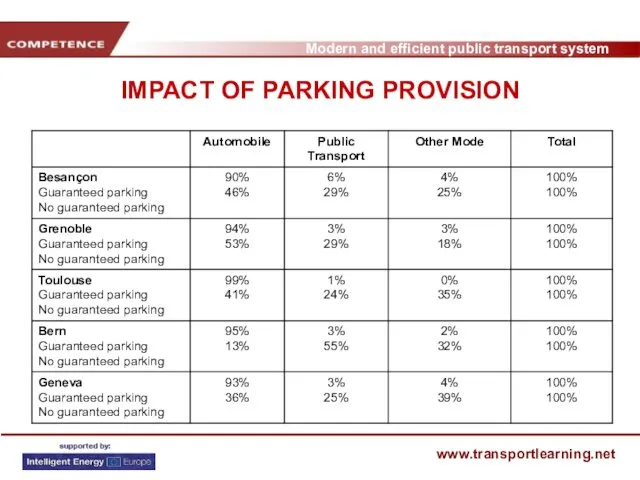
IMPACT OF PARKING PROVISION
IMPACT OF PARKING PROVISION
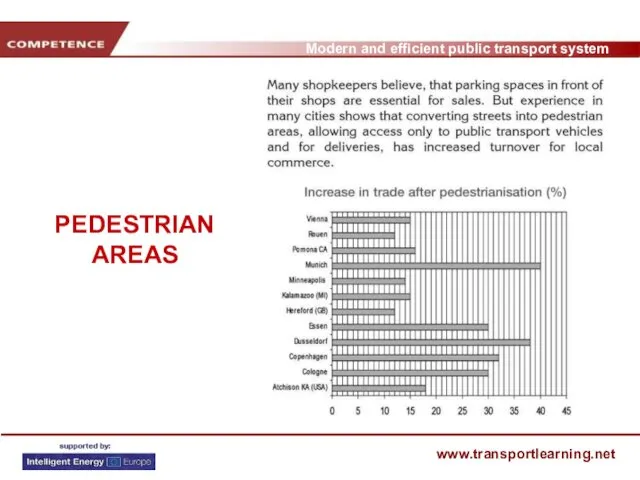
PEDESTRIAN
AREAS
PEDESTRIAN
AREAS
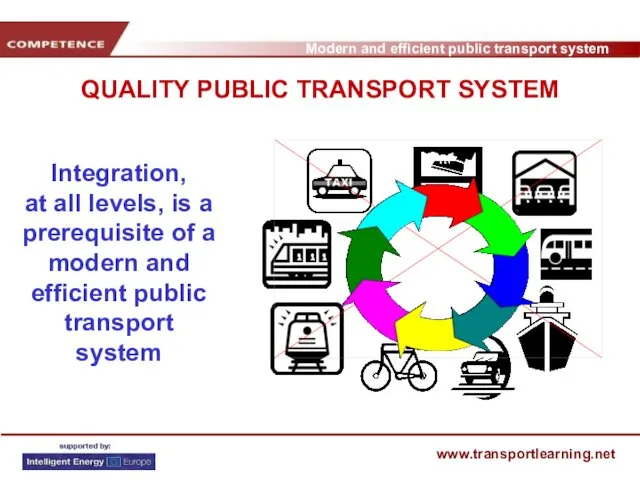
QUALITY PUBLIC TRANSPORT SYSTEM
Integration,
at all levels, is a prerequisite of a
QUALITY PUBLIC TRANSPORT SYSTEM
Integration, at all levels, is a prerequisite of a
THE NEED FOR INTEGRATION
Passengers use ...
different routes and interchanges
different PT
THE NEED FOR INTEGRATION
Passengers use ...
different routes and interchanges
different PT
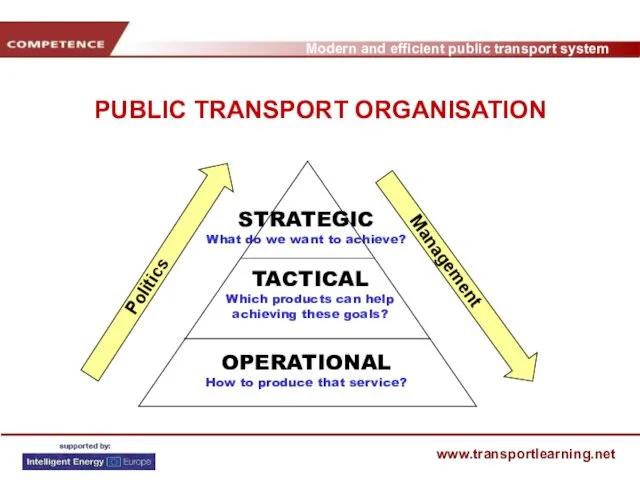
PUBLIC TRANSPORT ORGANISATION
Management
PUBLIC TRANSPORT ORGANISATION
Management
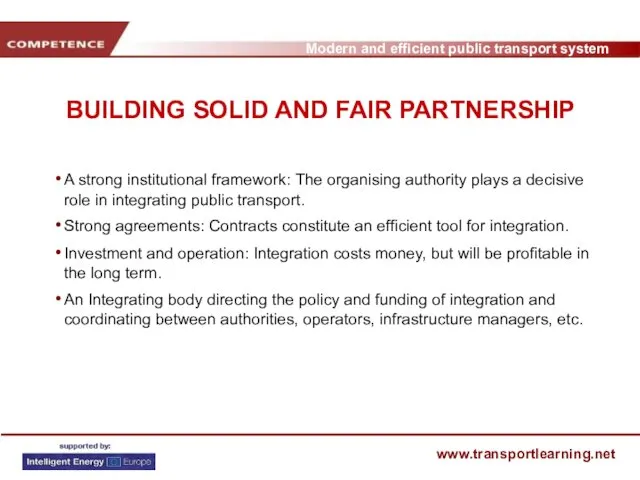
BUILDING SOLID AND FAIR PARTNERSHIP
A strong institutional framework: The organising
BUILDING SOLID AND FAIR PARTNERSHIP
A strong institutional framework: The organising
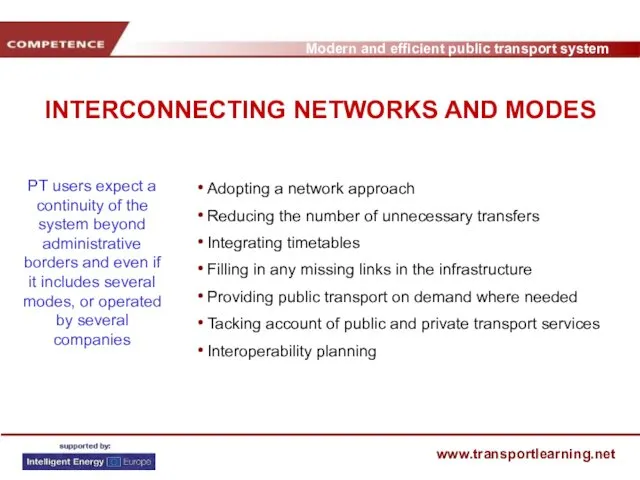
INTERCONNECTING NETWORKS AND MODES
Adopting a network approach
Reducing the number of
INTERCONNECTING NETWORKS AND MODES
Adopting a network approach
Reducing the number of
ENHANCING INTERCHANGE POINTS
Location: Interchanges between two public transport trips; Interchanges
ENHANCING INTERCHANGE POINTS
Location: Interchanges between two public transport trips; Interchanges
MAKING TICKETING USER-FRIENDLY
Harmonizing and integrating fares and ticketing facilitates the
MAKING TICKETING USER-FRIENDLY
Harmonizing and integrating fares and ticketing facilitates the
PROVIDING INTEGRATED INFORMATION
PROVIDING INTEGRATED INFORMATION
TURNING TRAVEL TIME INTO AN ASSET
Travellers should feel at ease
TURNING TRAVEL TIME INTO AN ASSET
Travellers should feel at ease
PROVIDING COMPREHENSIVE MOBILITY SOLUTION
Public transport should be complemented by flexible
PROVIDING COMPREHENSIVE MOBILITY SOLUTION
Public transport should be complemented by flexible
MODERNISE PUBLIC TRANSPORT VEHICLES
Driverless metros and automation of conventional metro
MODERNISE PUBLIC TRANSPORT VEHICLES
Driverless metros and automation of conventional metro
IMPLEMENTING MODERN MANAGEMENT
Public transport companies should adopt a more commercial
IMPLEMENTING MODERN MANAGEMENT
Public transport companies should adopt a more commercial
MADRID, SPAIN
Set-up of an organising authority
Extension of the metro network
MADRID, SPAIN
Set-up of an organising authority
Extension of the metro network
BOGOTA, COLOMBIA
Implementation of Bus Rapid Transit network
(41 km in 2002,
BOGOTA, COLOMBIA
Implementation of Bus Rapid Transit network (41 km in 2002,
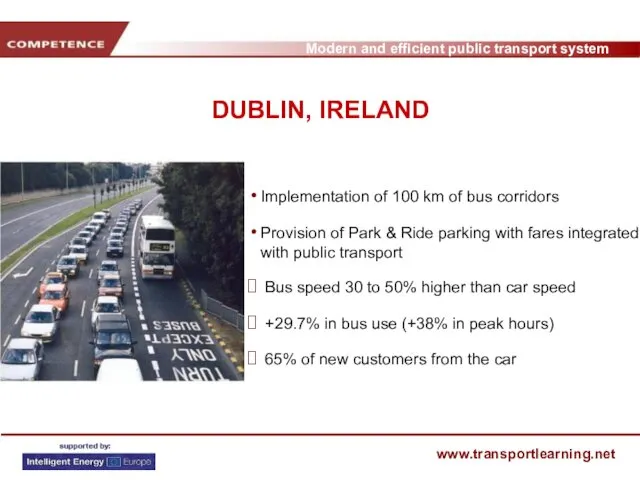
DUBLIN, IRELAND
Implementation of 100 km of bus corridors
Provision of Park
DUBLIN, IRELAND
Implementation of 100 km of bus corridors
Provision of Park
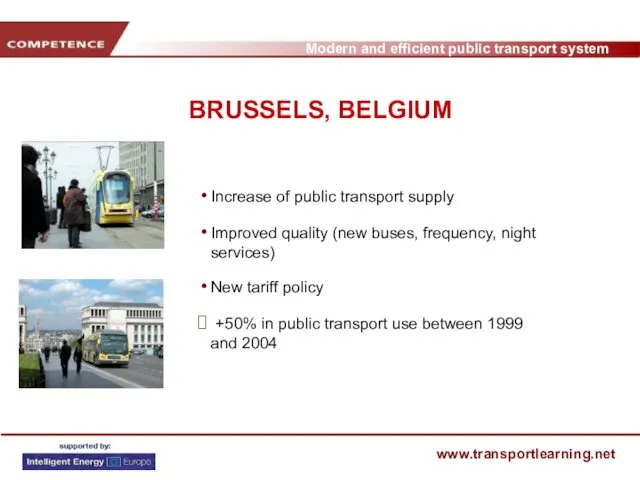
BRUSSELS, BELGIUM
Increase of public transport supply
Improved quality (new buses, frequency,
BRUSSELS, BELGIUM
Increase of public transport supply
Improved quality (new buses, frequency,
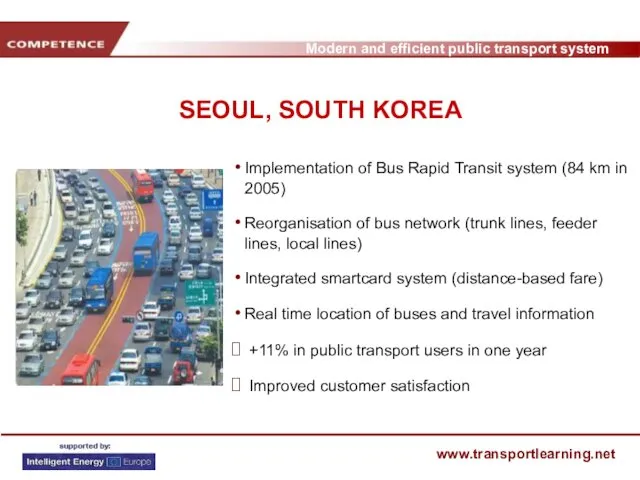
SEOUL, SOUTH KOREA
Implementation of Bus Rapid Transit system (84 km
SEOUL, SOUTH KOREA
Implementation of Bus Rapid Transit system (84 km
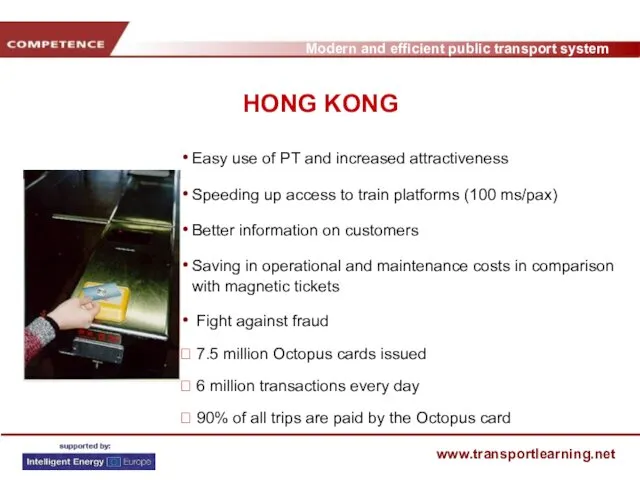
HONG KONG
Easy use of PT and increased attractiveness
Speeding up access
HONG KONG
Easy use of PT and increased attractiveness
Speeding up access
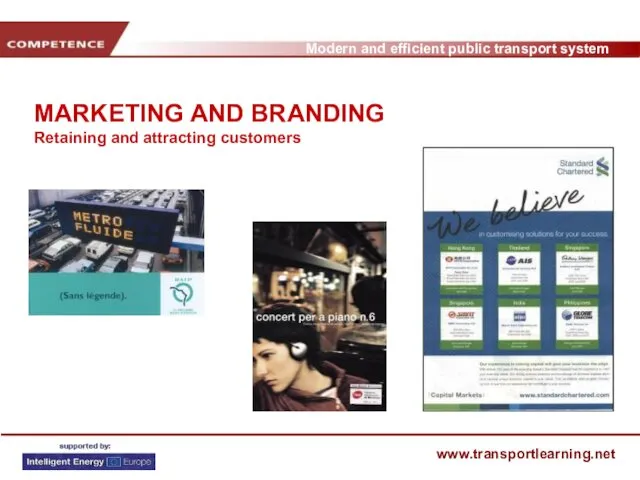
MARKETING AND BRANDING
Retaining and attracting customers
MARKETING AND BRANDING
Retaining and attracting customers
=
? +10% OF NEW CUSTOMERS
(+ 51 000 new PT
=
? +10% OF NEW CUSTOMERS
(+ 51 000 new PT
“Transport is not a technical, but a political issue.
Technically and economically
“Transport is not a technical, but a political issue.
Technically and economically
 Репродуктивное здоровье населения и национальная безопасность России
 Мультимедийная игра
 Как и где зимуют птицы (1 класс)
 Разработка программы парсинга psd шаблона в website
 Введение в гнатологию
 Презентация Добрые дела на все времена
 Презентация Автоматизация звука Л в слогах
 Презентация к уроку основания
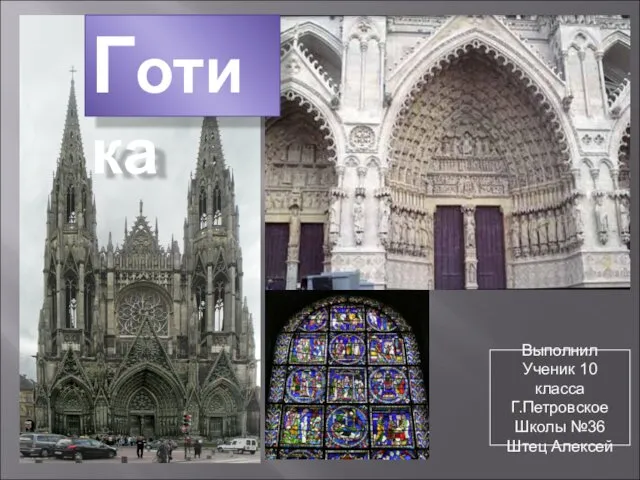 Готика
 Передача двумя руками снизу.
 Татарску 100 лет.
 Однофазная цепь переменного тока
 Липиды (5 B)
 Основы наноэлектроники и нанотехнологий. Наноэлектроника. Фактор нано-. (Лекция 1)
 Артериальная гипертензия (АГ). Гипертоническая болезнь (ГБ)
 Создание мультимедийной презентации
 Петрофизика. Пористость. Виды пористости
 Афинское государство в архаический период VIII-VI веков до новой эры
 класс Риторика Презентация Необычные тексты
 Создание ситуации успеха учащихся в изобразительной деятельности через использование нетрадиционных техник рисования
 Технология личностно - ориентированного развивающего обучения: методы и приемы
 презентация на тему: Развитие профессиональных компетенций педагога дошкольной образовательной организации
 ТС сигналдарын қабылдау және кодадан шығару кезіндегі орталық пост аппаратураларының жұмысы
 Методика обучения пространственно-объемным видам искусства
 Консульство и образование наполеоновской империи
 презентация к занятию: Давайте жить дружно!
 Лепка. Из истории лепки. Рисунок на пластилине
 Презентация 9.Натурные зарисовки натюрморта с введением декоративности