- Theory of Supply and Demand

Содержание
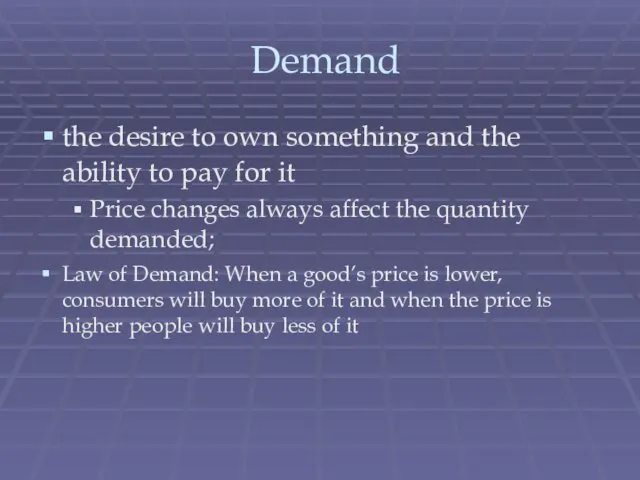
- 2. Demand the desire to own something and the ability to pay for it Price changes always
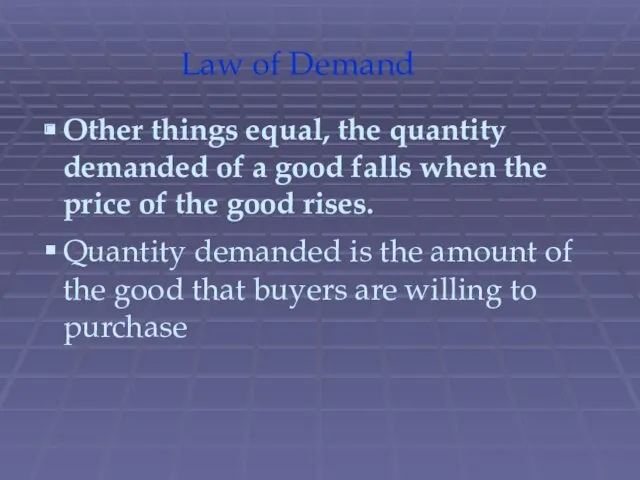
- 3. Law of Demand Other things equal, the quantity demanded of a good falls when the price
- 4. Types of markets Market is a group of buyers and sellers of a particular good or
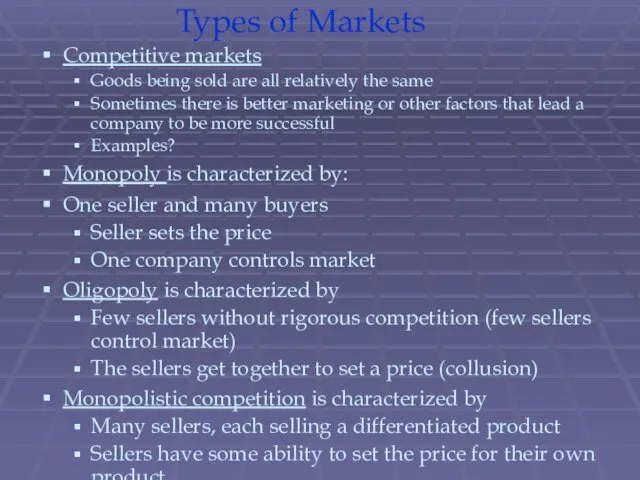
- 5. Types of Markets Competitive markets Goods being sold are all relatively the same Sometimes there is
- 6. There are 2 behaviors economists look at to study demand Substitution Effect Takes place when a
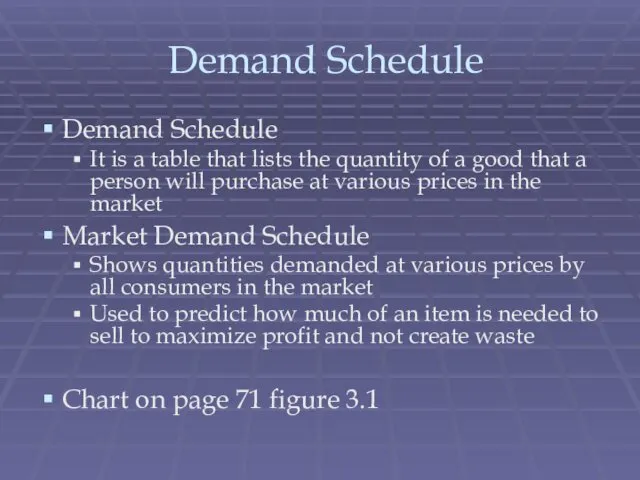
- 7. Demand Schedule Demand Schedule It is a table that lists the quantity of a good that
- 8. Law of Demand with Pizza
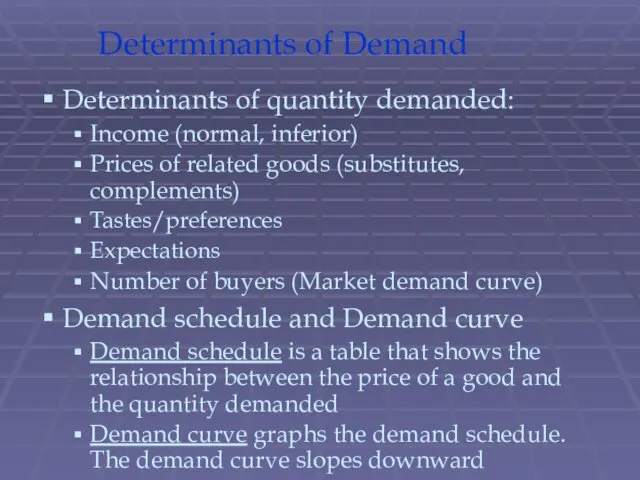
- 9. Determinants of Demand Determinants of quantity demanded: Income (normal, inferior) Prices of related goods (substitutes, complements)
- 10. Market Versus Individual Demand Market demand is the horizontal sum of all individual demands for a
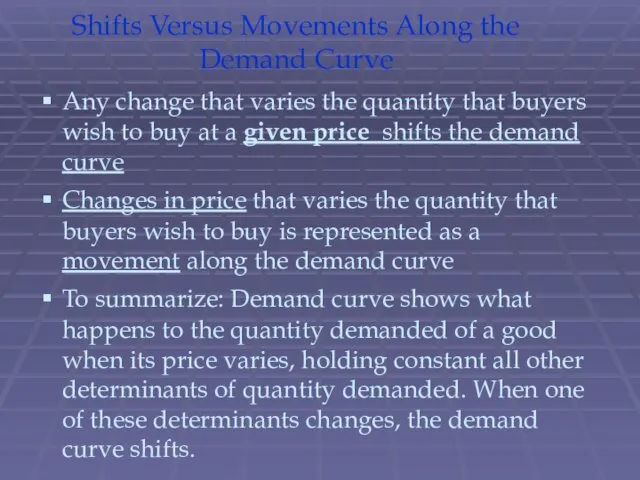
- 11. Shifts Versus Movements Along the Demand Curve Any change that varies the quantity that buyers wish
- 12. Application of law of Demand: Policy to Reduce Smoking Raise prices of cigarettes by putting a
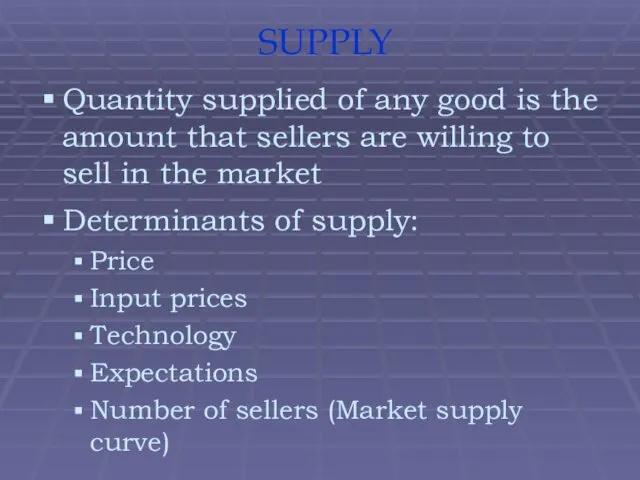
- 13. SUPPLY Quantity supplied of any good is the amount that sellers are willing to sell in
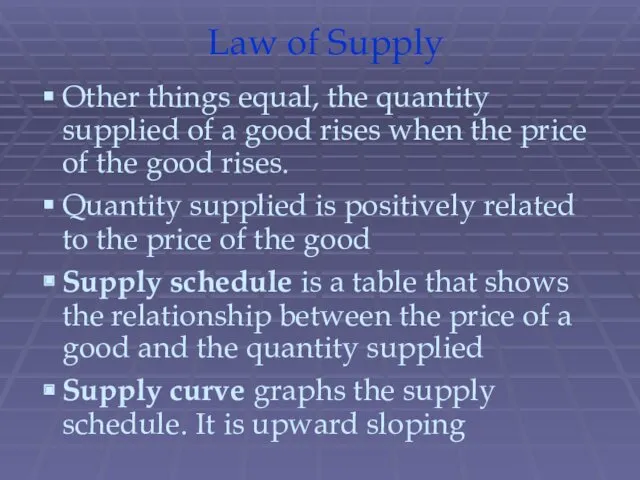
- 14. Law of Supply Other things equal, the quantity supplied of a good rises when the price
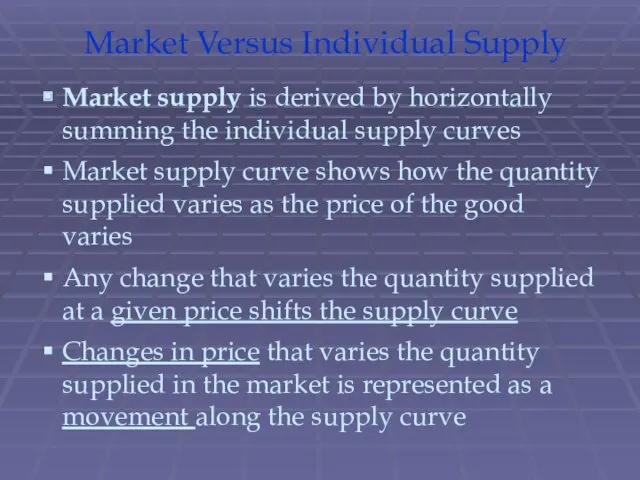
- 15. Market Versus Individual Supply Market supply is derived by horizontally summing the individual supply curves Market
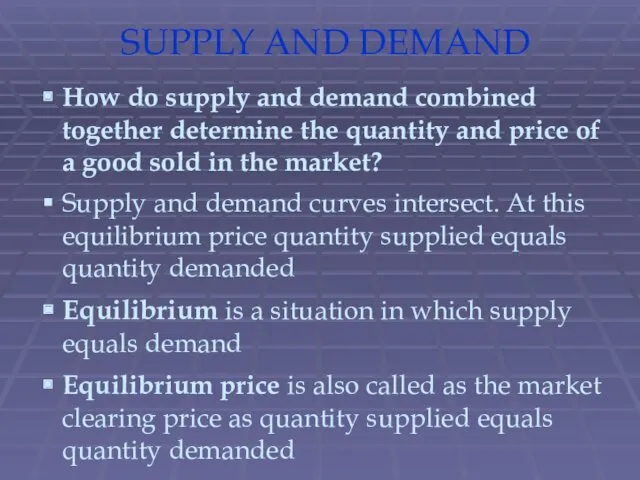
- 16. SUPPLY AND DEMAND How do supply and demand combined together determine the quantity and price of
- 17. SUPPLY AND DEMAND What happens when market price is not equal to the equilibrium price? Excess
- 18. LAW OF SUPPLY AND DEMAND Other things remaining same, the price of any good adjusts to
- 19. Analyzing Changes in Equilibrium: Application Change in demand- shifts in the demand curve Change in supply-
- 20. Analyzing Changes in Equilibrium: Summary
- 22. Скачать презентацию
Demand
the desire to own something and the ability to pay
Demand
the desire to own something and the ability to pay
Law of Demand
Other things equal, the quantity demanded of a good
Law of Demand
Other things equal, the quantity demanded of a good

Types of markets
Market is a group of buyers and sellers of
Types of markets
Market is a group of buyers and sellers of
Types of Markets
Competitive markets
Goods being sold are all relatively the
Types of Markets
Competitive markets
Goods being sold are all relatively the
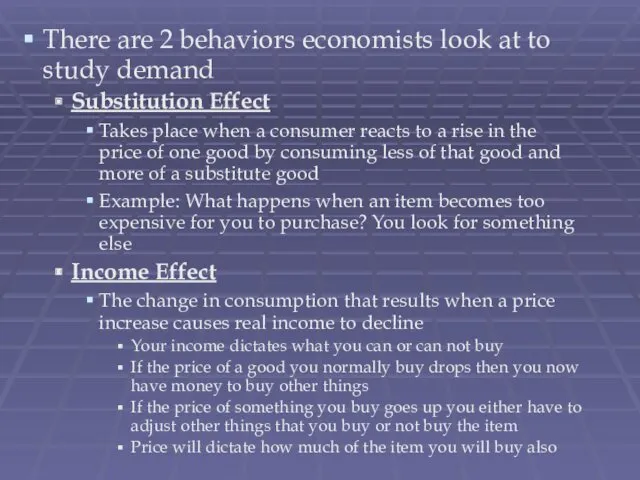
There are 2 behaviors economists look at to study demand
Substitution Effect
Takes
There are 2 behaviors economists look at to study demand
Substitution Effect
Takes
Demand Schedule
Demand Schedule
It is a table that lists the quantity
Demand Schedule
Demand Schedule
It is a table that lists the quantity

Law of Demand with Pizza
Law of Demand with Pizza
Determinants of Demand
Determinants of quantity demanded:
Income (normal, inferior)
Prices of related
Determinants of Demand
Determinants of quantity demanded:
Income (normal, inferior)
Prices of related

Market Versus Individual Demand
Market demand is the horizontal sum of all
Market Versus Individual Demand
Market demand is the horizontal sum of all
Shifts Versus Movements Along the Demand Curve
Any change that varies the
Shifts Versus Movements Along the Demand Curve
Any change that varies the
Application of law of Demand: Policy to Reduce Smoking
Raise prices
Application of law of Demand: Policy to Reduce Smoking
Raise prices
SUPPLY
Quantity supplied of any good is the amount that sellers are
SUPPLY
Quantity supplied of any good is the amount that sellers are
Law of Supply
Other things equal, the quantity supplied of a good
Law of Supply
Other things equal, the quantity supplied of a good
Market Versus Individual Supply
Market supply is derived by horizontally summing the
Market Versus Individual Supply
Market supply is derived by horizontally summing the
SUPPLY AND DEMAND
How do supply and demand combined together determine the
SUPPLY AND DEMAND
How do supply and demand combined together determine the
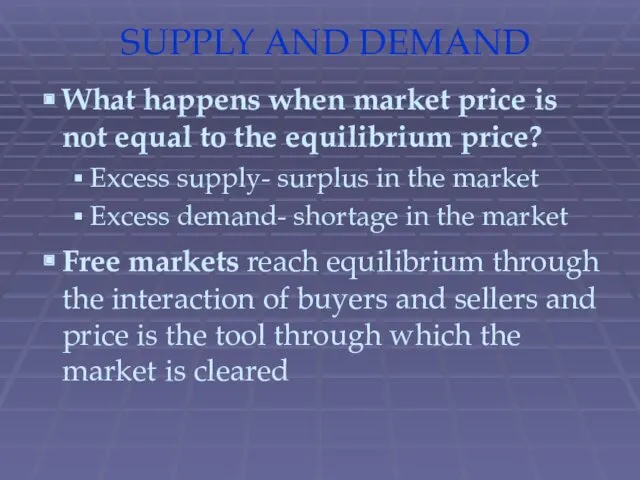
SUPPLY AND DEMAND
What happens when market price is not equal to
SUPPLY AND DEMAND
What happens when market price is not equal to
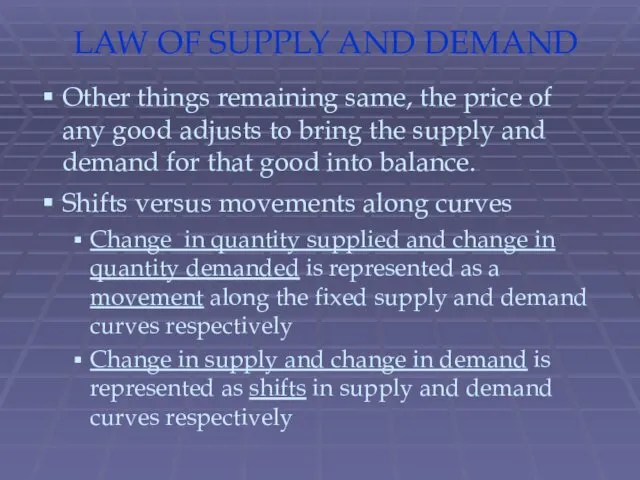
LAW OF SUPPLY AND DEMAND
Other things remaining same, the price of
LAW OF SUPPLY AND DEMAND
Other things remaining same, the price of
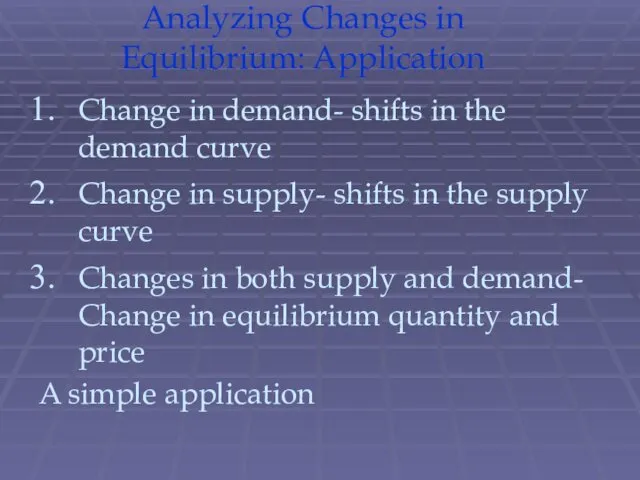
Analyzing Changes in Equilibrium: Application
Change in demand- shifts in the demand
Analyzing Changes in Equilibrium: Application
Change in demand- shifts in the demand

Analyzing Changes in Equilibrium: Summary
Analyzing Changes in Equilibrium: Summary
 Свет и цвет в фотографии
 Вимірювання обертального моменту валу електродвигуна на основі тензорезистора
 Структуры осадочных пород
 гр.Улыбка вторник 14.04
 Презентация: Использование информационно-просветительских форм работы с родителями по правилам дорожного движения
 Проект организации перевалки сельскохозяйственных грузов Генезис
 Презентация Тула - моя малая Родина
 Воспитательный потенциал современной семьи
 Подготовительный этап коррекционно-логопедической работы по преодолению нарушений произношения звуков Х и Х'
 Дети-герои Великой Отечественной войны
 Клиническая трансфузиология
 Радиостанция комплекса Vertex VX-4200. (Тема 4.7)
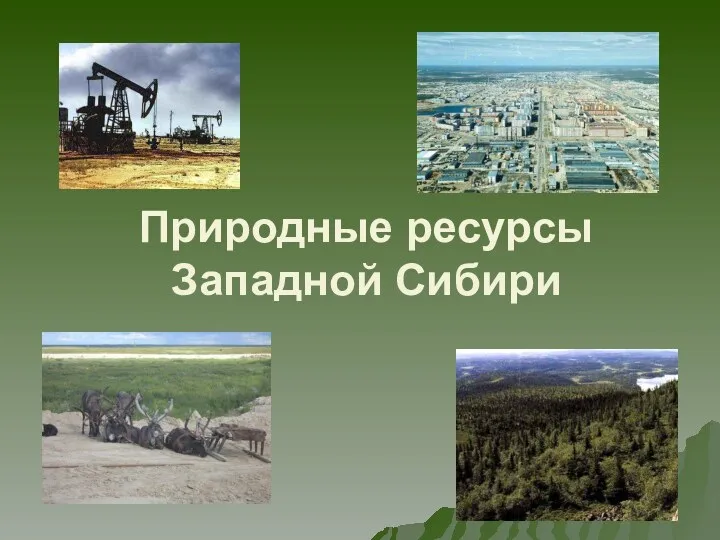 Презентация к уроку по теме Природные ресурсы Западной Сибири (8 класс)
 A_B_klassy_01_03_2021
 Аппаратные и программные средства видеонаблюдения
 Растворы. Растворимость
 Особенности функциональной специализации полушарий у детей с ОНР
 ПрезентацияСвященные сооружения
 Безусловная оптимизация методом классического математического анализа. Определение оптимального времени пребывания
 Ах, эти кошки… Викторина
 МОЯ ВИЗИТНАЯ КАРТОЧКА
 Мікропроцесорні системи
 презентация 70 лет Сталинградской битве
 Презентация. История герба города Погара.
 Виртуальная экскурсия по городу Псков. Псковский Кром (Кремль)
 Пищеварение в ротовой полости
 Хамантова Г. Ю. МБУ ДО Полазненская ДШИ, Рециклинг
 Макет рабочей программы воспитания при разработке и обновлении образовательных программ среднего профессионального образования