- Japan. The relationship between real GDP and real primary exports

Содержание
- 2. Context Motivation behind the country selection Country profile GDP and Export relationship Methodology Results Conclusion
- 3. Reason of choice 3rd largest economy in the world Japanese cultural philosophy in their economy Small
- 4. Country profile 2015 Nominal GDP - $4,383,076 million Real GDP - $4,341,086 million 1980 Nominal GDP
- 5. GDP Growth 2015 -11.41%
- 6. GDP composition 2014 Agriculture: 1.17% Industry: 26.86% Services, etc: 71.97%
- 7. Real Export 1980 $132.1 billion 2015 $580.4 billion
- 8. Export Structure
- 9. Exports (% of GDP)
- 10. GDP and export relationship No foreign constraints Improved technology Increased productivity Economies of scale More production
- 11. Methodology Unit root test Co – integration test Vector Autoregressive model
- 12. Unit root test
- 13. Co - integration test
- 14. VAR model DX(-1) and DY(-1) are not significant No short-run effect from exports to GDP No
- 15. Conclusion Decline in Real GDP and Real Exports Unit root test – series are non-stationary Co-integration
- 17. Скачать презентацию

Context
Motivation behind the country selection
Country profile
GDP and Export relationship
Methodology
Results
Conclusion
Context
Motivation behind the country selection
Country profile
GDP and Export relationship
Methodology
Results
Conclusion
Reason of choice
3rd largest economy in the world
Japanese cultural philosophy in
Reason of choice
3rd largest economy in the world
Japanese cultural philosophy in
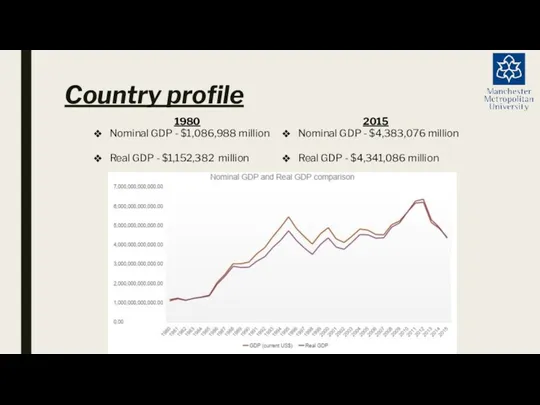
Country profile
2015
Nominal GDP - $4,383,076 million
Real GDP - $4,341,086
Country profile
2015
Nominal GDP - $4,383,076 million
Real GDP - $4,341,086
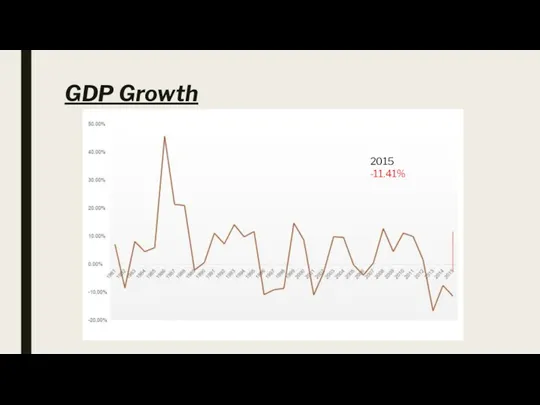
GDP Growth
2015 -11.41%
GDP Growth
2015 -11.41%
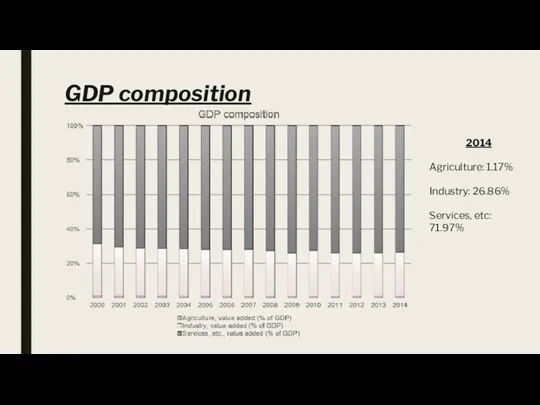
GDP composition
2014
Agriculture: 1.17%
Industry: 26.86%
Services, etc: 71.97%
GDP composition
2014
Agriculture: 1.17%
Industry: 26.86%
Services, etc: 71.97%
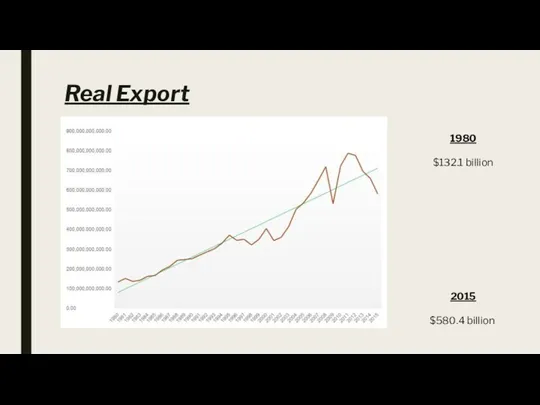
Real Export
1980
$132.1 billion
2015
$580.4 billion
Real Export
1980
$132.1 billion
2015
$580.4 billion
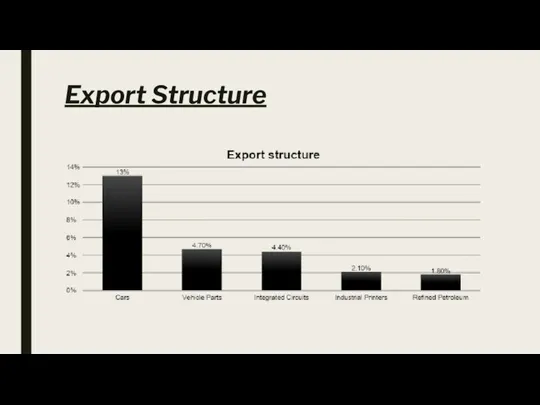
Export Structure
Export Structure
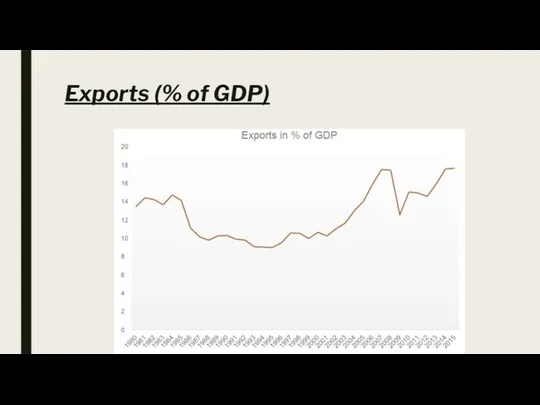
Exports (% of GDP)
Exports (% of GDP)
GDP and export relationship
No foreign constraints
Improved technology
Increased productivity
Economies of scale
More
GDP and export relationship
No foreign constraints
Improved technology
Increased productivity
Economies of scale
More
Methodology
Unit root test
Co – integration test
Vector Autoregressive model
Methodology
Unit root test
Co – integration test
Vector Autoregressive model
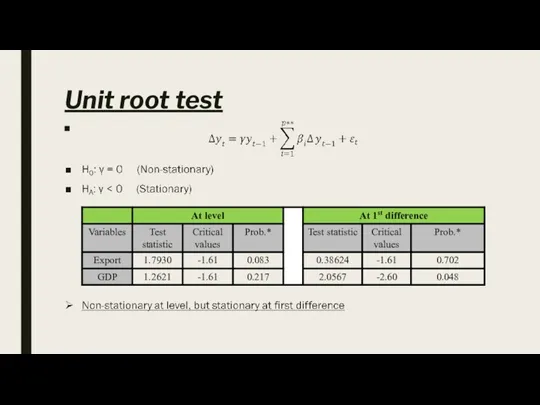
Unit root test
Unit root test
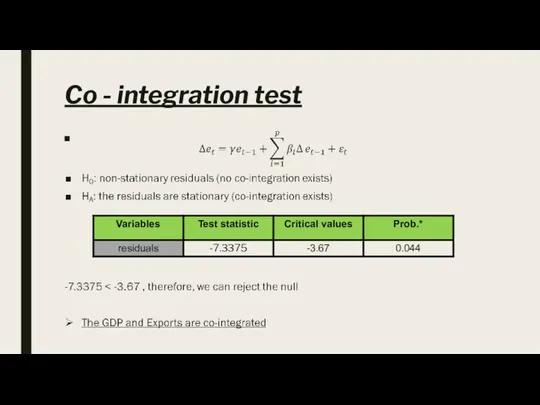
Co - integration test
Co - integration test

VAR model
DX(-1) and DY(-1) are not significant
No short-run effect from
VAR model
DX(-1) and DY(-1) are not significant
No short-run effect from

Conclusion
Decline in Real GDP and Real Exports
Unit root test – series
Conclusion
Decline in Real GDP and Real Exports
Unit root test – series
 Modern mechanisms of state support for small and medium-sized businesses (by the example of an enterprise)
 Экономические системы
 Общество с дополнительной ответственностью
 Оцінка очікуваних витрат для прогнозування та прийняття управлінських рішень
 Экономика. Основные признаки различных типов экономических систем
 Государственный сектор в системе регулирования экономики
 Финансовая система и фиcкальная политика
 Қазақ қауымның дүниетанымы : қалыптасуы мен өзгеріске бейімделу
 Модернизация в странах Европы США и Японии
 Экономика. Сущность экономического цикла и его фазы
 Сала экономикасы
 Меры поддержки для участников проекта
 Безработица, ее основные виды. Закон Оукена. Последствия безработицы
 Основы рыночного хозяйства и его структура. Тема № 2
 Разработка урока по экономике 8 класс на тему Зачем нужна биржа
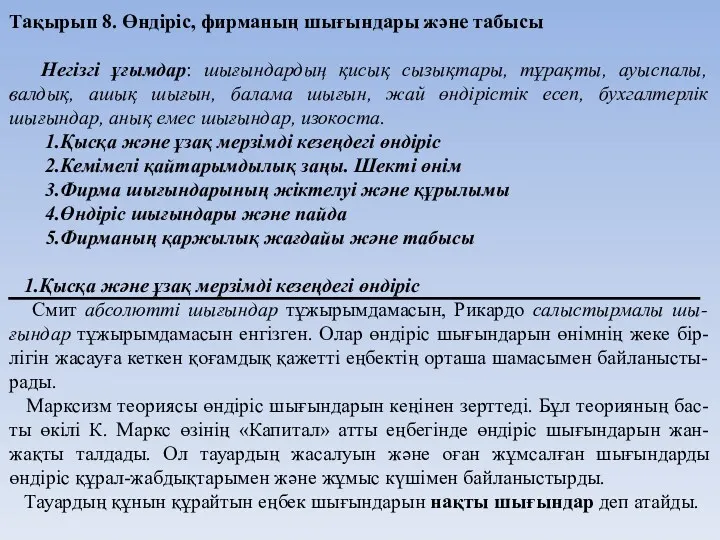 Өндіріс, фирманың шығындары және табысы
 Podniková ekonomika. Garant předmětu
 Продовольственная проблема населения
 Анализ эффективности использования основных средств в деятельности ООО Сельхозпродукт
 презентация для подготовки к ЕГЭ по обществознанию. Блок Экономика
 Экономические блага
 Распределение доходов. Доходы граждан и прожиточный минимум. Экономические меры социальной поддержки населения
 Инновационная экономика и технологическое предпринимательство
 Проблема ограниченности экономических ресурсов и ее последствия
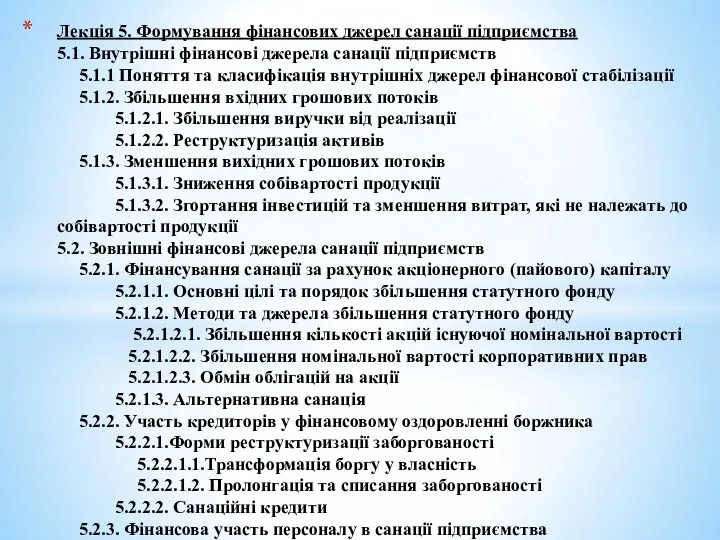 Формування фінансових джерел санації підприємства
 Обществознание. Экономика. Тест. Занятие №10
 Основные характеристики промышленных рынков
 Валовой внутренный продукт