- Supply and demand in economics

Содержание
- 2. The demand for a product or service is how much of a product or service people
- 3. Generally the relationship between price and quantity is negative. This means that the higher the price
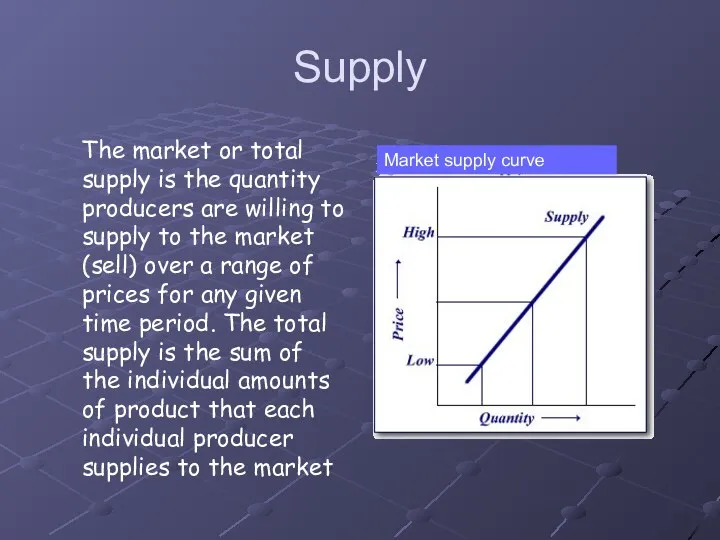
- 4. Supply The market or total supply is the quantity producers are willing to supply to the
- 5. An increase in price in will result in producers wanting to increase the quantity of a
- 6. Equilibrium Price Market equilibrium If we plot both demand and supply curves, where they intersect we
- 7. Shifts in Demand and Supply Curves Both demand and supply curves can shift, that is move
- 8. Factors that Shift the Demand Curve Change in consumer real incomes. Because a consumer's demand for
- 9. 2. Population change: An increase in population shifts the demand curve to the right D1 to
- 10. 4. Prices of related goods: If prices of related goods change, the demand curve for the
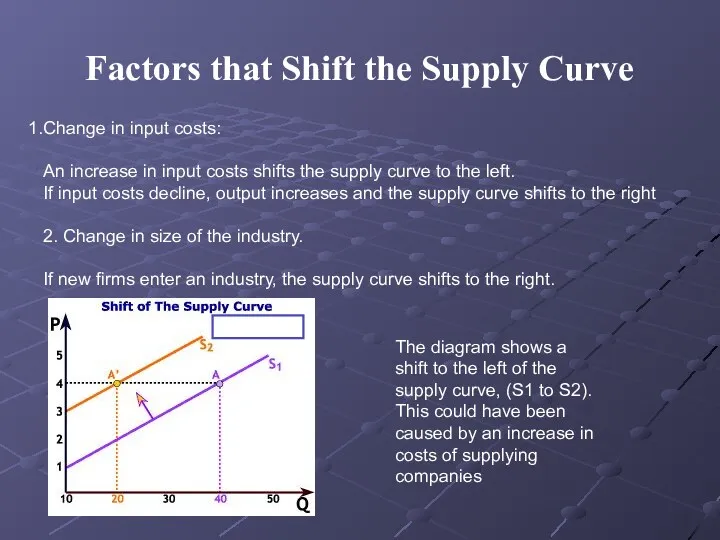
- 11. Factors that Shift the Supply Curve Change in input costs: An increase in input costs shifts
- 12. Improvements in technology: An improvement in technology shifts the supply curve to the right. Technological progress
- 13. When either demand or supply shifts, the equilibrium price will change. For example, bad weather normally
- 14. If the demand curve were to shift out because of increased real incomes, then the new
- 15. It is essential to distinguish between a movement along a demand curve and a shift in
- 17. Скачать презентацию
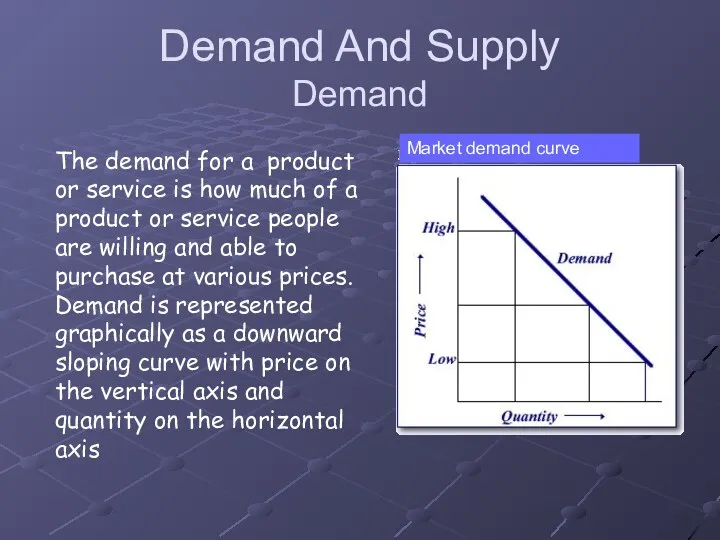
The demand for a product or service is how much of
The demand for a product or service is how much of
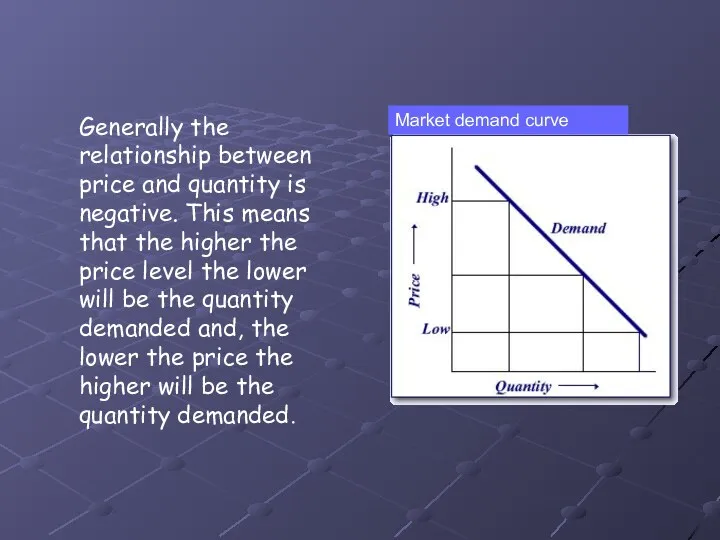
Generally the relationship between price and quantity is negative. This means
Generally the relationship between price and quantity is negative. This means
Supply
The market or total supply is the quantity producers are
Supply
The market or total supply is the quantity producers are
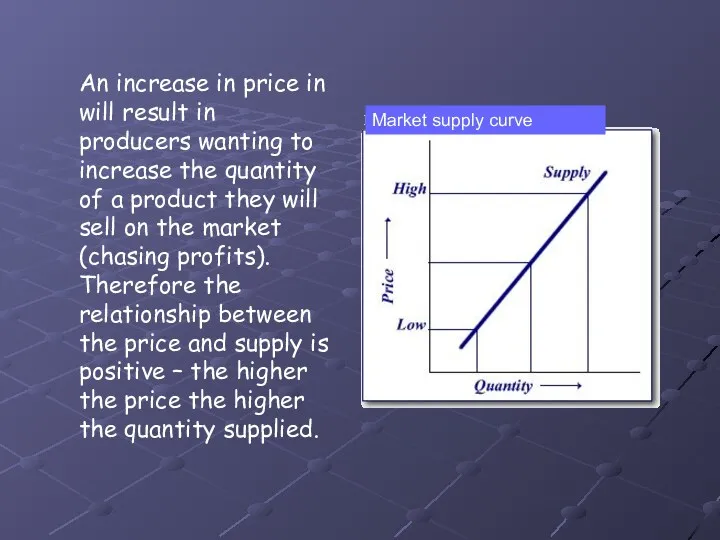
An increase in price in will result in producers wanting to
An increase in price in will result in producers wanting to
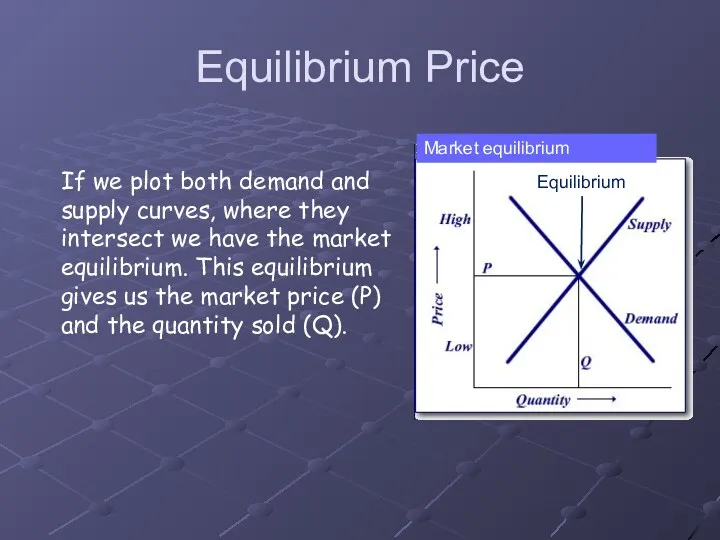
Equilibrium Price
Market equilibrium
If we plot both demand and
supply curves, where
Equilibrium Price
Market equilibrium
If we plot both demand and
supply curves, where
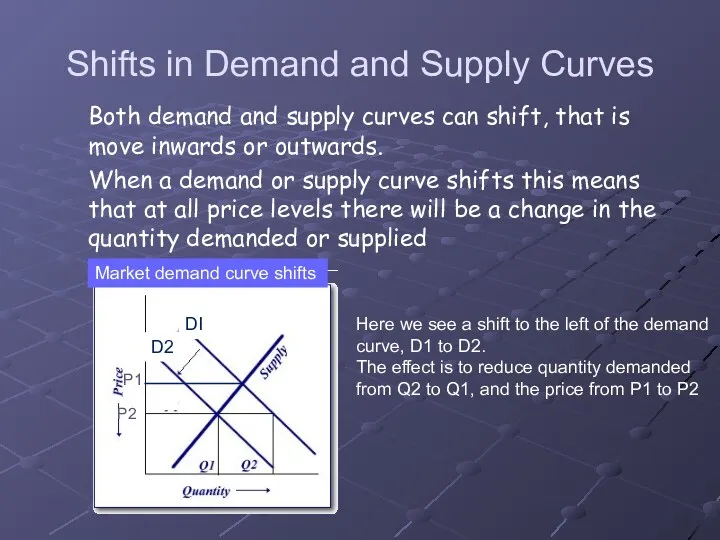
Shifts in Demand and Supply Curves
Both demand and supply curves can
Shifts in Demand and Supply Curves
Both demand and supply curves can

Factors that Shift the Demand Curve
Change in consumer real incomes.
Factors that Shift the Demand Curve
Change in consumer real incomes.
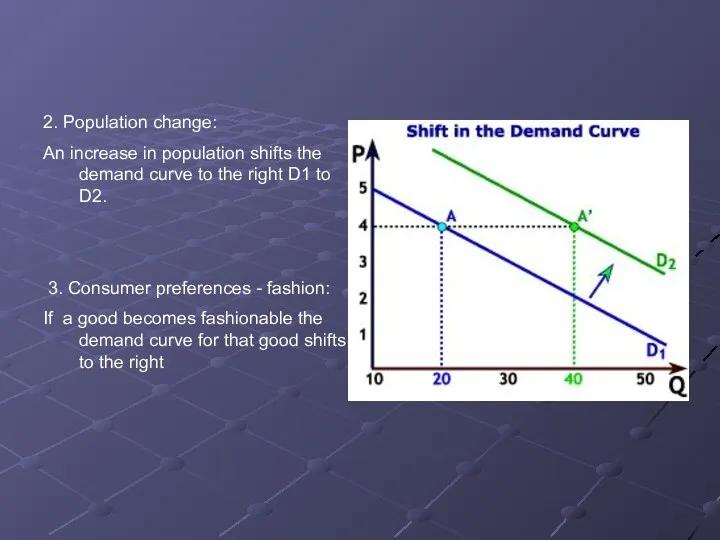
2. Population change:
An increase in population shifts the demand curve
2. Population change:
An increase in population shifts the demand curve
4. Prices of related goods: If prices of related goods change,
4. Prices of related goods: If prices of related goods change,
Factors that Shift the Supply Curve
Change in input costs:
An increase in
Factors that Shift the Supply Curve
Change in input costs:
An increase in
Improvements in technology:
An improvement in technology shifts the supply curve
Improvements in technology:
An improvement in technology shifts the supply curve
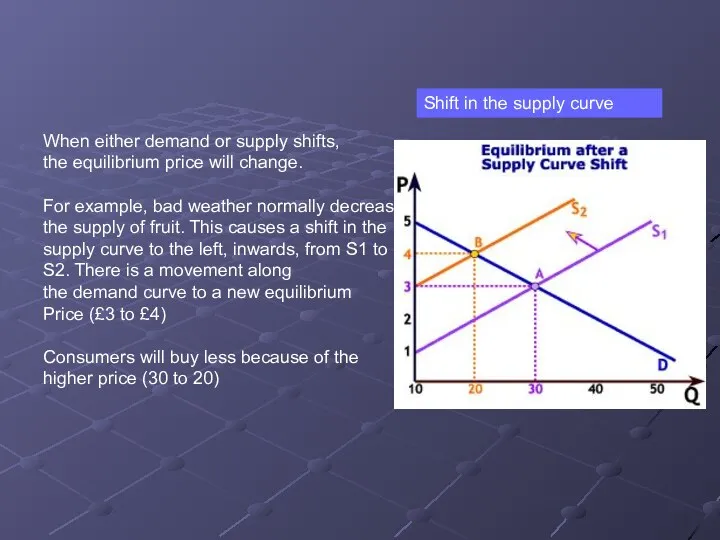
When either demand or supply shifts,
the equilibrium price will change.
For
When either demand or supply shifts,
the equilibrium price will change.
For
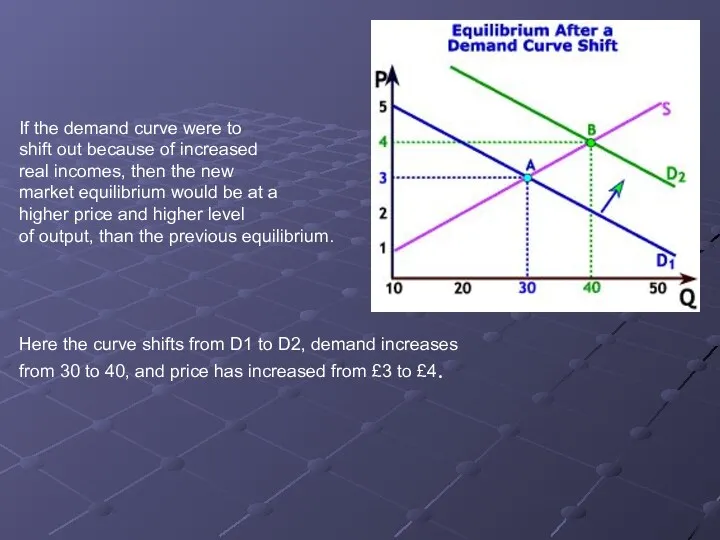
If the demand curve were to
shift out because of
If the demand curve were to
shift out because of
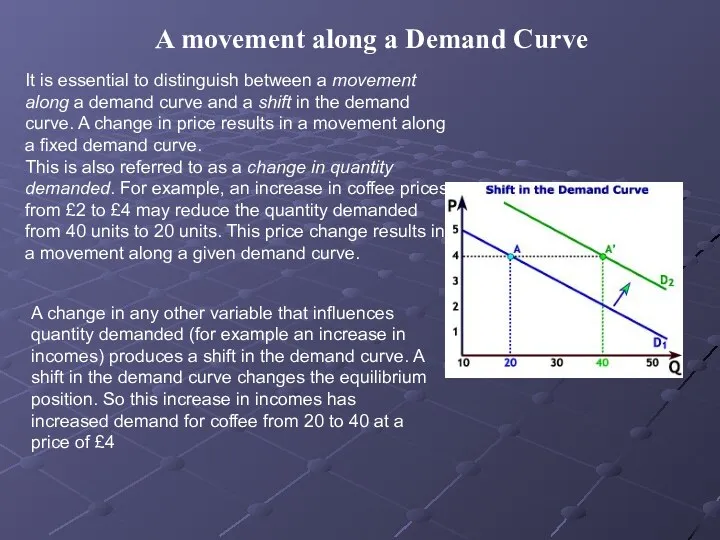
It is essential to distinguish between a movement along a
It is essential to distinguish between a movement along a
 Спрос
Спрос Экономическая сущность,состав и структура основных средств
 Макроэкономика после Дж.М. Кейнса
 Economic growth
 Экономическая природа фирмы
 Показатели оценки эффективности деятельности высших должностных лиц субъектов РФ
 Методологические основы планирования и прогнозирования
 Экономические взгляды монетаристов
 История экономических учений
 Безробіття
 Теория потребительского поведения
 Правовые и организационные основы деятельности правоохранительных органов по обеспечению экономической безопасности
 Mechanical engineering - leading branch of world economy
 Казахстан и Всемирная торговая организация
 Методы ценообразования
 Экономика и её основные участники
 Методы планирования потребности в персонале
 Теория отраслевых рынков. Ценовая дисперсия
 Бюджет для граждан
 Население Европейского Северо-Запада
 Великобритания
 Macroeconomics: overview
 Порівняльні економічні системи і публічне адміністрування. (Лекція 1)
 Анализ и диагностика финансово-хозяйственной деятельности предприятия. Экономический анализ
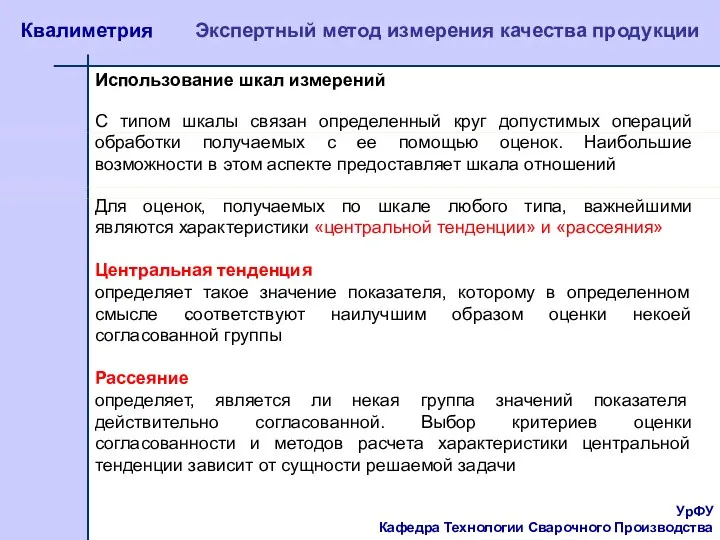 Квалиметрия. Экспертный метод измерения качества продукции. Использование шкал измерений
 Основные направления развития зарубежной социально-экономической географии в XIX и XX столетиях
 Структура автоматизированной системы промышленного предприятия
 Разработка бизнес-плана создания салона красоты ООО Модерн на примере ООО Максимум