- IT System analysis: system analysis approaches

Содержание
- 2. 3RD ASSIGNMENT Let’s continue
- 3. GOAL Develop the model of the system analyzed Steps: Develop structure draft Discuss structure draft Add
- 4. METHODOLOGY Use UML to develop: Use case diagram Class diagram Object diagram State diagram Activity diagram
- 5. Introduction Modeling: drawing a flowchart listing the steps carried out by an application. Why do we
- 6. What is UML? The Unified Modeling Language (UML) is a standard language for specifying, visualizing, constructing,
- 7. The UML diagrams categories: Static Use case diagram Class diagram Dynamic Object diagram State diagram Activity
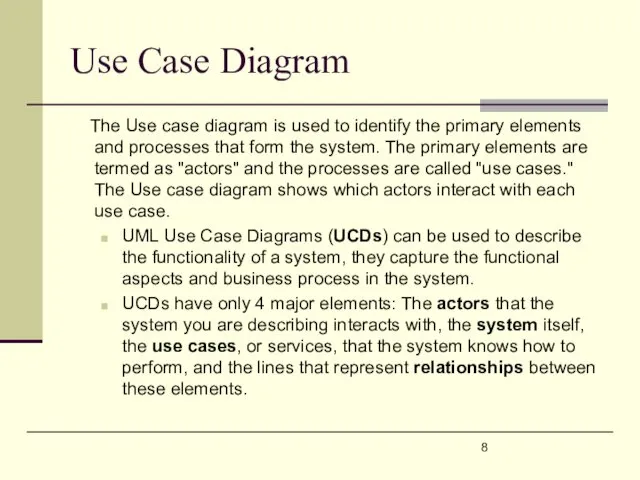
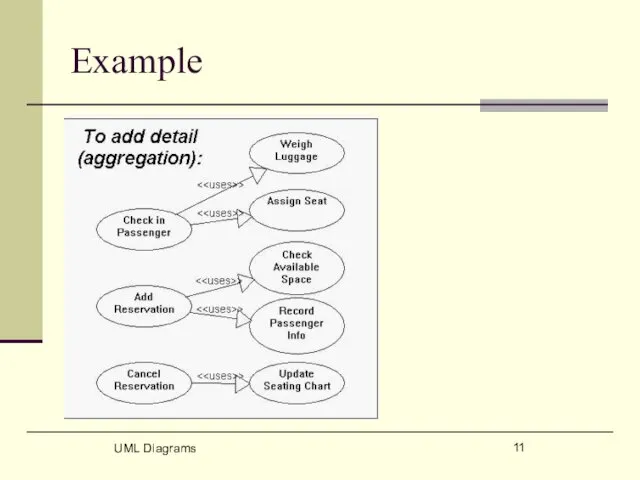
- 8. Use Case Diagram The Use case diagram is used to identify the primary elements and processes
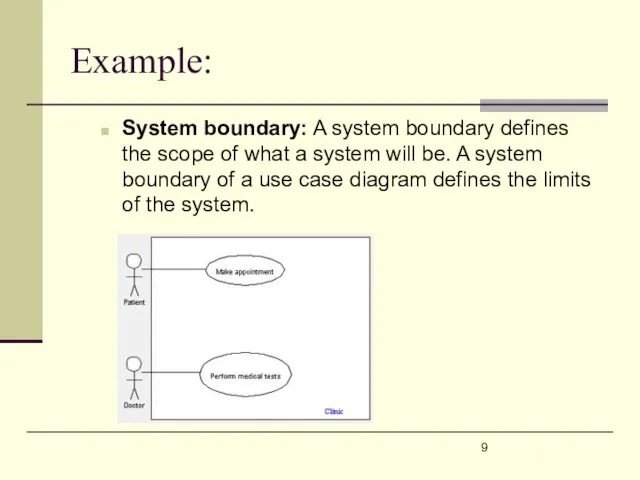
- 9. Example: System boundary: A system boundary defines the scope of what a system will be. A
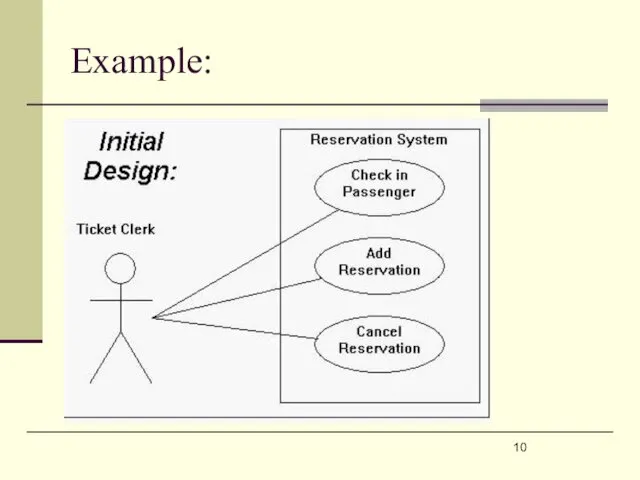
- 10. Example:
- 11. Example UML Diagrams
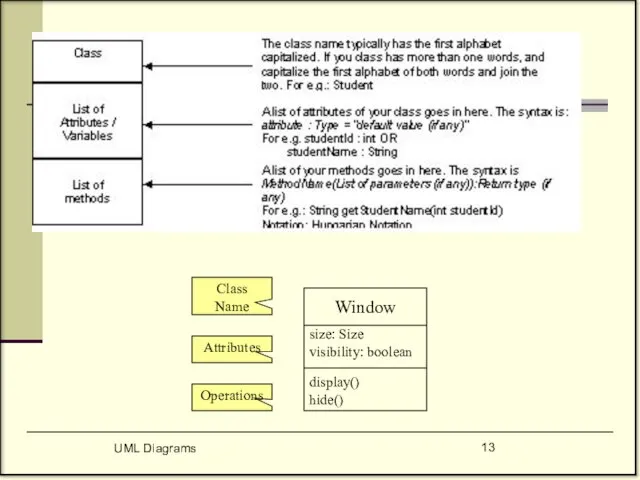
- 12. Definition: A class diagram is a diagram showing a collection of classes and interfaces, along with
- 13. UML Diagrams
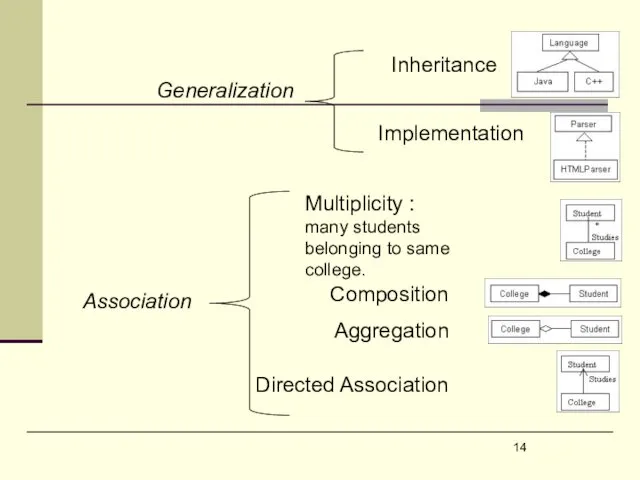
- 14. Inheritance Implementation Composition Aggregation Multiplicity : many students belonging to same college. Directed Association Generalization Association
- 15. Example:
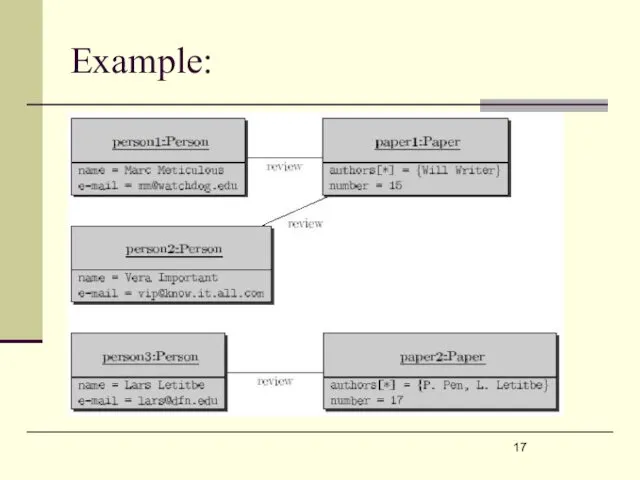
- 16. Object Diagrams in UML In a live application classes are not directly used, but instances or
- 17. Example:
- 18. State Diagram Basics We are now taking a deeper look at system dynamics. Some of the
- 19. Elements of a State diagram UML Diagrams
- 21. Example:
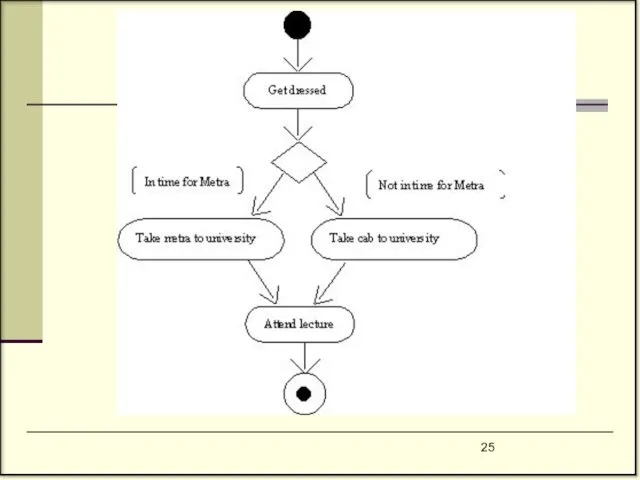
- 22. Activity Diagram The easiest way to visualize an Activity diagram is to think of a flowchart
- 23. Elements of an Activity diagram
- 24. An activity diagram may have only one initial action state, but may have any number of
- 26. Sequence Diagram in UML A sequence diagram captures the behavior of a single scenario. The diagram
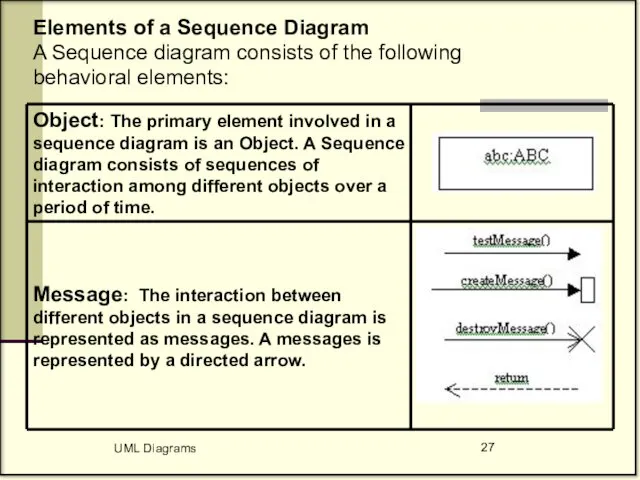
- 27. UML Diagrams Elements of a Sequence Diagram A Sequence diagram consists of the following behavioral elements:
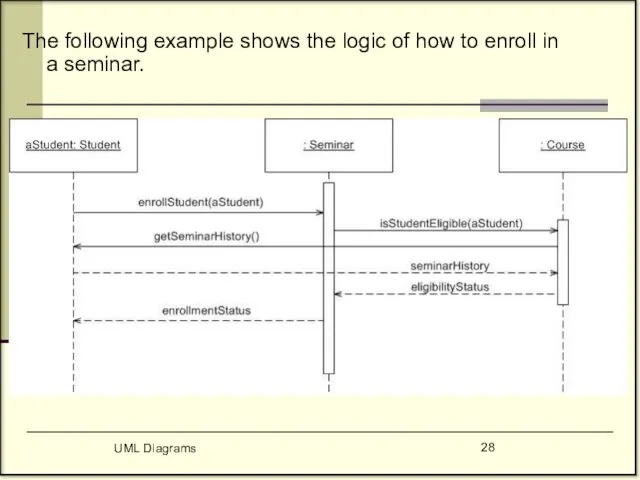
- 28. UML Diagrams The following example shows the logic of how to enroll in a seminar.
- 29. UML Diagrams
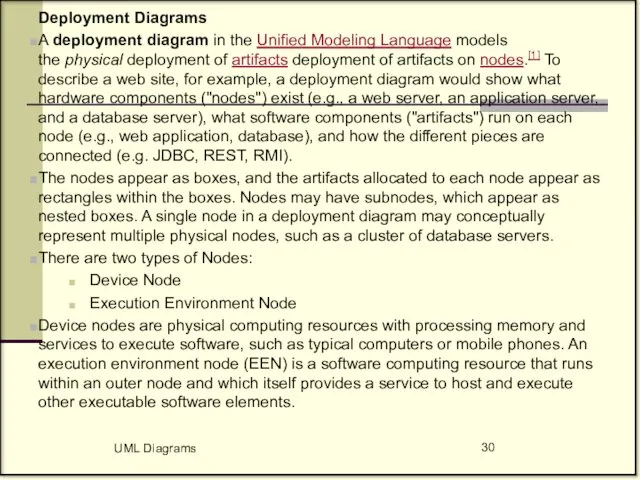
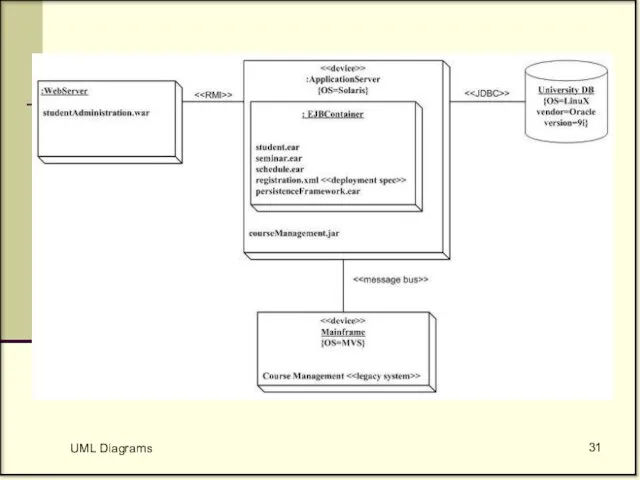
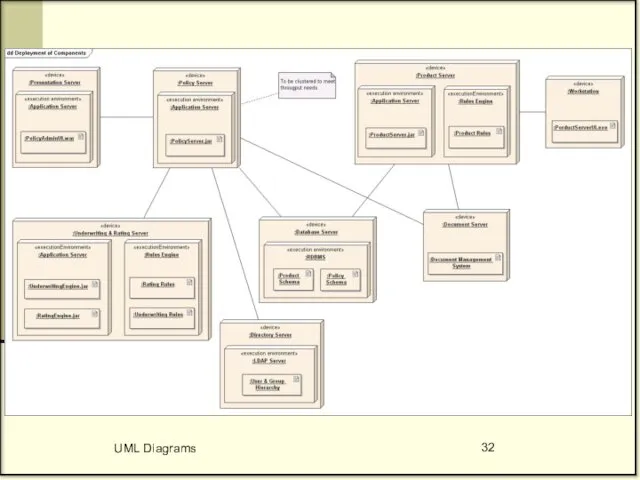
- 30. Deployment Diagrams A deployment diagram in the Unified Modeling Language models the physical deployment of artifacts
- 31. UML Diagrams
- 32. UML Diagrams
- 34. Скачать презентацию

3RD ASSIGNMENT
Let’s continue
3RD ASSIGNMENT
Let’s continue
GOAL
Develop the model of the system analyzed
Steps:
Develop structure draft
Discuss structure draft
Add
GOAL
Develop the model of the system analyzed
Steps:
Develop structure draft
Discuss structure draft
Add
METHODOLOGY
Use UML to develop:
Use case diagram
Class diagram
Object diagram
State diagram
Activity diagram
Sequence diagram
Collaboration
METHODOLOGY
Use UML to develop:
Use case diagram
Class diagram
Object diagram
State diagram
Activity diagram
Sequence diagram
Collaboration
Introduction
Modeling: drawing a flowchart listing the steps carried out by an
Introduction
Modeling: drawing a flowchart listing the steps carried out by an
What is UML?
The Unified Modeling Language (UML) is a standard
What is UML?
The Unified Modeling Language (UML) is a standard
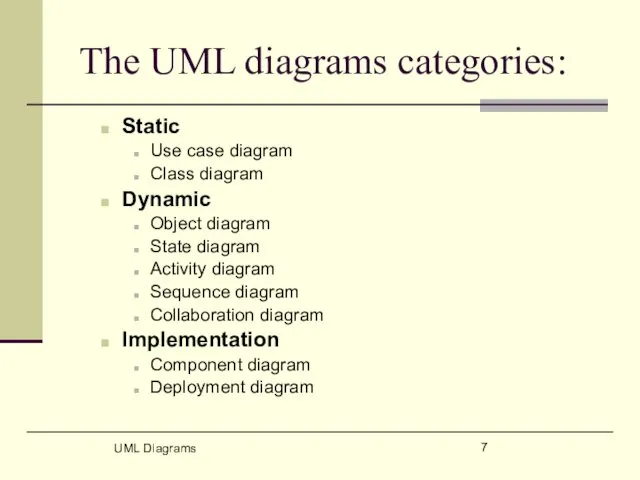
The UML diagrams categories:
Static
Use case diagram
Class diagram
Dynamic
Object
The UML diagrams categories:
Static
Use case diagram
Class diagram
Dynamic
Object
Use Case Diagram
The Use case diagram is used to identify
Use Case Diagram
The Use case diagram is used to identify
Example:
System boundary: A system boundary defines the scope of what a
Example:
System boundary: A system boundary defines the scope of what a
Example:
Example:
Example
UML Diagrams
Example
UML Diagrams
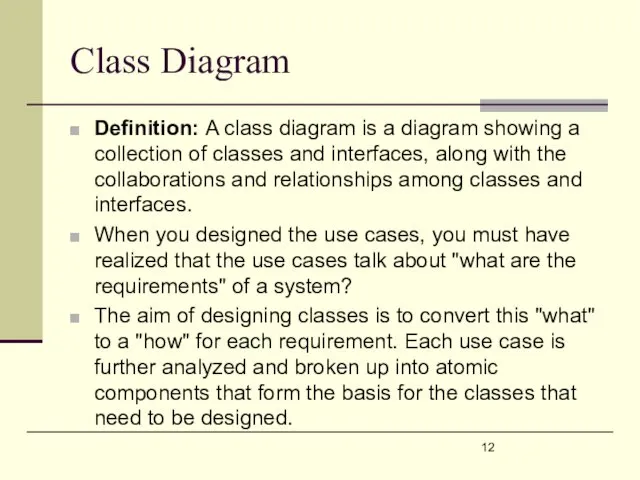
Definition: A class diagram is a diagram showing a collection of
Definition: A class diagram is a diagram showing a collection of
UML Diagrams
UML Diagrams
Inheritance
Implementation
Composition
Aggregation
Multiplicity : many students belonging to same
Inheritance
Implementation
Composition
Aggregation
Multiplicity : many students belonging to same
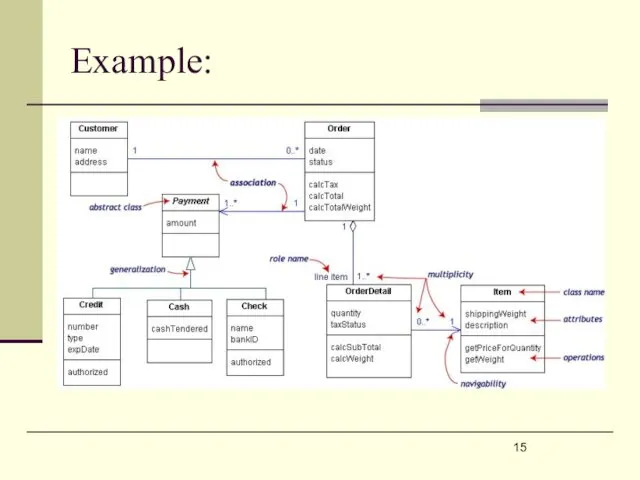
Example:
Example:
Object Diagrams in UML
In a live application classes are not
Object Diagrams in UML
In a live application classes are not
Example:
Example:
State Diagram
Basics
We are now taking a deeper look at system dynamics.
Some
State Diagram
Basics
We are now taking a deeper look at system dynamics.
Some
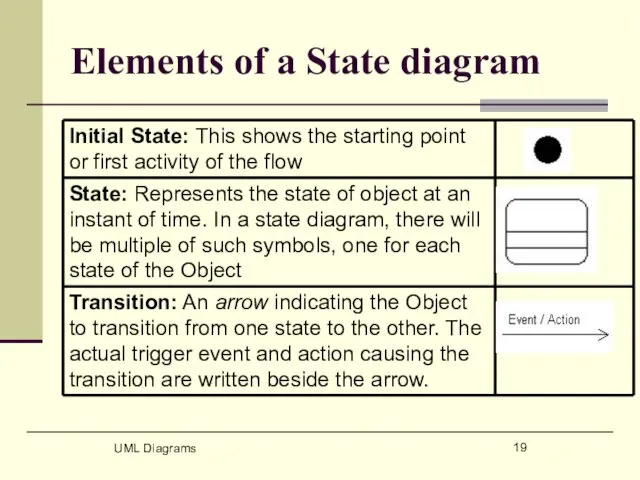
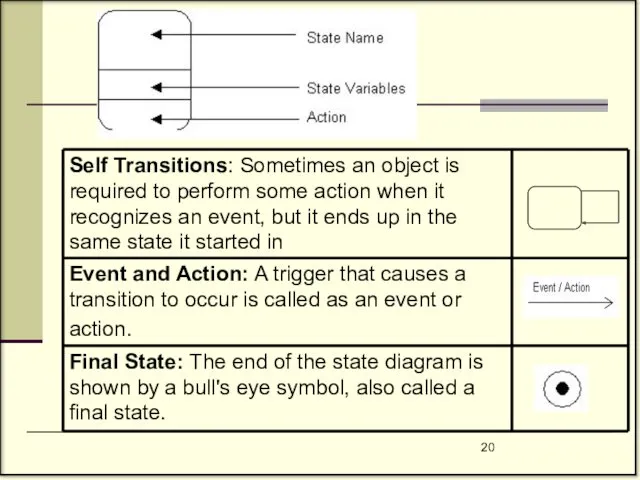
Elements of a State diagram
UML Diagrams
Elements of a State diagram
UML Diagrams
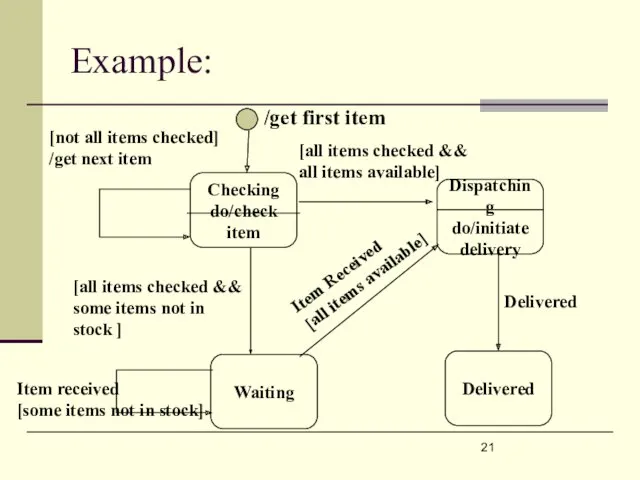
Example:
Example:
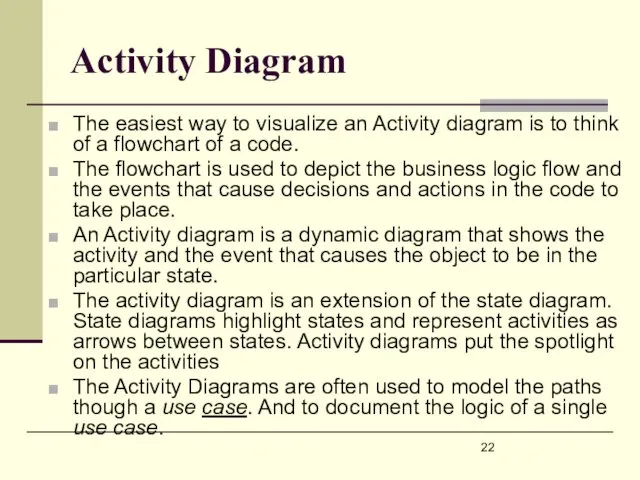
Activity Diagram
The easiest way to visualize an Activity diagram is to
Activity Diagram
The easiest way to visualize an Activity diagram is to
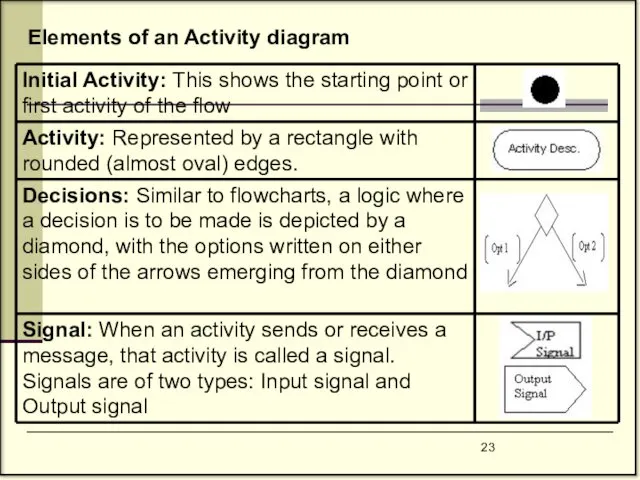
Elements of an Activity diagram
Elements of an Activity diagram
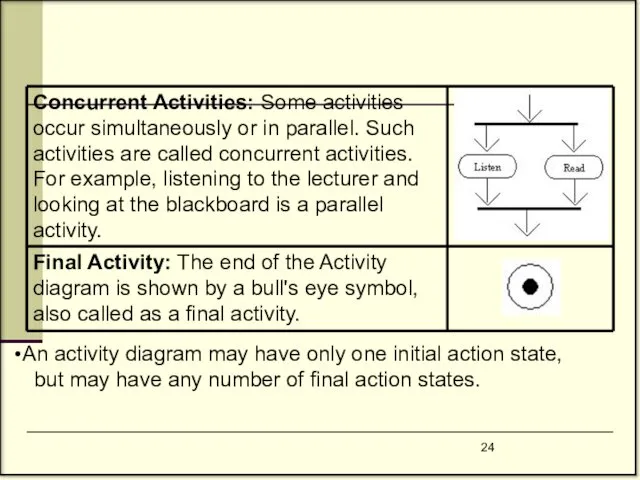
An activity diagram may have only one initial action state,
An activity diagram may have only one initial action state,
Sequence Diagram in UML
A sequence diagram captures the behavior of
Sequence Diagram in UML
A sequence diagram captures the behavior of
UML Diagrams
Elements of a Sequence Diagram
A Sequence diagram consists of the
UML Diagrams
Elements of a Sequence Diagram
A Sequence diagram consists of the
UML Diagrams
The following example shows the logic of how to enroll
UML Diagrams
The following example shows the logic of how to enroll
UML Diagrams
UML Diagrams
Deployment Diagrams
A deployment diagram in the Unified Modeling Language models the physical deployment of artifacts deployment of artifacts on nodes.[1] To describe a
Deployment Diagrams
A deployment diagram in the Unified Modeling Language models the physical deployment of artifacts deployment of artifacts on nodes.[1] To describe a
UML Diagrams
UML Diagrams
UML Diagrams
UML Diagrams
 Разработка рекомендаций по оценке безопасности информационных систем
 Принципы работы в сети. Исключения
 Частотные методы улучшения изображений. Лекция 3
 Программы Microsoft Office: PowerPoint 2010, Word 2010
 Стандартизация сетей. Модель OSI
 Пример слайда. Sydney Opera House is Australia’s
 История технологий шифрования
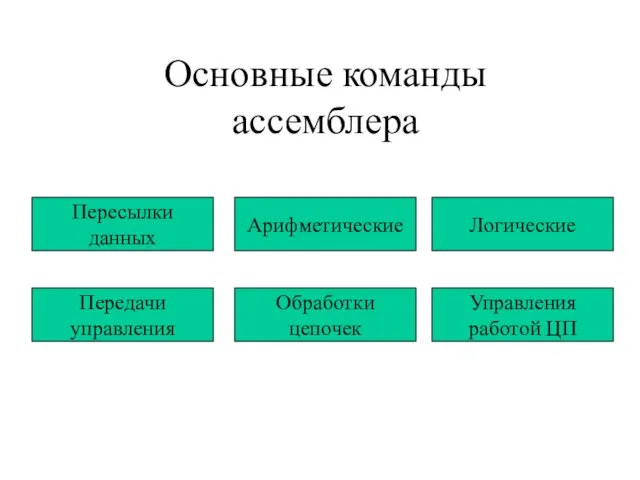 Основные команды ассемблера
 Вкладені цикли. Покрокове введення та виведення даних. Лекція №8
 Media & newspapers
 Сборочное моделирование. Решения по управлению жизненным циклом, продукт IBM/Dassault Systemes
 Российское движение школьников. Информационно-медийное направление
 Интернет-коммуникации. Автоматизация
 Графический метод решения уравнений в Excel
 Электронный листок нетрудоспособности на территории Ленинградской области
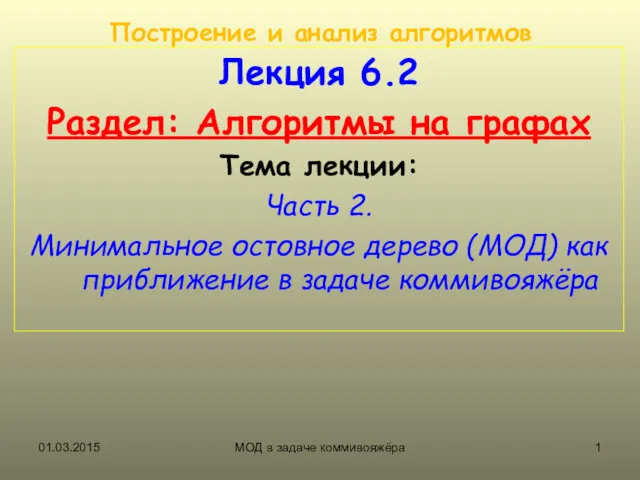 Построение и анализ алгоритмов. Алгоритмы на графах. МОД в задаче коммивояжёра. (Лекция 6.2)
 История серии видеоигр: Crysis, Wolfenstein, Dead Space
 Блогеры вместо СМИ
 Путешествие по сказкам. Блок-схема. 6 класс
 Массивы. Строки. Пользовательские типы.(Тема 3)
 Интерактивная компьютерная графика
 Кодирование и шифрование данных
 Мобильное рабочее место
 Электронные таблицы. Программа MS Excel
 Візуальна система формування набору об’єктів нерухомості на карті
 Создание и форматирование таблиц в текстовом редакторе
 Текстовые редакторы. Урок 10
 Создание веб-сайтов