- Confidence interval estimation

Содержание
- 2. Types of Estimates Point Estimate A single number used to estimate an unknown population parameter Interval
- 3. Point Estimates Estimate Population Parameters … with Sample Statistics Mean Standard deviation Variance Difference σ S
- 4. Point and Interval Estimates A point estimate is a single number, a confidence interval provides additional
- 5. Confidence Interval Estimate An interval gives a range of values: Takes into consideration the variation in
- 6. Confidence Level, (1-α) Suppose confidence level γ = 95% Also written γ =(1 - α) =
- 7. Estimation Process (mean, μ, is unknown) Population Random Sample Mean x = 50 Sample
- 8. General Formula The general formula for all confidence intervals is: Point Estimate ± (Critical Value)(Standard Error)
- 9. Confidence Intervals Population Mean σ Unknown Confidence Intervals σ Known
- 10. Confidence Interval for μ (σ Known) Assumptions Population standard deviation σ is known Population is normally
- 11. Confidence Level γ Confidence Coefficient, z value, 1.28 1.645 1.96 2.33 2.57 3.08 3.27 .80 .90
- 12. Finding the Critical Value Consider a 95% confidence interval: z.025= -1.96 z.025= 1.96 Point Estimate Lower
- 13. Margin of Error Margin of Error (e): the amount added and subtracted to the point estimate
- 14. Factors Affecting Margin of Error Data variation, σ : e as σ Sample size, n :
- 15. Example A sample of 11 circuits from a large normal population has a mean resistance of
- 16. Solution – To get a Z value use the NORMSINV function with p=γ+ alpha/2 for 95%
- 17. Interpretation We are γ=95% confident that the true mean resistance is between 1.9932 and 2.4068 ohms
- 18. If the population standard deviation σ is unknown, we can substitute the sample standard deviation, s
- 19. Student’s t Distribution t 0 t (df = 5) t (df = 13) t-distributions are bell-shaped
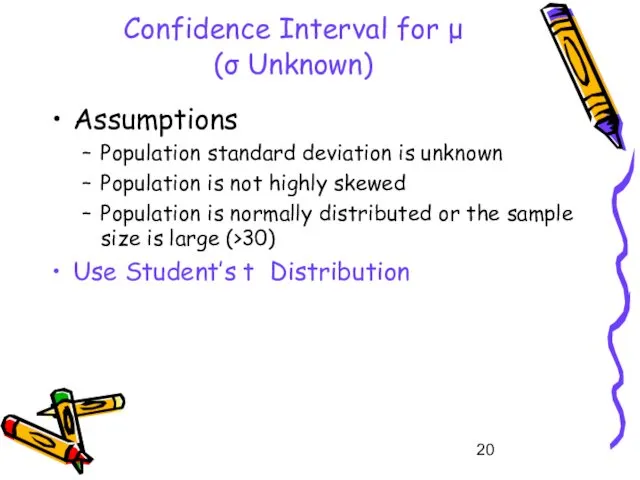
- 20. Confidence Interval for μ (σ Unknown) Assumptions Population standard deviation is unknown Population is not highly
- 21. Confidence Interval Estimate: where t is the critical value of the t-distribution with n-1 degrees of
- 22. Define tγ from equation γ – Confidence Coefficient. tγ - obtain with using Excel function TINV.
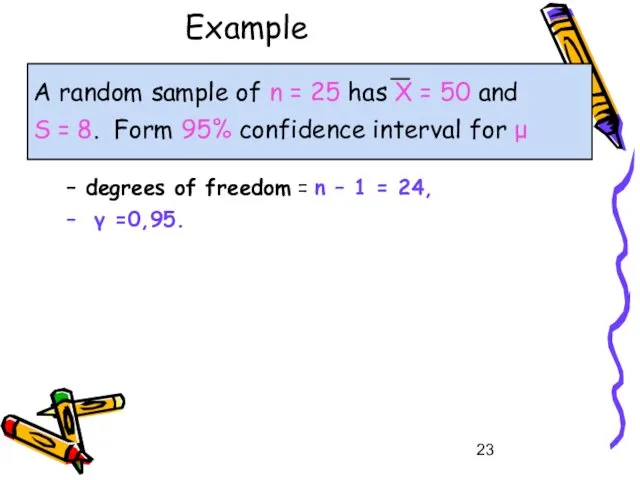
- 23. Example A random sample of n = 25 has X = 50 and S = 8.
- 24. To get a t - value use the TINV function. The value of alpha =(1-confidence) and
- 26. Definition Confidence Interval on the Variance and Standard Deviation of a Normal Distribution
- 27. Confidence Interval on the Variance and Standard Deviation of a Normal Distribution Probability density functions of
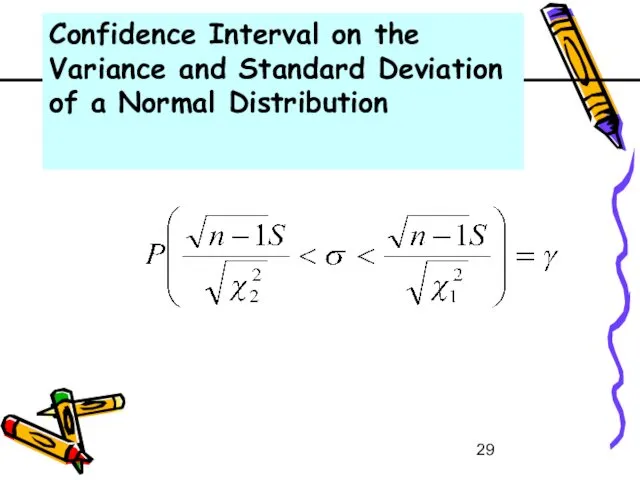
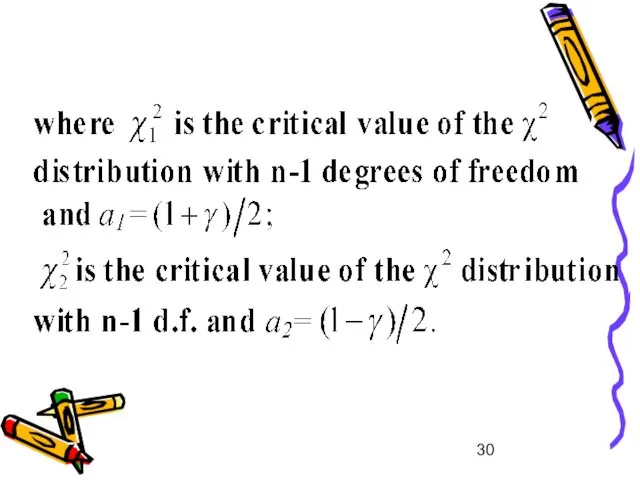
- 29. Confidence Interval on the Variance and Standard Deviation of a Normal Distribution
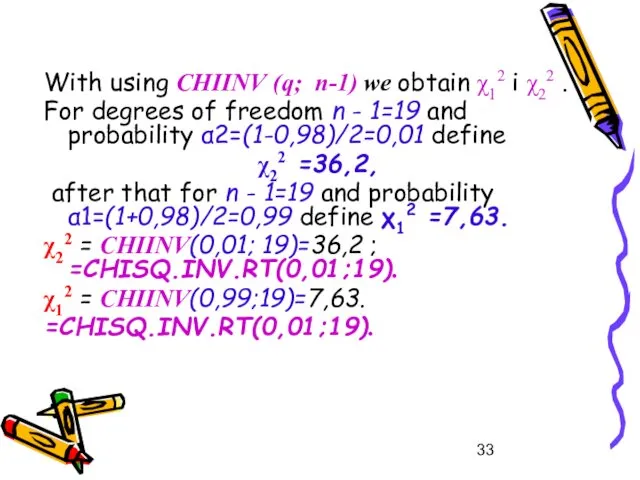
- 31. We can use χ2 –Table for solving next equation Or EXCEL function CHIINV (q; n-1), =CHISQ.INV.RT(q;n-1).
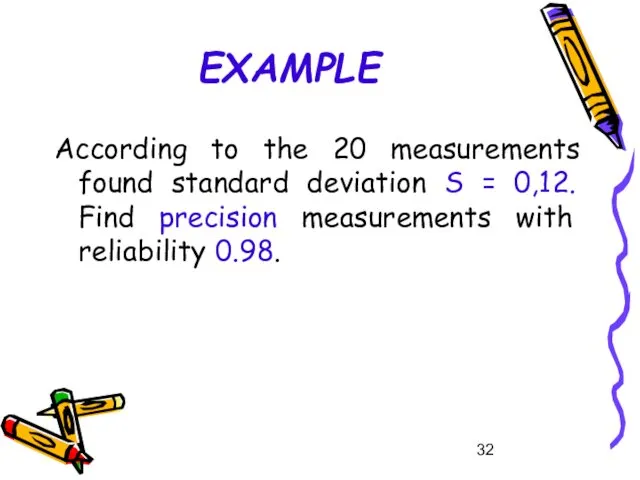
- 32. EXAMPLE According to the 20 measurements found standard deviation S = 0,12. Find precision measurements with
- 33. With using CHIINV (q; n-1) we obtain χ12 і χ22 . For degrees of freedom n
- 35. Скачать презентацию
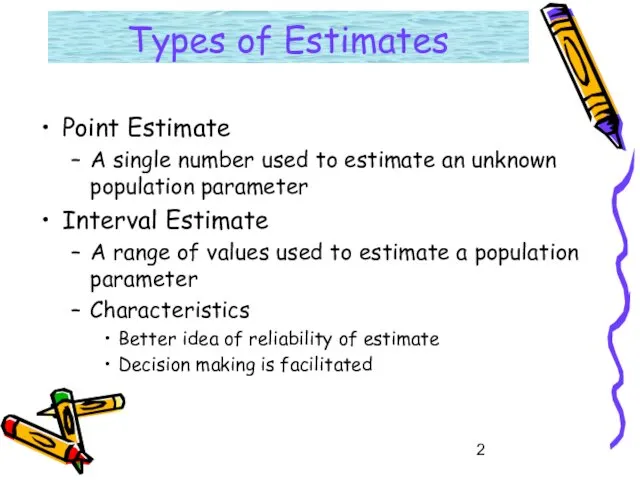
Types of Estimates
Point Estimate
A single number used to estimate an unknown
Types of Estimates
Point Estimate
A single number used to estimate an unknown
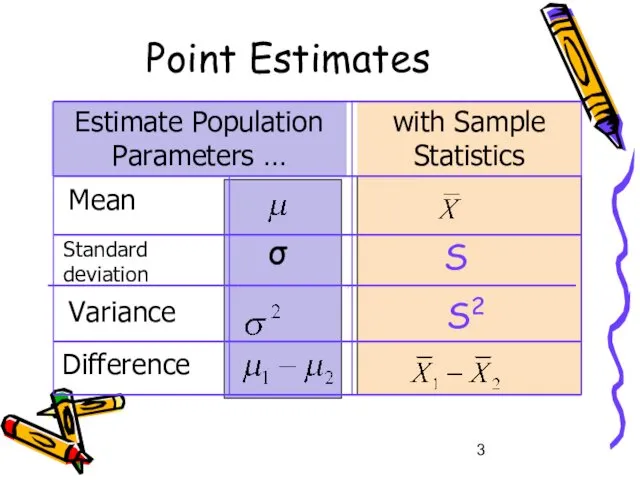
Point Estimates
Estimate Population
Parameters …
with Sample
Statistics
Mean
Standard
deviation
Variance
Difference
σ
S
S2
Point Estimates
Estimate Population
Parameters …
with Sample
Statistics
Mean
Standard
deviation
Variance
Difference
σ
S
S2
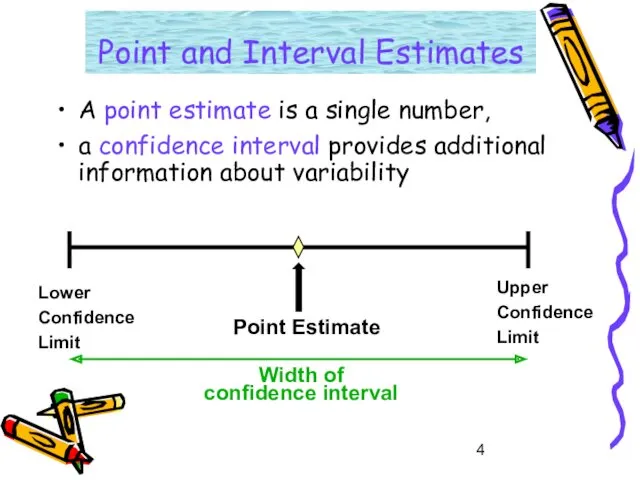
Point and Interval Estimates
A point estimate is a single number,
a
Point and Interval Estimates
A point estimate is a single number,
a
Confidence Interval Estimate
An interval gives a range of values:
Takes into consideration
Confidence Interval Estimate
An interval gives a range of values:
Takes into consideration
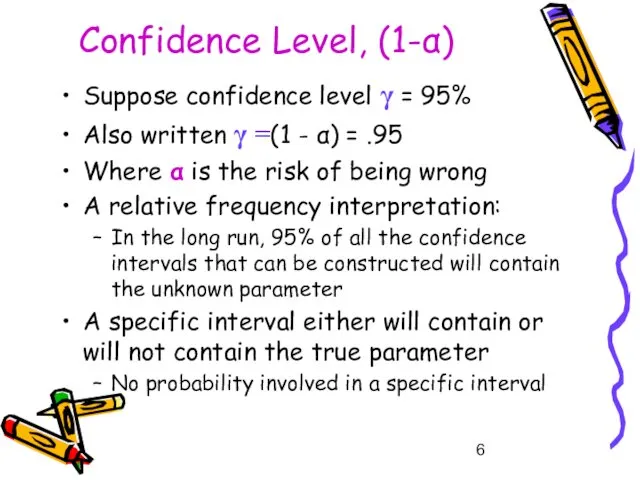
Confidence Level, (1-α)
Suppose confidence level γ = 95%
Also written γ
Confidence Level, (1-α)
Suppose confidence level γ = 95%
Also written γ
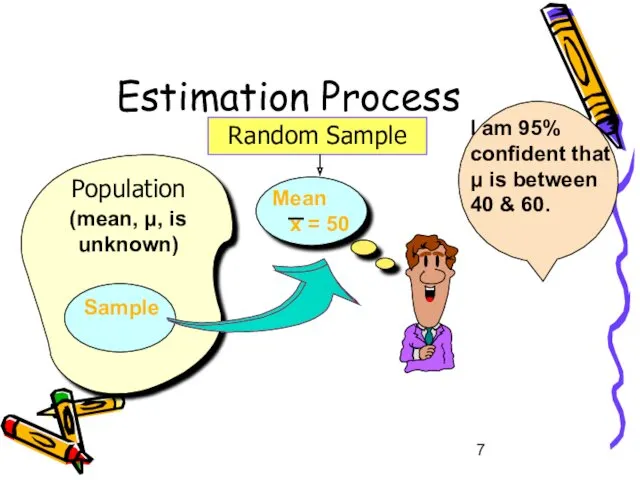
Estimation Process
(mean, μ, is unknown)
Population
Random Sample
Mean
x = 50
Sample
Estimation Process
(mean, μ, is unknown)
Population
Random Sample
Mean
x = 50
Sample
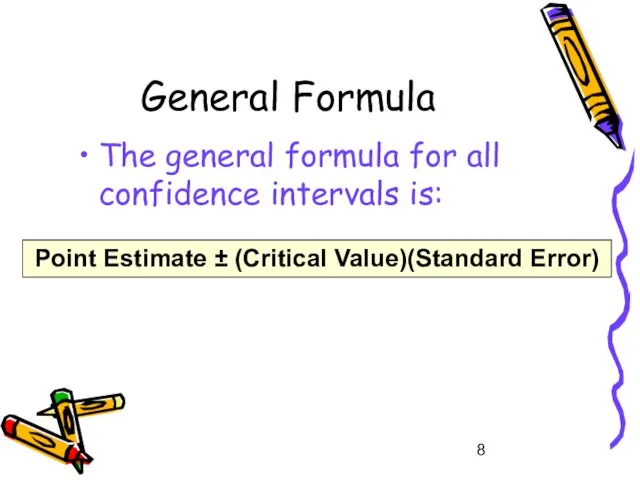
General Formula
The general formula for all confidence intervals is:
Point Estimate ±
General Formula
The general formula for all confidence intervals is:
Point Estimate ±
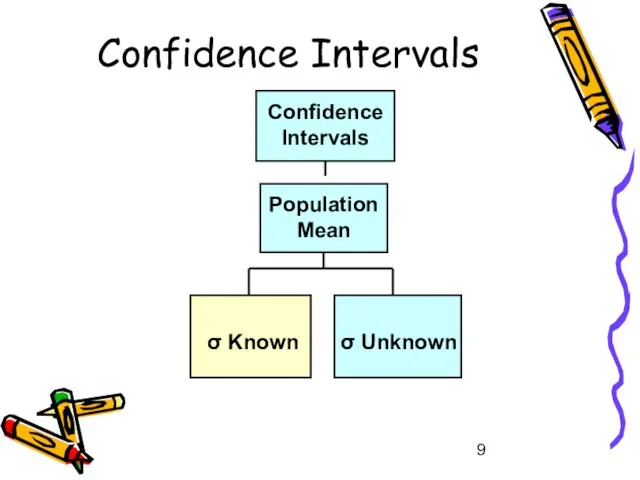
Confidence Intervals
Population
Mean
σ Unknown
Confidence
Intervals
σ Known
Confidence Intervals
Population
Mean
σ Unknown
Confidence
Intervals
σ Known
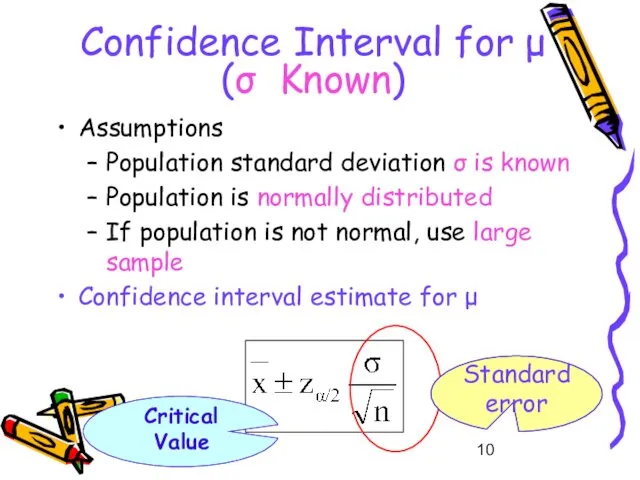
Confidence Interval for μ
(σ Known)
Assumptions
Population standard deviation σ is
Confidence Interval for μ
(σ Known)
Assumptions
Population standard deviation σ is
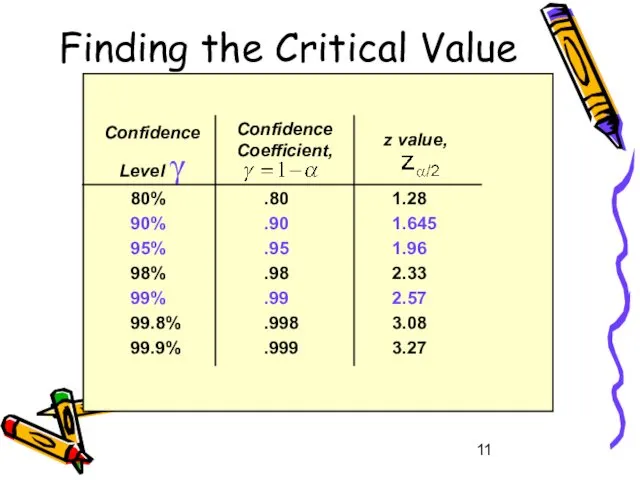
Confidence Level γ
Confidence Coefficient,
z value,
1.28
1.645
1.96
2.33
2.57
3.08
3.27
.80
.90
.95
.98
.99
.998
.999
80%
90%
95%
98%
99%
99.8%
99.9%
Finding the Critical Value
Confidence Level γ
Confidence Coefficient,
z value,
1.28
1.645
1.96
2.33
2.57
3.08
3.27
.80
.90
.95
.98
.99
.998
.999
80%
90%
95%
98%
99%
99.8%
99.9%
Finding the Critical Value
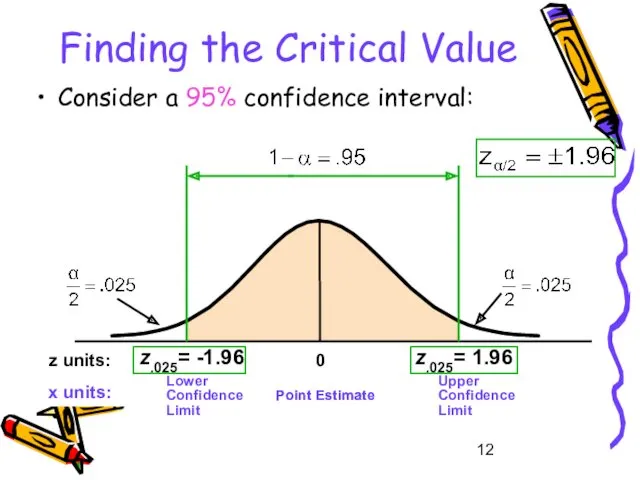
Finding the Critical Value
Consider a 95% confidence interval:
z.025= -1.96
z.025= 1.96
Point Estimate
Lower
Finding the Critical Value
Consider a 95% confidence interval:
z.025= -1.96
z.025= 1.96
Point Estimate
Lower
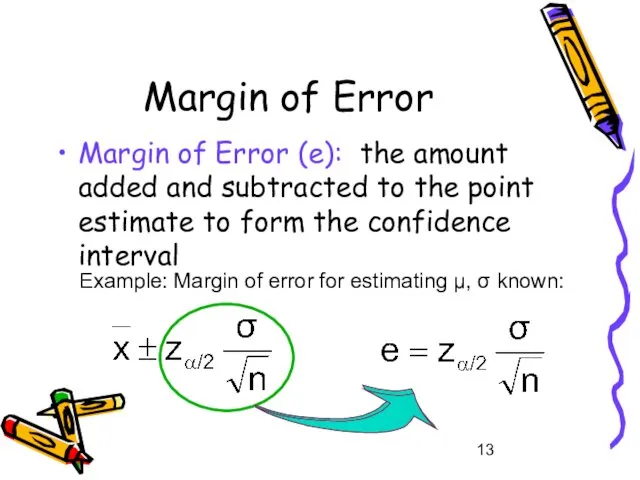
Margin of Error
Margin of Error (e): the amount added and subtracted
Margin of Error
Margin of Error (e): the amount added and subtracted
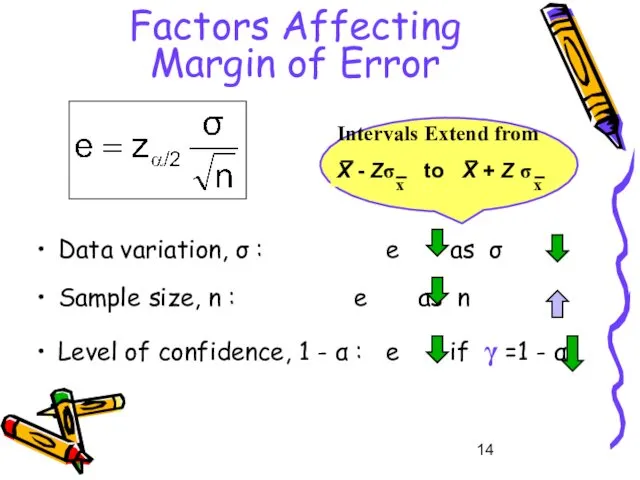
Factors Affecting
Margin of Error
Data variation, σ : e as σ
Factors Affecting
Margin of Error
Data variation, σ : e as σ
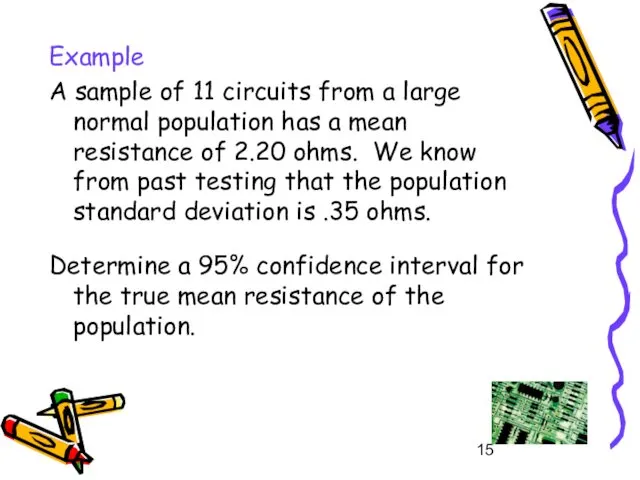
Example
A sample of 11 circuits from a large normal population has
Example
A sample of 11 circuits from a large normal population has
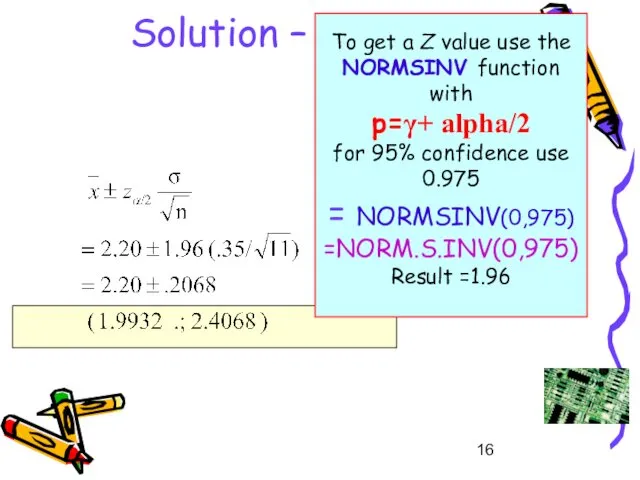
Solution –
To get a Z value use the NORMSINV function
Solution –
To get a Z value use the NORMSINV function
Interpretation
We are γ=95% confident that the true mean resistance is between
Interpretation
We are γ=95% confident that the true mean resistance is between
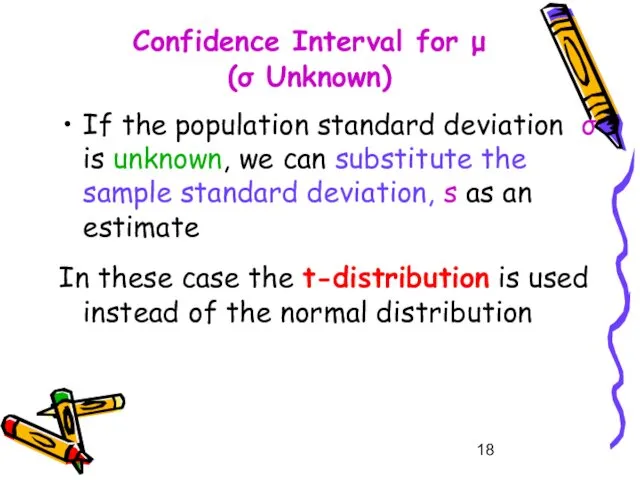
If the population standard deviation σ is unknown, we can substitute
If the population standard deviation σ is unknown, we can substitute
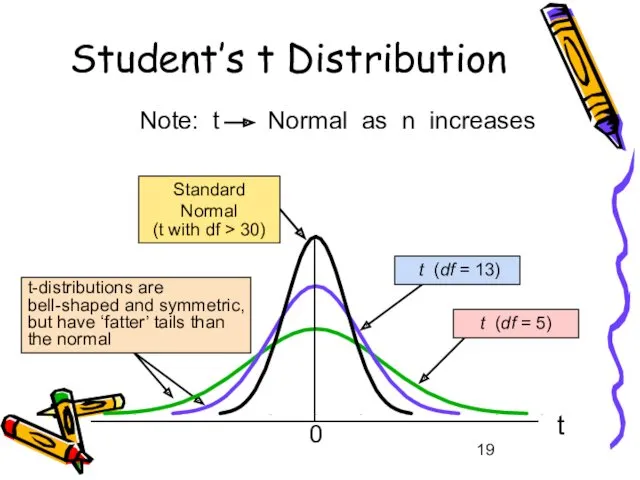
Student’s t Distribution
t
0
t (df = 5)
t (df = 13)
t-distributions are
Student’s t Distribution
t
0
t (df = 5)
t (df = 13)
t-distributions are
Confidence Interval for μ
(σ Unknown)
Assumptions
Population standard deviation is unknown
Population is
Confidence Interval for μ
(σ Unknown)
Assumptions
Population standard deviation is unknown
Population is
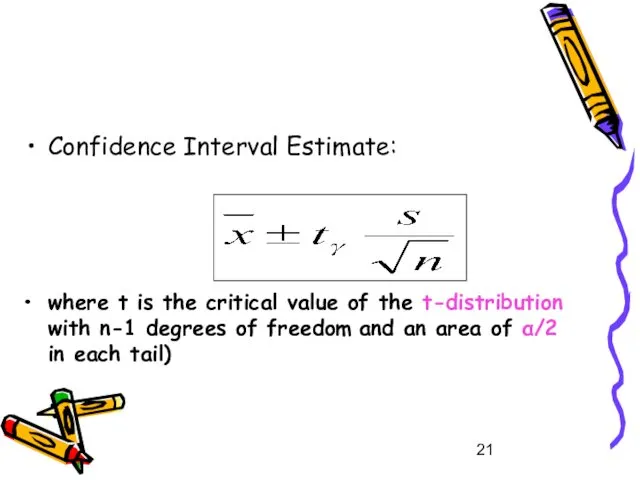
Confidence Interval Estimate:
where t is the critical value of the t-distribution
Confidence Interval Estimate:
where t is the critical value of the t-distribution

Define tγ from equation
γ – Confidence Coefficient.
tγ - obtain
Define tγ from equation
γ – Confidence Coefficient.
tγ - obtain
Example
A random sample of n = 25 has X = 50
Example
A random sample of n = 25 has X = 50
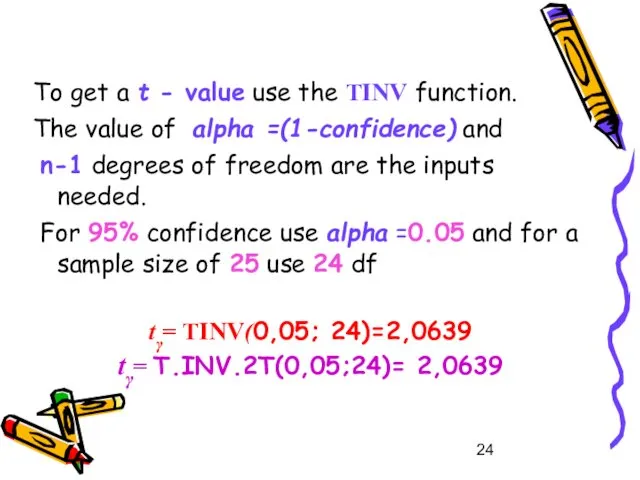
To get a t - value use the TINV function.
The
To get a t - value use the TINV function.
The

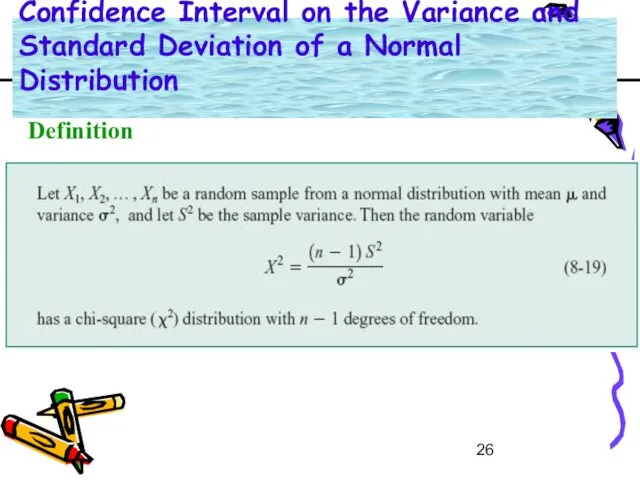
Definition
Confidence Interval on the Variance and Standard Deviation of a Normal
Definition
Confidence Interval on the Variance and Standard Deviation of a Normal
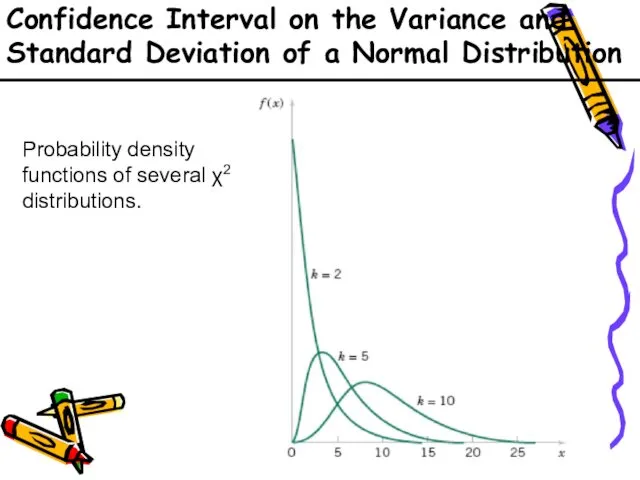
Confidence Interval on the Variance and Standard Deviation of a Normal
Confidence Interval on the Variance and Standard Deviation of a Normal

Confidence Interval on the Variance and Standard Deviation of a Normal
Confidence Interval on the Variance and Standard Deviation of a Normal
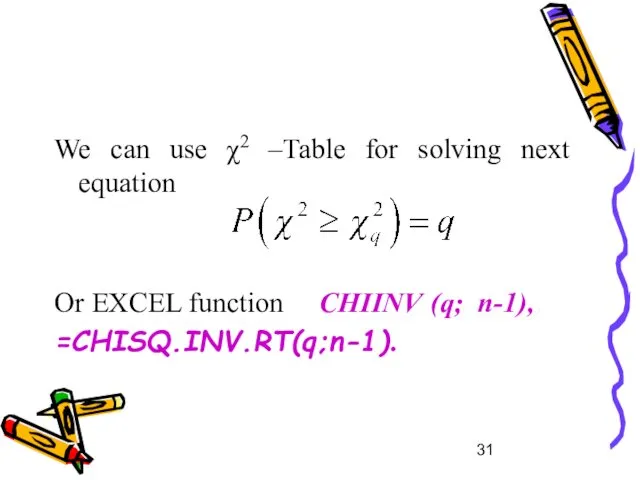
We can use χ2 –Table for solving next equation
Or EXCEL
We can use χ2 –Table for solving next equation
Or EXCEL
EXAMPLE
According to the 20 measurements found standard deviation S = 0,12.
EXAMPLE
According to the 20 measurements found standard deviation S = 0,12.
With using CHIINV (q; n-1) we obtain χ12 і χ22 .
With using CHIINV (q; n-1) we obtain χ12 і χ22 .
 Технология личностного ориентированного обучения на уроках математики
 Закрепление пройденного материала. 1 класс
 Chapter 3. Polynomial and Rational Functions. 3.4 Zeros of Polynomial Functions
 Фракталы и их виды
 Понятие действительного числа
 : Логические задачи с числами и цифрами. Магические квадраты.
 Математика 4 класс. Тест
 Теорема Пифагора. Египетский треугольник
 конспект урока математики в 3 классе ( с презентацией) Закрепление. Решение задач УМК Школа России
 Графикалық режім
 Математика в лицах. Великие математики
 таблица умножения и деления, задания тестового характера для интерактивной доски Диск
 Графическое представление статистической информации
 Математическое обеспечение САПР. Основные понятия и определения
 Тема 4. Сети Петри
 20231126_geometriya_9_klass_p.6
 Смешанные числа
 презентация для сообразительных
 Устный счёт 1 класс
 Информационно-исследовательский проект Магический куб
 Случайные величины и их характеристики. Лекция 5
 Свойства степени с целым показателем
 Модели стационарных рядов. АРСС-модели
 Дидактическая электронная игра
 Числовые и буквенные выражения
 Применение производной в физике
 Вычисления в пределах 100
 Конспект урока математике по теме:Умножение с числом 7, 3 класс.