- Correlation and regression

Содержание
- 2. Chapter Outline 9.1 Correlation 9.2 Linear Regression 9.3 Measures of Regression and Prediction Intervals 9.4 Multiple
- 3. Correlation Section 9.1
- 4. Section 9.1 Objectives Introduce linear correlation, independent and dependent variables, and the types of correlation Find
- 5. Correlation Correlation A relationship between two variables. The data can be represented by ordered pairs (x,
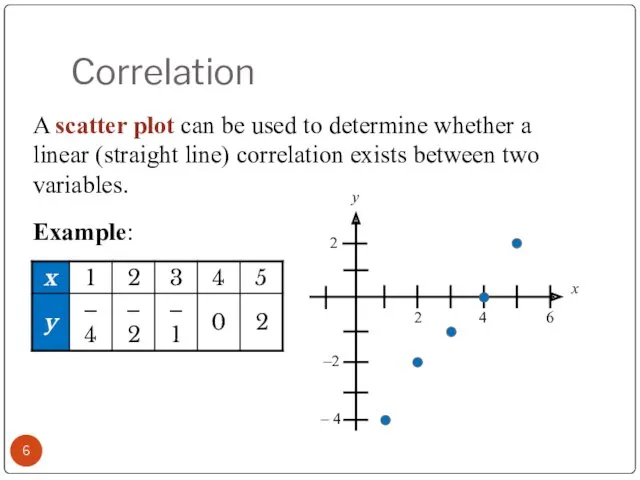
- 6. Correlation A scatter plot can be used to determine whether a linear (straight line) correlation exists
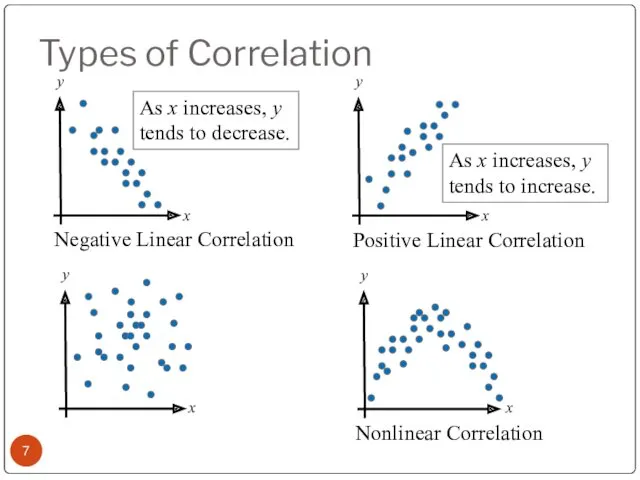
- 7. Types of Correlation Negative Linear Correlation Positive Linear Correlation Nonlinear Correlation As x increases, y tends
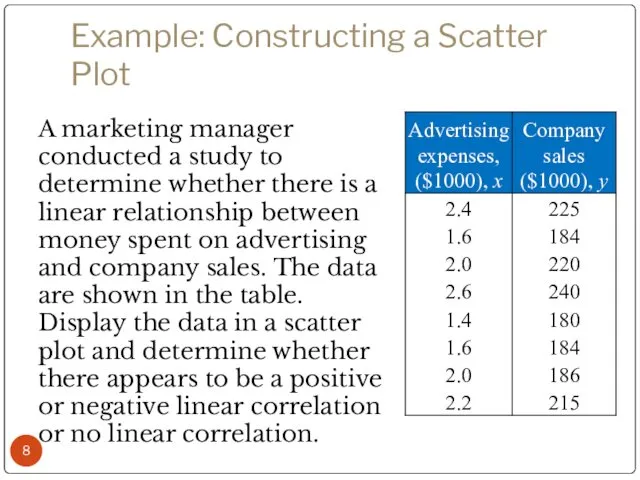
- 8. Example: Constructing a Scatter Plot A marketing manager conducted a study to determine whether there is
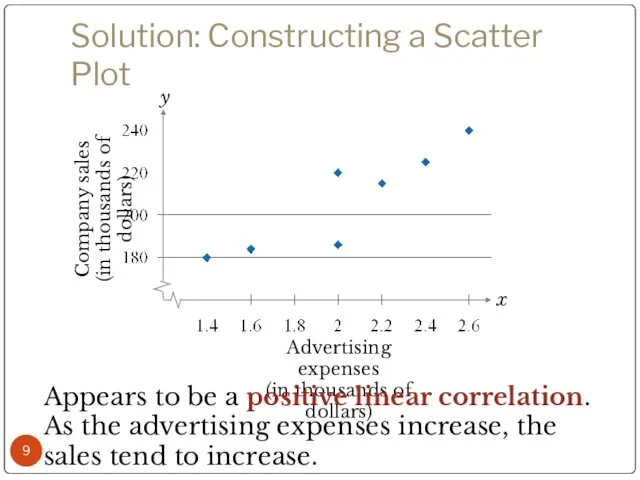
- 9. Solution: Constructing a Scatter Plot Appears to be a positive linear correlation. As the advertising expenses
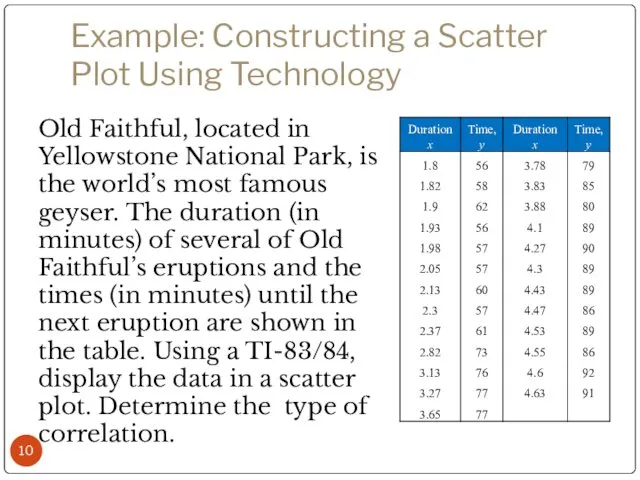
- 10. Example: Constructing a Scatter Plot Using Technology Old Faithful, located in Yellowstone National Park, is the
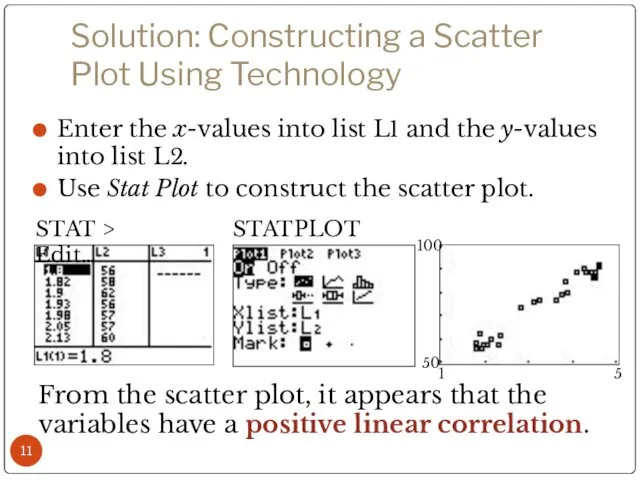
- 11. Solution: Constructing a Scatter Plot Using Technology Enter the x-values into list L1 and the y-values
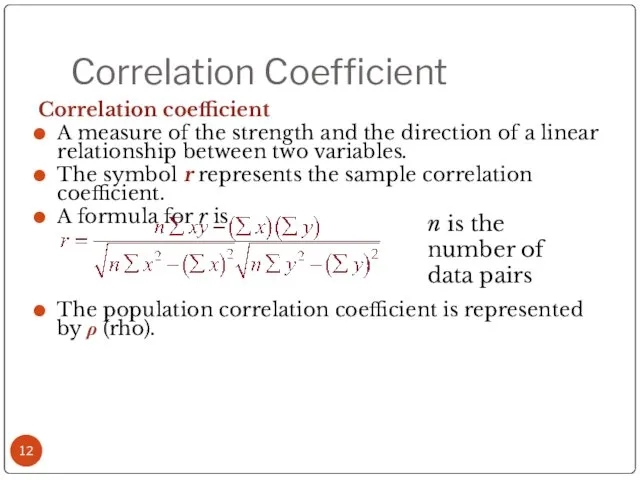
- 12. Correlation Coefficient Correlation coefficient A measure of the strength and the direction of a linear relationship
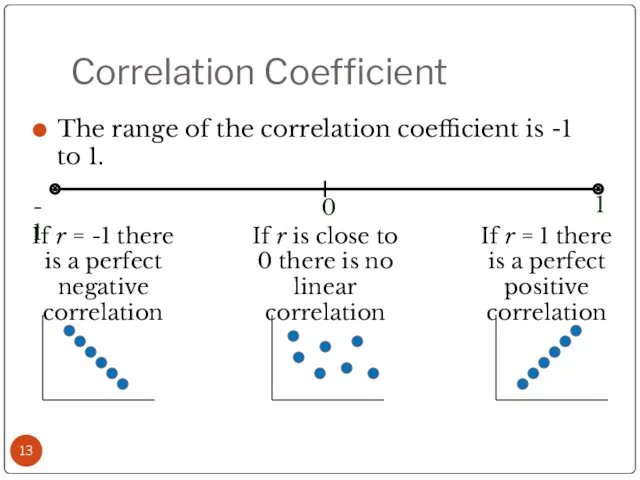
- 13. Correlation Coefficient The range of the correlation coefficient is -1 to 1. If r = -1
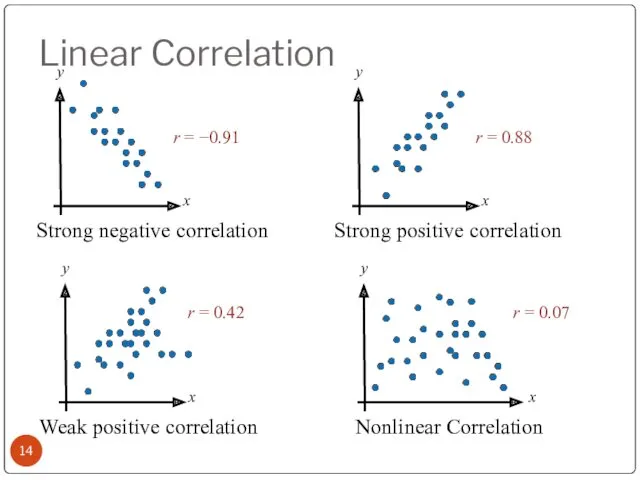
- 14. Linear Correlation Strong negative correlation Weak positive correlation Strong positive correlation Nonlinear Correlation r = −0.91
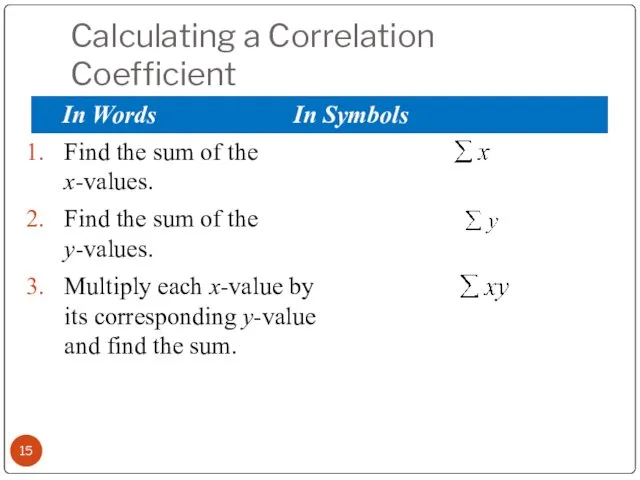
- 15. Calculating a Correlation Coefficient Find the sum of the x-values. Find the sum of the y-values.
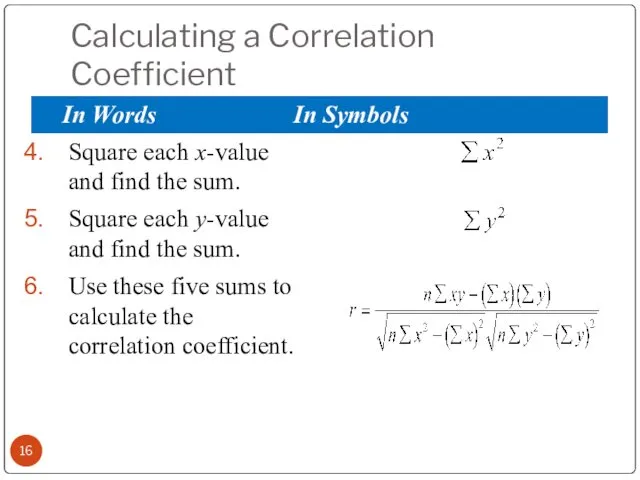
- 16. Calculating a Correlation Coefficient Square each x-value and find the sum. Square each y-value and find
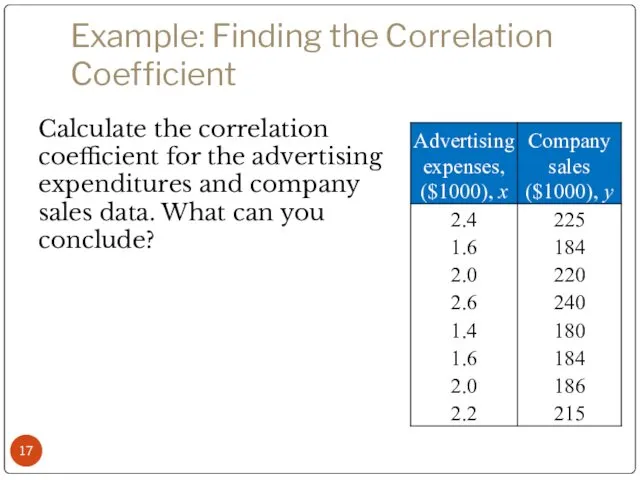
- 17. Example: Finding the Correlation Coefficient Calculate the correlation coefficient for the advertising expenditures and company sales
- 18. Solution: Finding the Correlation Coefficient 540 294.4 440 624 252 294.4 372 473 5.76 2.56 4
- 19. Solution: Finding the Correlation Coefficient Σx = 15.8 Σy = 1634 Σxy = 3289.8 Σx2 =
- 20. Example: Using Technology to Find a Correlation Coefficient Use a technology tool to calculate the correlation
- 21. Solution: Using Technology to Find a Correlation Coefficient STAT > Calc To calculate r, you must
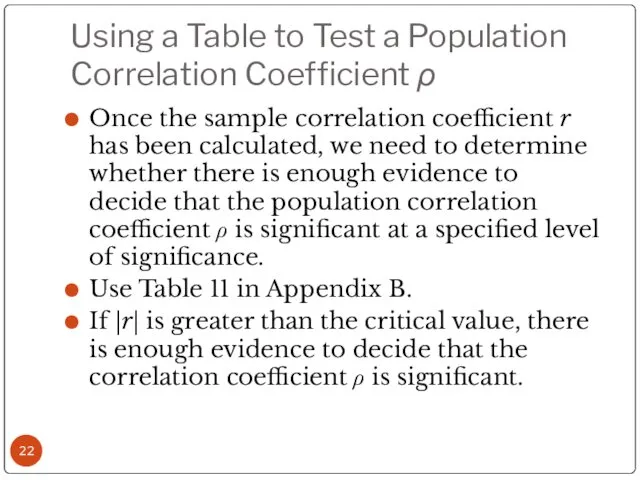
- 22. Using a Table to Test a Population Correlation Coefficient ρ Once the sample correlation coefficient r
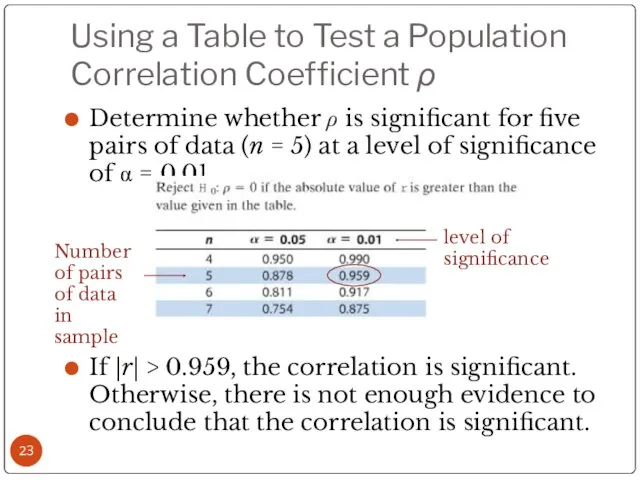
- 23. Using a Table to Test a Population Correlation Coefficient ρ Determine whether ρ is significant for
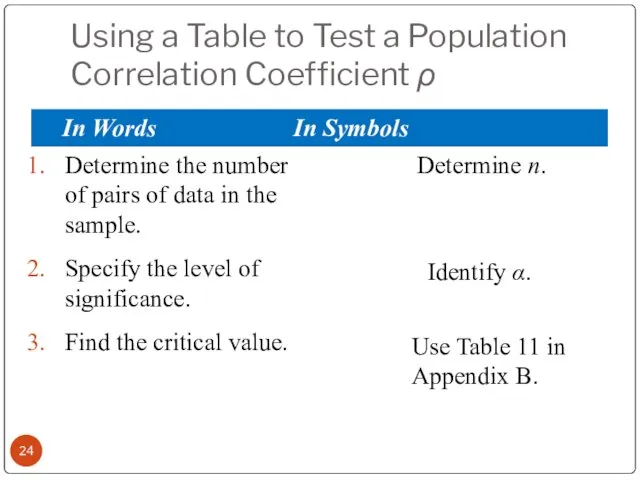
- 24. Using a Table to Test a Population Correlation Coefficient ρ Determine the number of pairs of
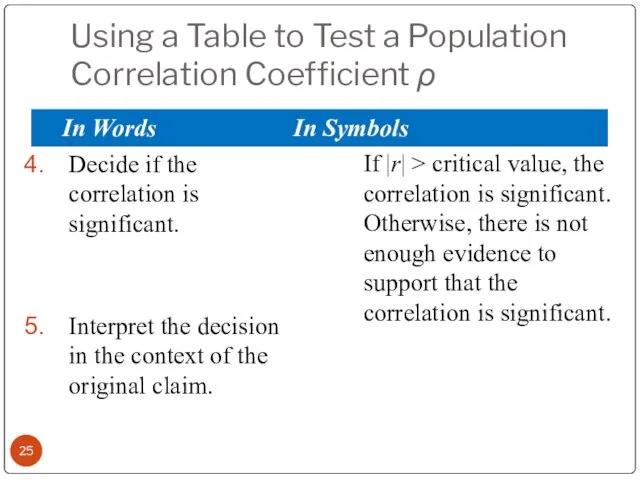
- 25. Using a Table to Test a Population Correlation Coefficient ρ In Words In Symbols Decide if
- 26. Example: Using a Table to Test a Population Correlation Coefficient ρ Using the Old Faithful data,
- 27. Solution: Using a Table to Test a Population Correlation Coefficient ρ n = 25, α =
- 28. Hypothesis Testing for a Population Correlation Coefficient ρ A hypothesis test can also be used to
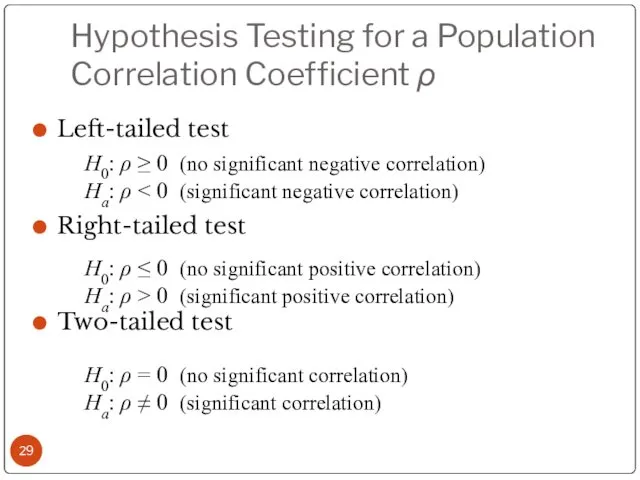
- 29. Hypothesis Testing for a Population Correlation Coefficient ρ Left-tailed test Right-tailed test Two-tailed test H0: ρ
- 30. The t-Test for the Correlation Coefficient Can be used to test whether the correlation between two
- 31. Using the t-Test for ρ State the null and alternative hypothesis. Specify the level of significance.
- 32. Using the t-Test for ρ Find the standardized test statistic. Make a decision to reject or
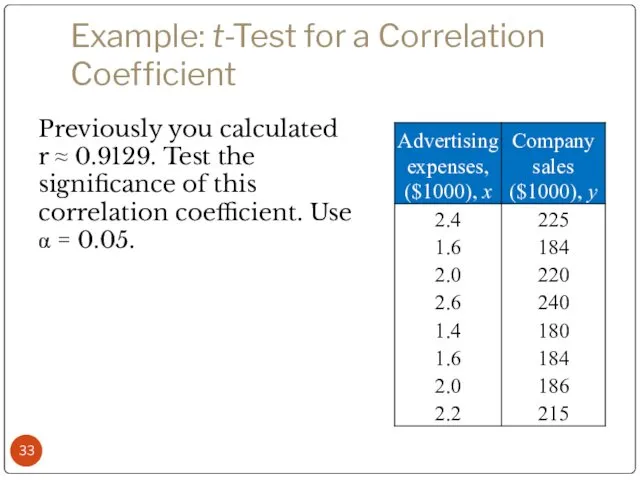
- 33. Example: t-Test for a Correlation Coefficient Previously you calculated r ≈ 0.9129. Test the significance of
- 34. Solution: t-Test for a Correlation Coefficient H0: Ha: α = d.f. = Rejection Region: Test Statistic:
- 35. Correlation and Causation The fact that two variables are strongly correlated does not in itself imply
- 36. Correlation and Causation Is there a reverse cause-and-effect relationship between the variables? Does y cause x?
- 38. Скачать презентацию
Chapter Outline
9.1 Correlation
9.2 Linear Regression
9.3 Measures of Regression and Prediction Intervals
9.4
Chapter Outline
9.1 Correlation
9.2 Linear Regression
9.3 Measures of Regression and Prediction Intervals
9.4
Correlation
Section 9.1
Correlation
Section 9.1
Section 9.1 Objectives
Introduce linear correlation, independent and dependent variables, and the
Section 9.1 Objectives
Introduce linear correlation, independent and dependent variables, and the
Correlation
Correlation
A relationship between two variables.
The data can be represented
Correlation
Correlation
A relationship between two variables.
The data can be represented
Correlation
A scatter plot can be used to determine whether a linear
Correlation
A scatter plot can be used to determine whether a linear
Types of Correlation
Negative Linear Correlation
Positive Linear Correlation
Nonlinear Correlation
As x increases, y
Types of Correlation
Negative Linear Correlation
Positive Linear Correlation
Nonlinear Correlation
As x increases, y
Example: Constructing a Scatter Plot
A marketing manager conducted a study to
Example: Constructing a Scatter Plot
A marketing manager conducted a study to
Solution: Constructing a Scatter Plot
Appears to be a positive linear correlation.
Solution: Constructing a Scatter Plot
Appears to be a positive linear correlation.
Example: Constructing a Scatter Plot Using Technology
Old Faithful, located in Yellowstone
Example: Constructing a Scatter Plot Using Technology
Old Faithful, located in Yellowstone
Solution: Constructing a Scatter Plot Using Technology
Enter the x-values into list
Solution: Constructing a Scatter Plot Using Technology
Enter the x-values into list
Correlation Coefficient
Correlation coefficient
A measure of the strength and the direction of
Correlation Coefficient
Correlation coefficient
A measure of the strength and the direction of
Correlation Coefficient
The range of the correlation coefficient is -1 to 1.
If
Correlation Coefficient
The range of the correlation coefficient is -1 to 1.
If
Linear Correlation
Strong negative correlation
Weak positive correlation
Strong positive correlation
Nonlinear Correlation
r = −0.91
r
Linear Correlation
Strong negative correlation
Weak positive correlation
Strong positive correlation
Nonlinear Correlation
r = −0.91
r
Calculating a Correlation Coefficient
Find the sum of the x-values.
Find the sum
Calculating a Correlation Coefficient
Find the sum of the x-values.
Find the sum
Calculating a Correlation Coefficient
Square each x-value and find the sum.
Square each
Calculating a Correlation Coefficient
Square each x-value and find the sum.
Square each
Example: Finding the Correlation Coefficient
Calculate the correlation coefficient for the advertising
Example: Finding the Correlation Coefficient
Calculate the correlation coefficient for the advertising
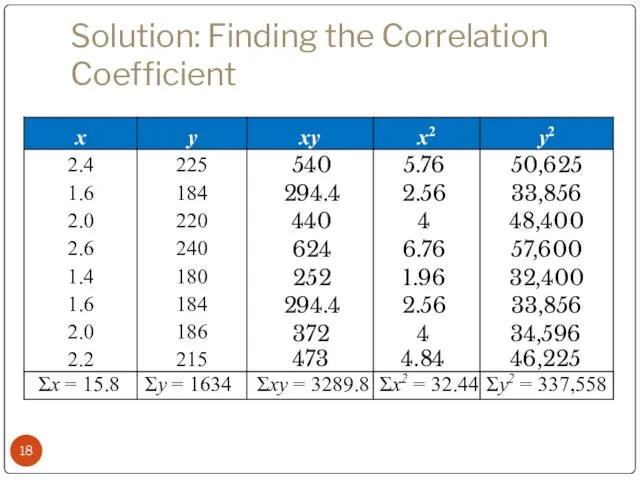
Solution: Finding the Correlation Coefficient
540
294.4
440
624
252
294.4
372
473
5.76
2.56
4
6.76
1.96
2.56
4
4.84
50,625
33,856
48,400
57,600
32,400
33,856
34,596
46,225
Σx = 15.8
Σy = 1634
Σxy = 3289.8
Σx2
Solution: Finding the Correlation Coefficient
540
294.4
440
624
252
294.4
372
473
5.76
2.56
4
6.76
1.96
2.56
4
4.84
50,625
33,856
48,400
57,600
32,400
33,856
34,596
46,225
Σx = 15.8
Σy = 1634
Σxy = 3289.8
Σx2
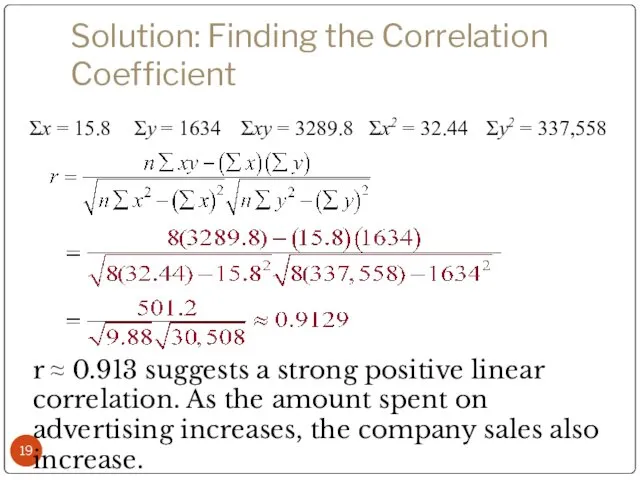
Solution: Finding the Correlation Coefficient
Σx = 15.8
Σy = 1634
Σxy = 3289.8
Σx2
Solution: Finding the Correlation Coefficient
Σx = 15.8
Σy = 1634
Σxy = 3289.8
Σx2
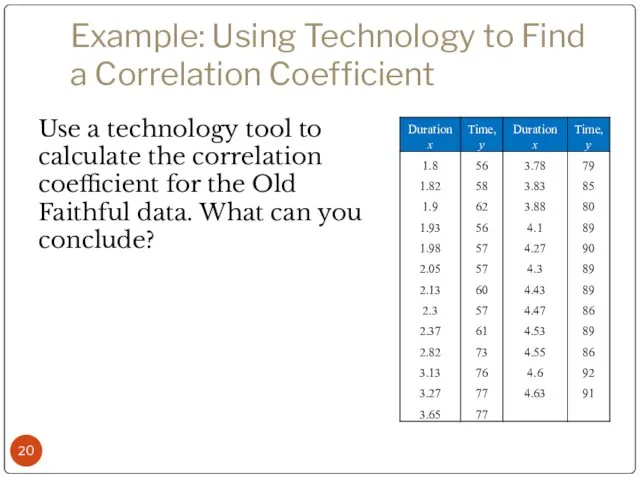
Example: Using Technology to Find a Correlation Coefficient
Use a technology tool
Example: Using Technology to Find a Correlation Coefficient
Use a technology tool
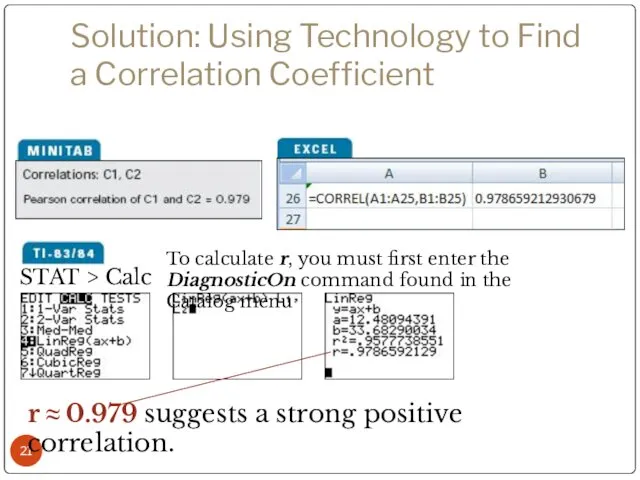
Solution: Using Technology to Find a Correlation Coefficient
STAT > Calc
To calculate
Solution: Using Technology to Find a Correlation Coefficient
STAT > Calc
To calculate
Using a Table to Test a Population Correlation Coefficient ρ
Once the
Using a Table to Test a Population Correlation Coefficient ρ
Once the
Using a Table to Test a Population Correlation Coefficient ρ
Determine whether
Using a Table to Test a Population Correlation Coefficient ρ
Determine whether
Using a Table to Test a Population Correlation Coefficient ρ
Determine the
Using a Table to Test a Population Correlation Coefficient ρ
Determine the
Using a Table to Test a Population Correlation Coefficient ρ
In
Using a Table to Test a Population Correlation Coefficient ρ
In
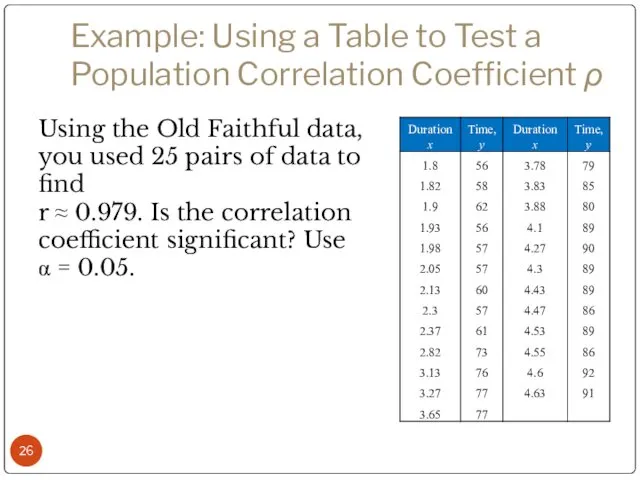
Example: Using a Table to Test a Population Correlation Coefficient ρ
Using
Example: Using a Table to Test a Population Correlation Coefficient ρ
Using
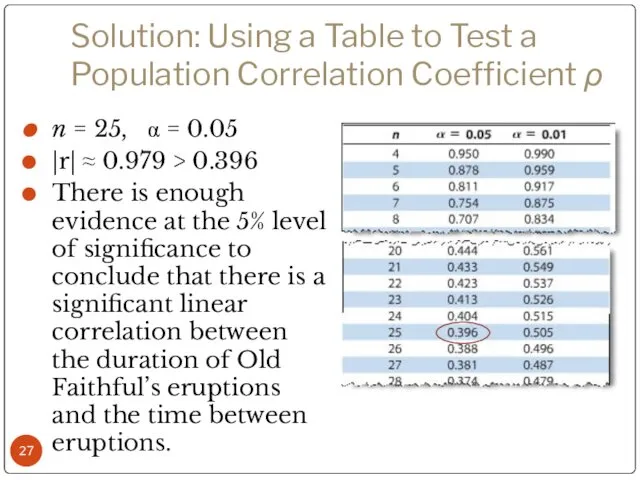
Solution: Using a Table to Test a Population Correlation Coefficient ρ
n
Solution: Using a Table to Test a Population Correlation Coefficient ρ
n
Hypothesis Testing for a Population Correlation Coefficient ρ
A hypothesis test can
Hypothesis Testing for a Population Correlation Coefficient ρ
A hypothesis test can
Hypothesis Testing for a Population Correlation Coefficient ρ
Left-tailed test
Right-tailed test
Two-tailed test
H0:
Hypothesis Testing for a Population Correlation Coefficient ρ
Left-tailed test
Right-tailed test
Two-tailed test
H0:
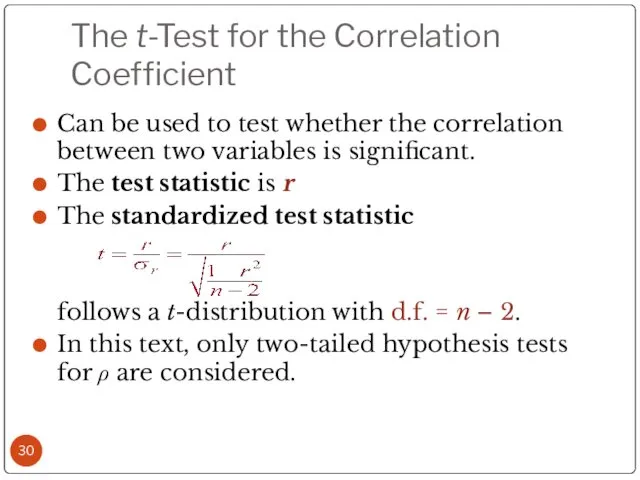
The t-Test for the Correlation Coefficient
Can be used to test whether
The t-Test for the Correlation Coefficient
Can be used to test whether
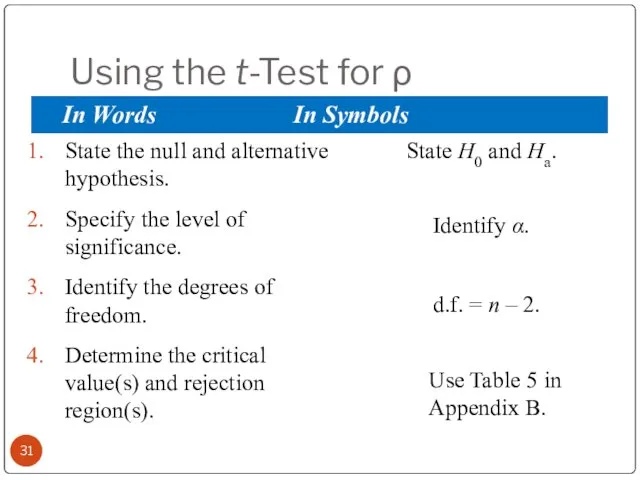
Using the t-Test for ρ
State the null and alternative hypothesis.
Specify the
Using the t-Test for ρ
State the null and alternative hypothesis.
Specify the
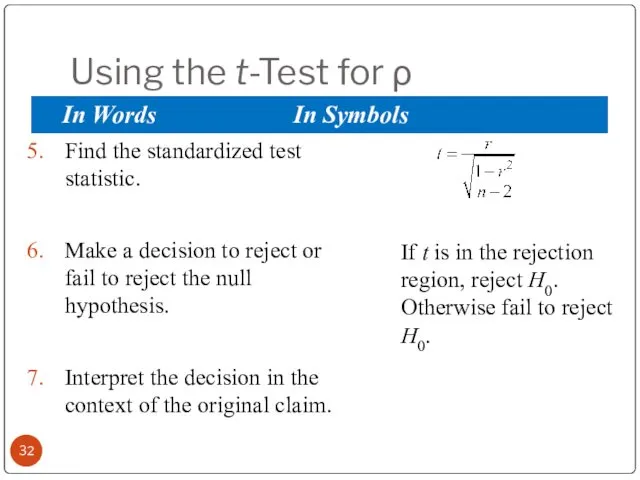
Using the t-Test for ρ
Find the standardized test statistic.
Make a decision
Using the t-Test for ρ
Find the standardized test statistic.
Make a decision
Example: t-Test for a Correlation Coefficient
Previously you calculated
r ≈ 0.9129.
Example: t-Test for a Correlation Coefficient
Previously you calculated r ≈ 0.9129.
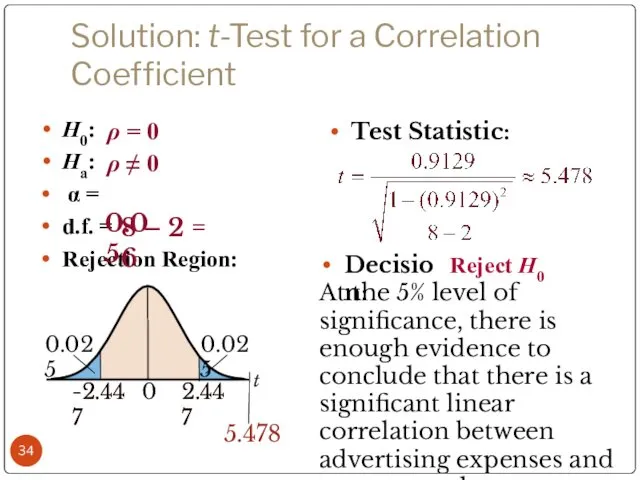
Solution: t-Test for a Correlation Coefficient
H0:
Ha:
α =
d.f. =
Rejection
Solution: t-Test for a Correlation Coefficient
H0:
Ha:
α =
d.f. =
Rejection
Correlation and Causation
The fact that two variables are strongly correlated does
Correlation and Causation
The fact that two variables are strongly correlated does
Correlation and Causation
Is there a reverse cause-and-effect relationship between the variables?
Does
Correlation and Causation
Is there a reverse cause-and-effect relationship between the variables?
Does
 Задачи на увеличение и уменьшение на несколько единиц
 Теорема синусов и косинусов
 Решение задач с помощью квадратных уравнений
 Работа учителя математики на уроке по подготовке к олимпиадам
 Линейная функция и её график
 Множества. Натуральные числа
 Сложение положительных и отрицательных чисел
 ОГЭ математика вариант 14
 Формулы сокращённого умножения. 7 класс
 Стереометрия. Аксиомы стереометрии
 Числовая окружность. Формулы
 Числа великаны. Сферы применения
 Действия с обыкновенными дробями. Урок-сказка
 Циклические алгоритмы. Основной и вспомогательный алгоритм
 Организация проведения логико-математических игр в старшем дошкольном возрасте
 Геометрические задачи
 Функция. График функции. (7 класс)
 Легкая разминка для урока математики
 Математика и жизнь
 Числовые последовательности
 Периметр квадрата и прямоугольника. Презентация.
 Презентация к уроку математики во 2 классе
 Устный счёт (сорбонка, математика 1 класс)
 Меры длины
 История метрической системы мер
 Прямоугольник. Свойство прямоугольника
 Проценты в жизни человека. 5 класс
 Экономические задачи в заданиях ЕГЭ по математике