- Hypothesis Testing with Two Samples

Содержание
- 2. Chapter Outline 8.1 Testing the Difference Between Means (Large Independent Samples) 8.2 Testing the Difference Between
- 3. Section 8.1 Testing the Difference Between Means (Large Independent Samples) Larson/Farber 4th ed
- 4. Section 8.1 Objectives Determine whether two samples are independent or dependent Perform a two-sample z-test for
- 5. Two Sample Hypothesis Test Compares two parameters from two populations. Sampling methods: Independent Samples The sample
- 6. Independent and Dependent Samples Independent Samples Sample 1 Sample 2 Dependent Samples Sample 1 Sample 2
- 7. Example: Independent and Dependent Samples Classify the pair of samples as independent or dependent. Sample 1:
- 8. Example: Independent and Dependent Samples Classify the pair of samples as independent or dependent. Sample 1:
- 9. Two Sample Hypothesis Test with Independent Samples Null hypothesis H0 A statistical hypothesis that usually states
- 10. Two Sample Hypothesis Test with Independent Samples H0: μ1 = μ2 Ha: μ1 ≠ μ2 H0:
- 11. Two Sample z-Test for the Difference Between Means Three conditions are necessary to perform a z-test
- 12. Two Sample z-Test for the Difference Between Means If these requirements are met, the sampling distribution
- 13. Two Sample z-Test for the Difference Between Means Test statistic is The standardized test statistic is
- 14. Using a Two-Sample z-Test for the Difference Between Means (Large Independent Samples) State the claim mathematically.
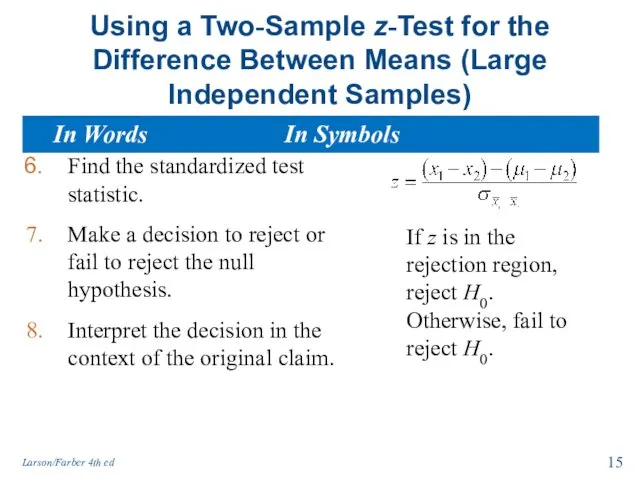
- 15. Using a Two-Sample z-Test for the Difference Between Means (Large Independent Samples) Find the standardized test
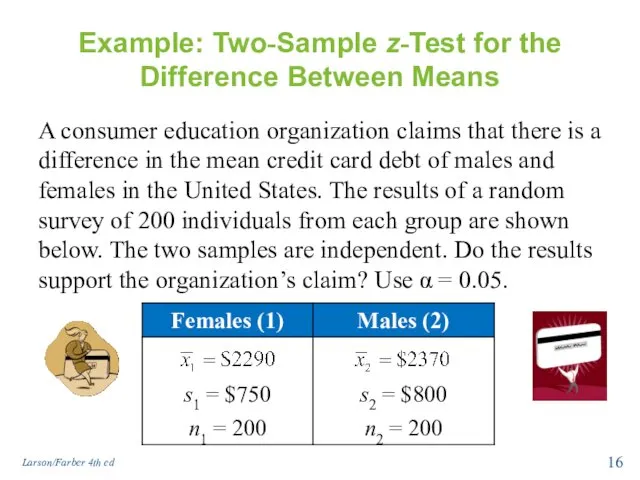
- 16. Example: Two-Sample z-Test for the Difference Between Means A consumer education organization claims that there is
- 17. Solution: Two-Sample z-Test for the Difference Between Means H0: Ha: α = n1= , n2 =
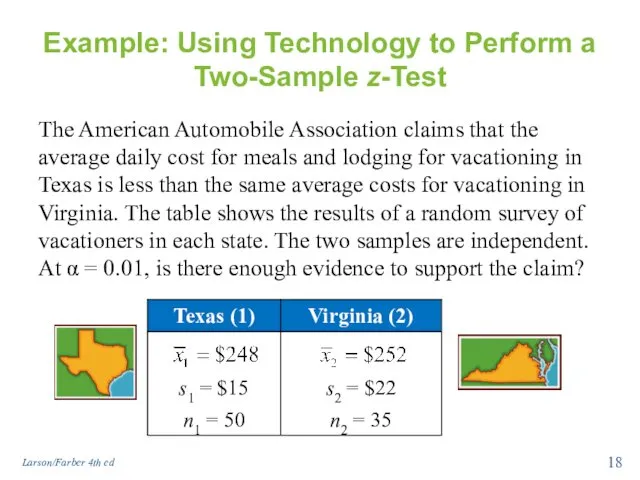
- 18. Example: Using Technology to Perform a Two-Sample z-Test The American Automobile Association claims that the average
- 19. Solution: Using Technology to Perform a Two-Sample z-Test H0: Ha: TI-83/84set up: Calculate: Draw: Larson/Farber 4th
- 20. Solution: Using Technology to Perform a Two-Sample z-Test Decision: At the 1% level of significance, there
- 21. Section 8.1 Summary Determined whether two samples are independent or dependent Performed a two-sample z-test for
- 22. Section 8.2 Testing the Difference Between Means (Small Independent Samples) Larson/Farber 4th ed
- 23. Section 8.2 Objectives Perform a t-test for the difference between two means μ1 and μ2 using
- 24. Two Sample t-Test for the Difference Between Means If samples of size less than 30 are
- 25. Two Sample t-Test for the Difference Between Means The standardized test statistic is The standard error
- 26. The standard error for the sampling distribution of is Two Sample t-Test for the Difference Between
- 27. Variances are not equal If the population variances are not equal, then the standard error is
- 28. Normal or t-Distribution? Are both sample sizes at least 30? Are both populations normally distributed? You
- 29. Two-Sample t-Test for the Difference Between Means (Small Independent Samples) State the claim mathematically. Identify the
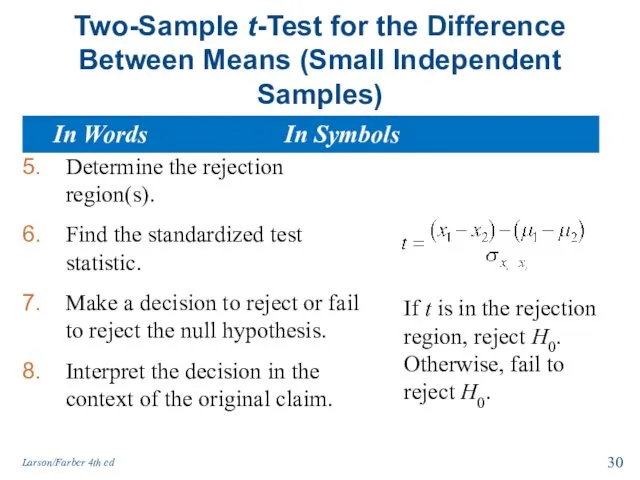
- 30. Two-Sample t-Test for the Difference Between Means (Small Independent Samples) Determine the rejection region(s). Find the
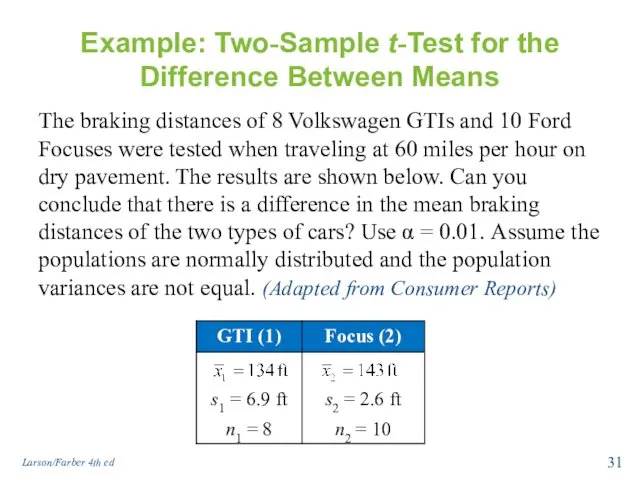
- 31. Example: Two-Sample t-Test for the Difference Between Means The braking distances of 8 Volkswagen GTIs and
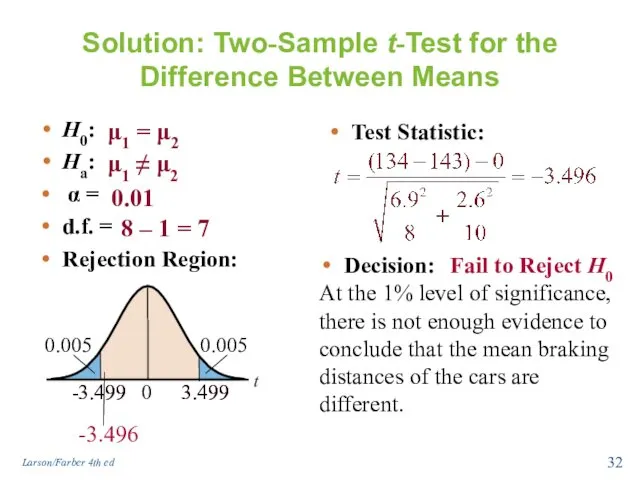
- 32. Solution: Two-Sample t-Test for the Difference Between Means H0: Ha: α = d.f. = Rejection Region:
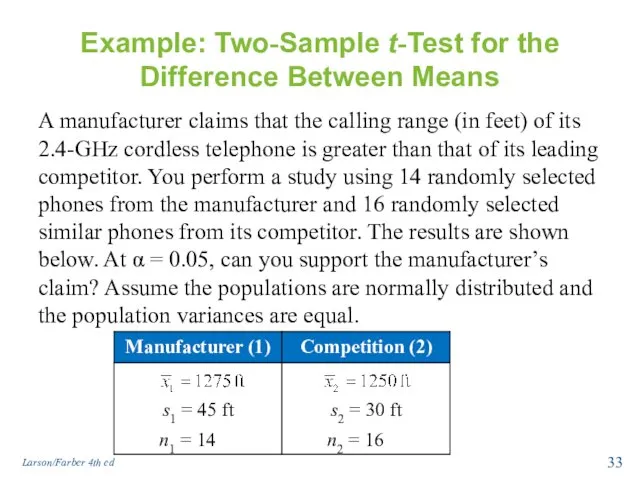
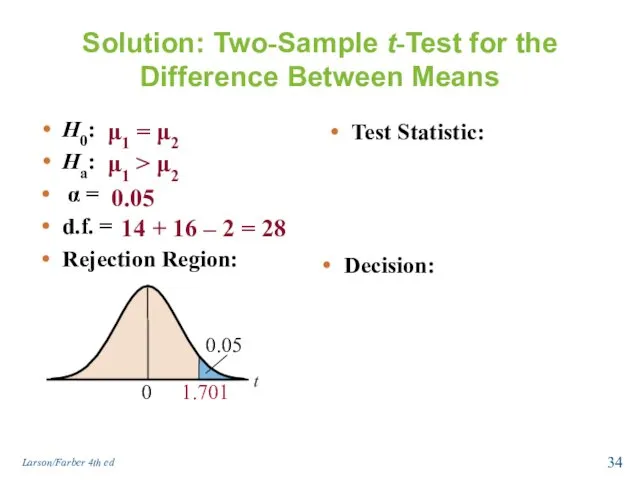
- 33. Example: Two-Sample t-Test for the Difference Between Means A manufacturer claims that the calling range (in
- 34. Solution: Two-Sample t-Test for the Difference Between Means H0: Ha: α = d.f. = Rejection Region:
- 35. Solution: Two-Sample t-Test for the Difference Between Means Larson/Farber 4th ed
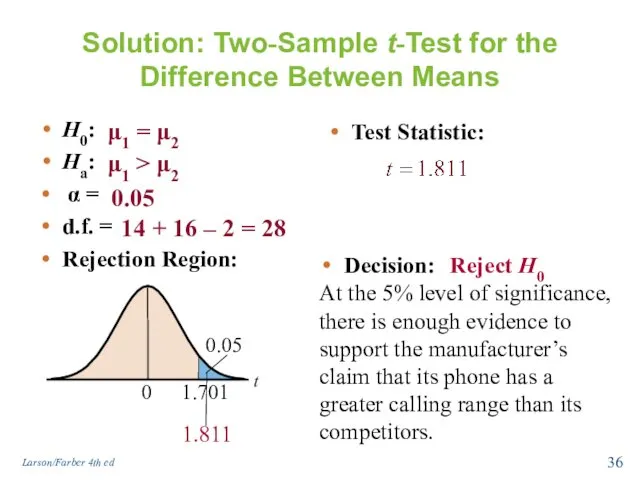
- 36. Solution: Two-Sample t-Test for the Difference Between Means H0: Ha: α = d.f. = Rejection Region:
- 37. Section 8.2 Summary Performed a t-test for the difference between two means μ1 and μ2 using
- 38. Section 8.3 Testing the Difference Between Means (Dependent Samples) Larson/Farber 4th ed
- 39. Section 8.3 Objectives Perform a t-test to test the mean of the difference for a population
- 40. The test statistic is the mean of these differences. t-Test for the Difference Between Means To
- 41. t-Test for the Difference Between Means Three conditions are required to conduct the test. The samples
- 42. Symbols used for the t-Test for μd The number of pairs of data The difference between
- 43. Symbols used for the t-Test for μd The mean of the differences between the paired data
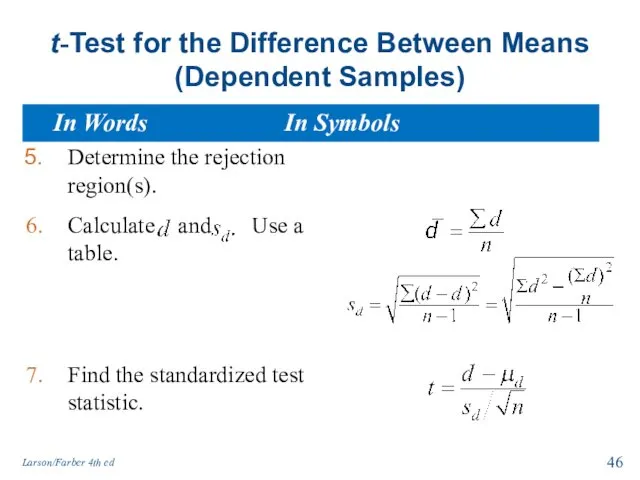
- 44. t-Test for the Difference Between Means The test statistic is The standardized test statistic is The
- 45. t-Test for the Difference Between Means (Dependent Samples) State the claim mathematically. Identify the null and
- 46. t-Test for the Difference Between Means (Dependent Samples) Determine the rejection region(s). Calculate and Use a
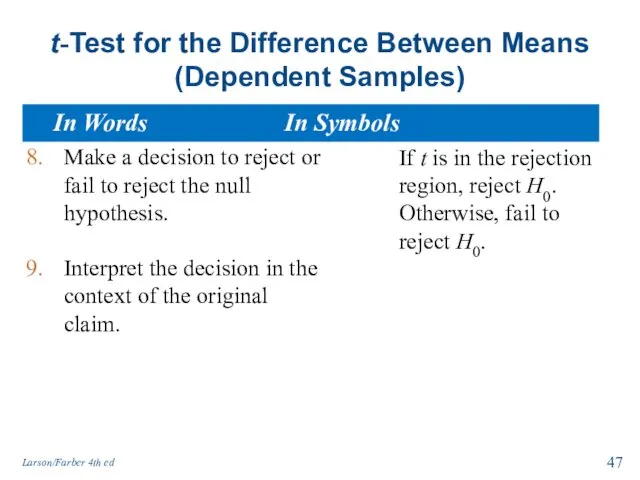
- 47. t-Test for the Difference Between Means (Dependent Samples) Make a decision to reject or fail to
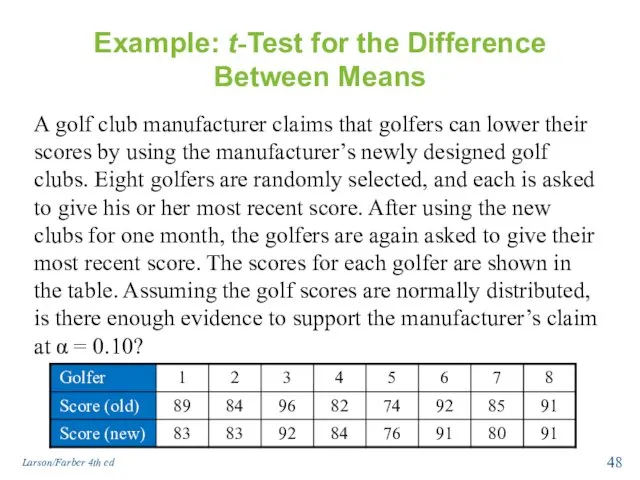
- 48. Example: t-Test for the Difference Between Means A golf club manufacturer claims that golfers can lower
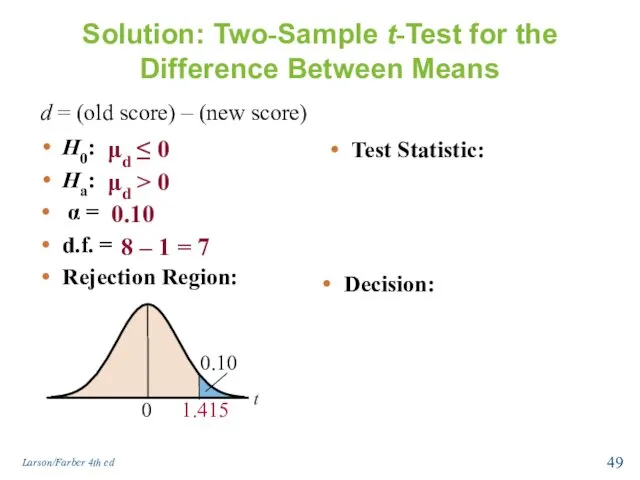
- 49. Solution: Two-Sample t-Test for the Difference Between Means H0: Ha: α = d.f. = Rejection Region:
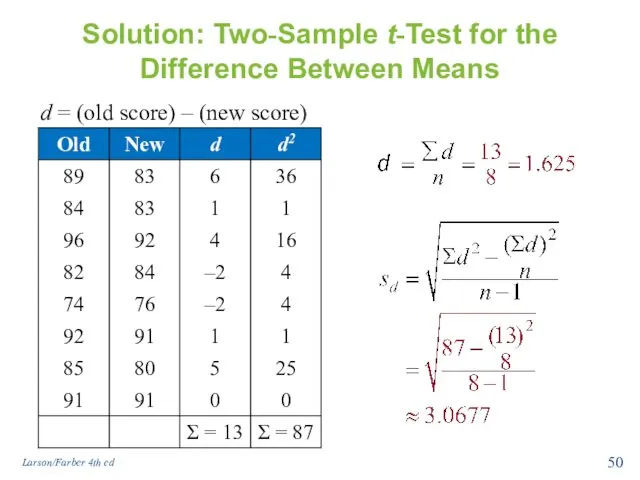
- 50. Solution: Two-Sample t-Test for the Difference Between Means d = (old score) – (new score) Larson/Farber
- 51. Solution: Two-Sample t-Test for the Difference Between Means H0: Ha: α = d.f. = Rejection Region:
- 52. Section 8.3 Summary Performed a t-test to test the mean of the difference for a population
- 53. Section 8.4 Testing the Difference Between Proportions Larson/Farber 4th ed
- 54. Section 8.4 Objectives Perform a z-test for the difference between two population proportions p1 and p2
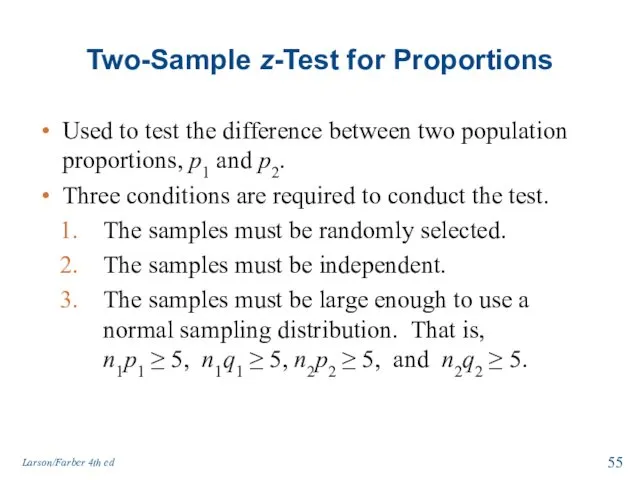
- 55. Two-Sample z-Test for Proportions Used to test the difference between two population proportions, p1 and p2.
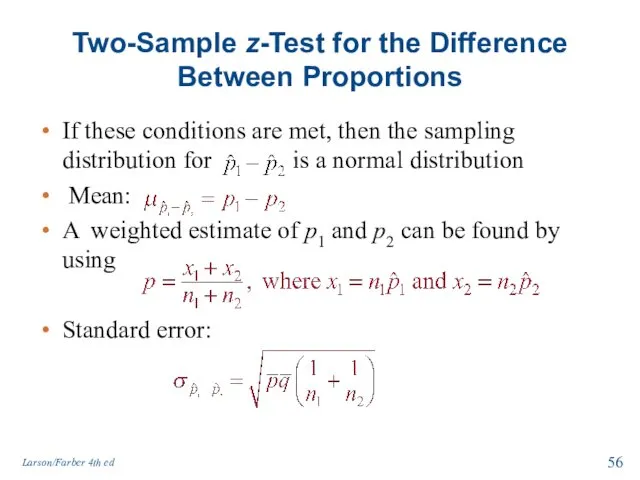
- 56. Two-Sample z-Test for the Difference Between Proportions If these conditions are met, then the sampling distribution
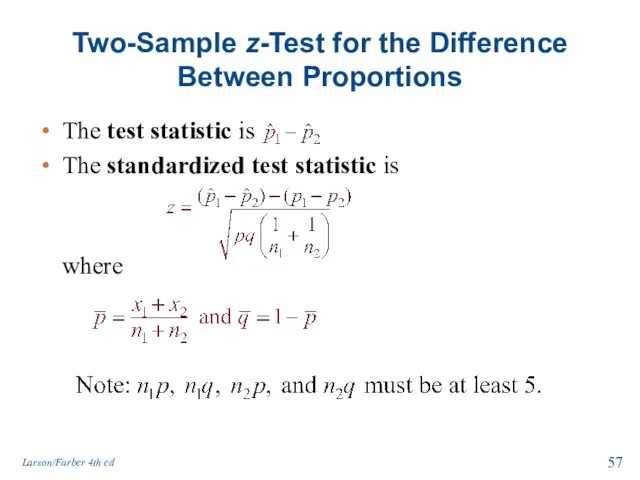
- 57. Two-Sample z-Test for the Difference Between Proportions The test statistic is The standardized test statistic is
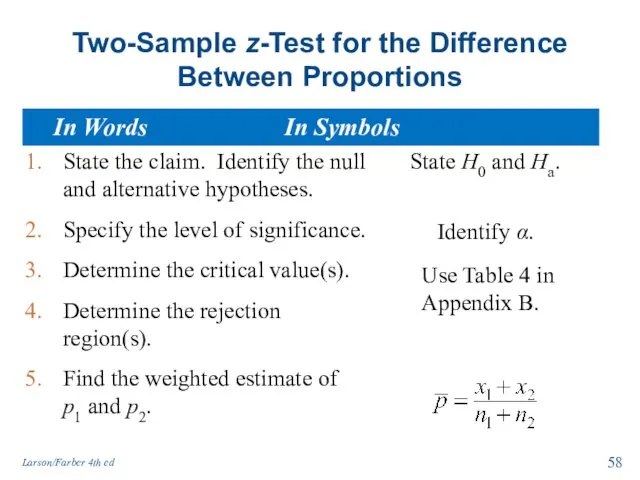
- 58. Two-Sample z-Test for the Difference Between Proportions State the claim. Identify the null and alternative hypotheses.
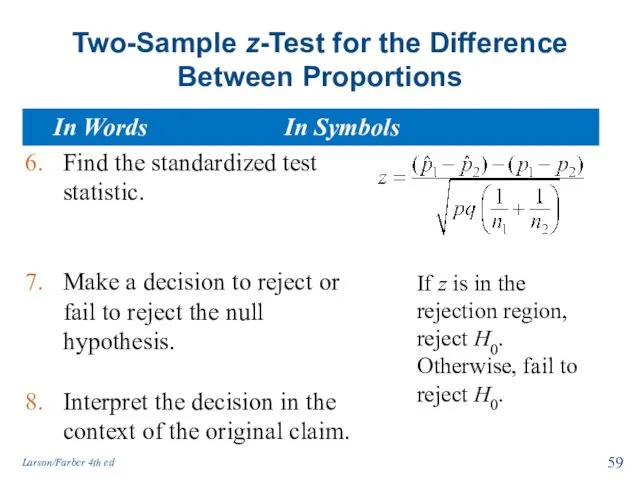
- 59. Two-Sample z-Test for the Difference Between Proportions Find the standardized test statistic. Make a decision to
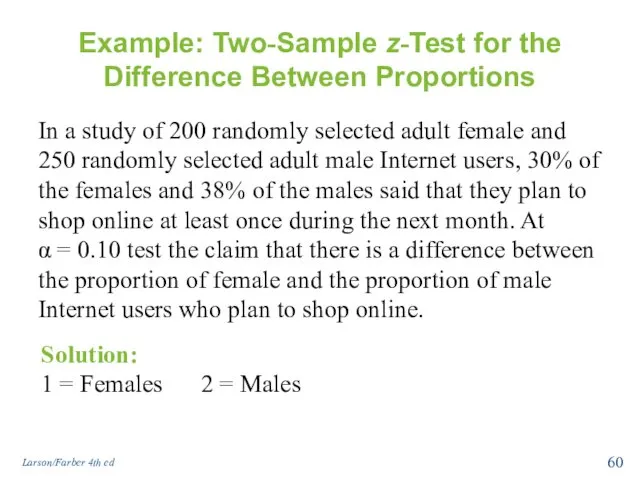
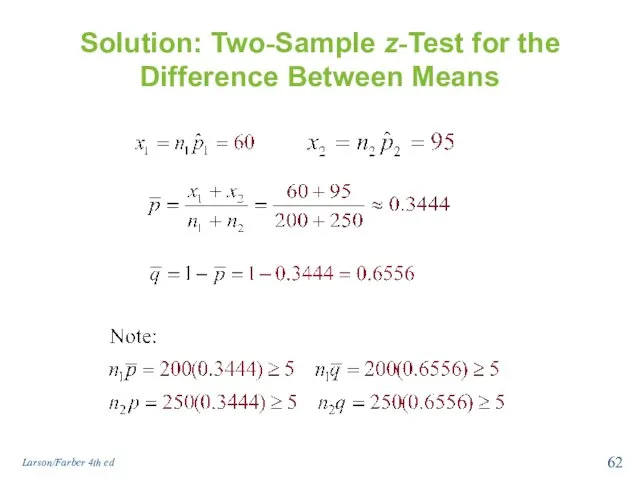
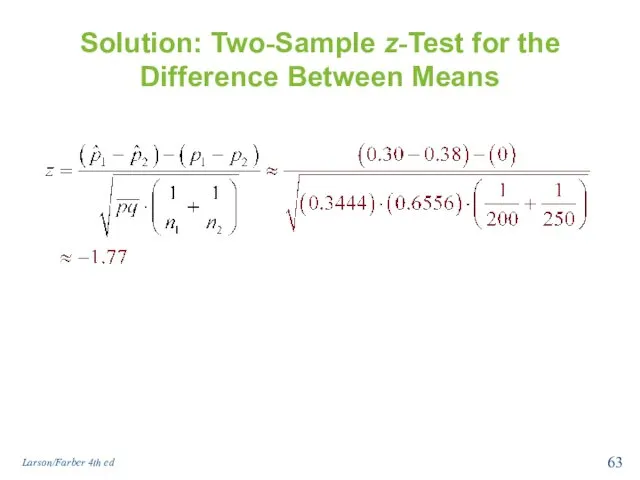
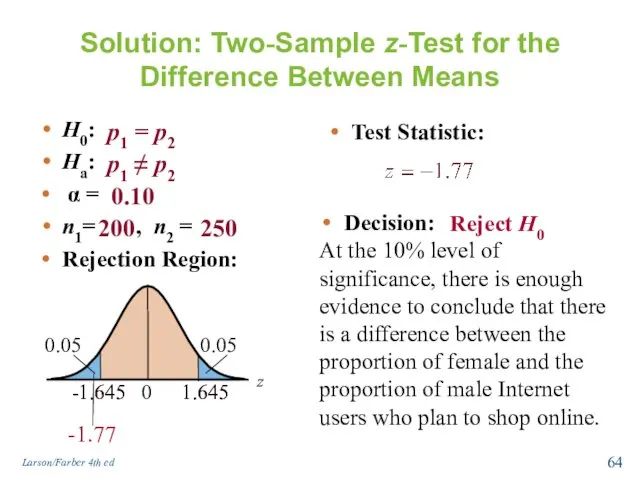
- 60. Example: Two-Sample z-Test for the Difference Between Proportions In a study of 200 randomly selected adult
- 61. Solution: Two-Sample z-Test for the Difference Between Means H0: Ha: α = n1= , n2 =
- 62. Solution: Two-Sample z-Test for the Difference Between Means Larson/Farber 4th ed
- 63. Solution: Two-Sample z-Test for the Difference Between Means Larson/Farber 4th ed
- 64. Solution: Two-Sample z-Test for the Difference Between Means H0: Ha: α = n1= , n2 =
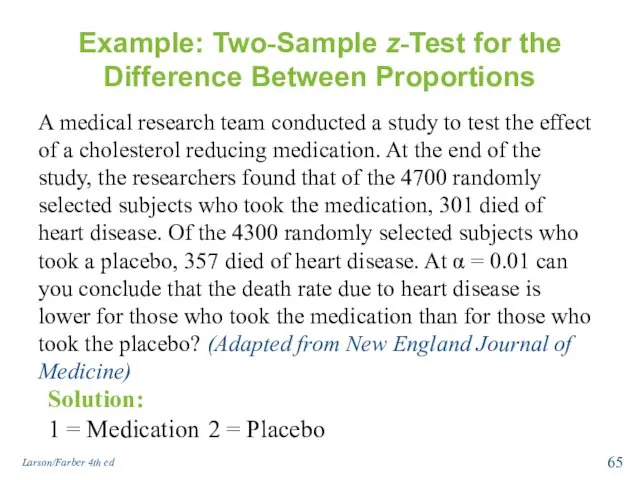
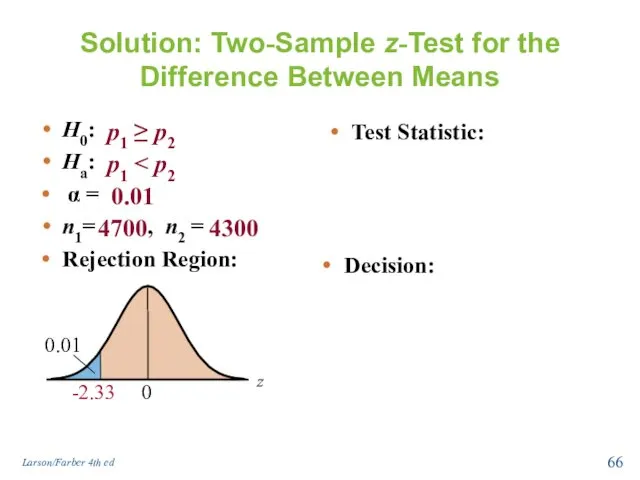
- 65. Example: Two-Sample z-Test for the Difference Between Proportions A medical research team conducted a study to
- 66. Solution: Two-Sample z-Test for the Difference Between Means H0: Ha: α = n1= , n2 =
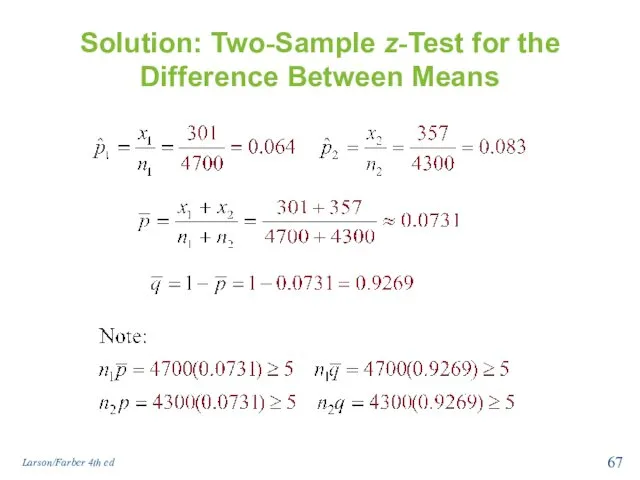
- 67. Solution: Two-Sample z-Test for the Difference Between Means Larson/Farber 4th ed
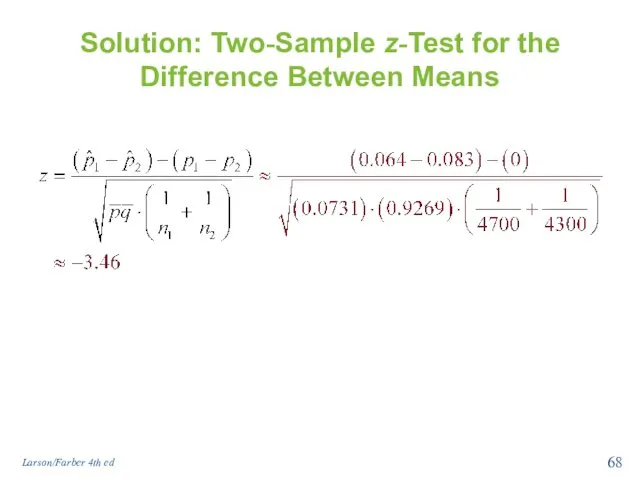
- 68. Solution: Two-Sample z-Test for the Difference Between Means Larson/Farber 4th ed
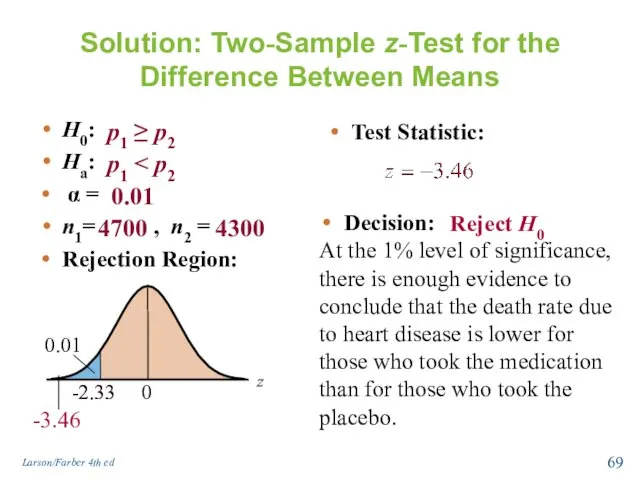
- 69. Solution: Two-Sample z-Test for the Difference Between Means H0: Ha: α = n1= , n2 =
- 71. Скачать презентацию
Chapter Outline
8.1 Testing the Difference Between Means (Large
Independent Samples)
8.2 Testing
Chapter Outline
8.1 Testing the Difference Between Means (Large
Independent Samples)
8.2 Testing
Section 8.1
Testing the Difference Between Means (Large Independent Samples)
Larson/Farber 4th ed
Section 8.1
Testing the Difference Between Means (Large Independent Samples)
Larson/Farber 4th ed
Section 8.1 Objectives
Determine whether two samples are independent or dependent
Perform a
Section 8.1 Objectives
Determine whether two samples are independent or dependent
Perform a
Two Sample Hypothesis Test
Compares two parameters from two populations.
Sampling methods:
Independent Samples
The
Two Sample Hypothesis Test
Compares two parameters from two populations.
Sampling methods:
Independent Samples
The
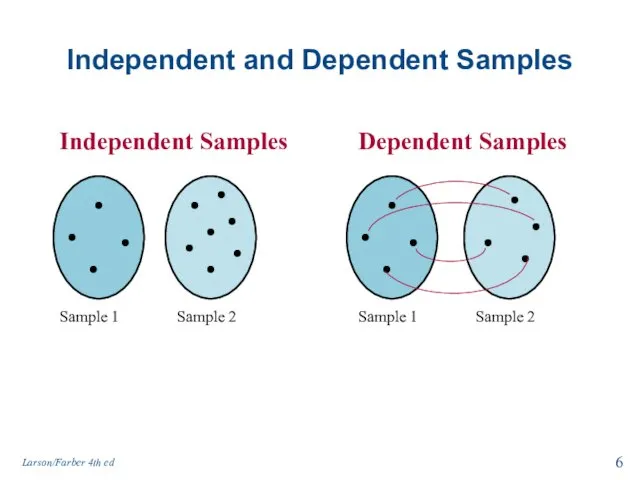
Independent and Dependent Samples
Independent Samples
Sample 1
Sample 2
Dependent Samples
Sample 1
Sample 2
Larson/Farber 4th
Independent and Dependent Samples
Independent Samples
Sample 1
Sample 2
Dependent Samples
Sample 1
Sample 2
Larson/Farber 4th
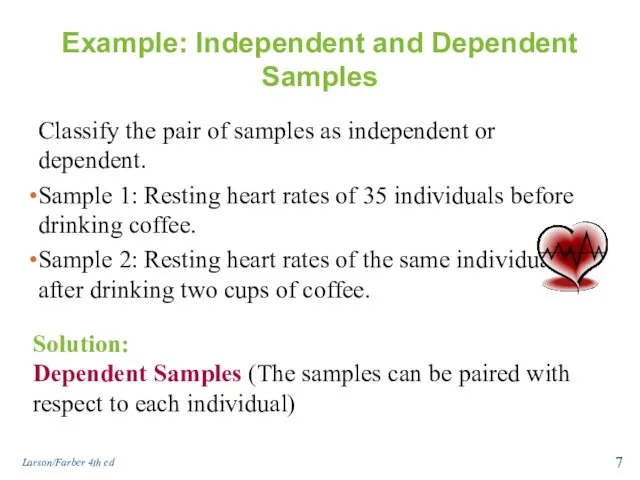
Example: Independent and Dependent Samples
Classify the pair of samples as independent
Example: Independent and Dependent Samples
Classify the pair of samples as independent
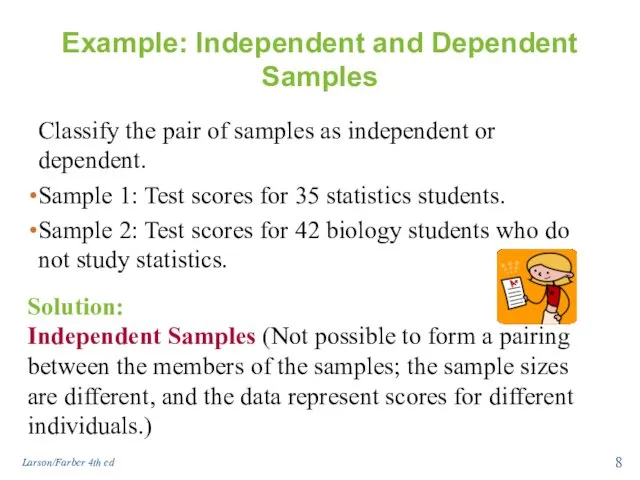
Example: Independent and Dependent Samples
Classify the pair of samples as independent
Example: Independent and Dependent Samples
Classify the pair of samples as independent
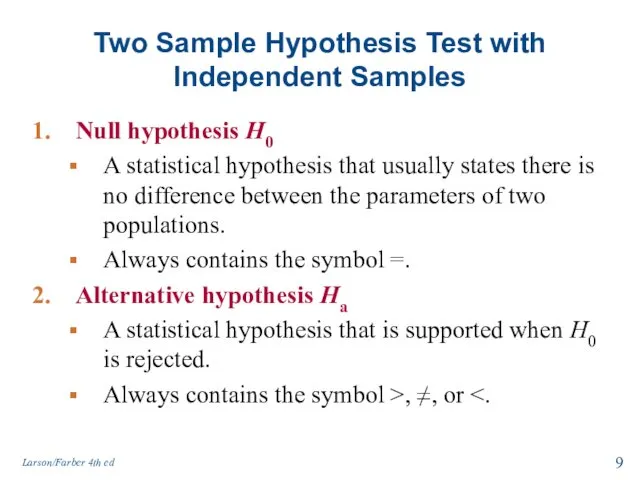
Two Sample Hypothesis Test with Independent Samples
Null hypothesis H0
A statistical
Two Sample Hypothesis Test with Independent Samples
Null hypothesis H0
A statistical
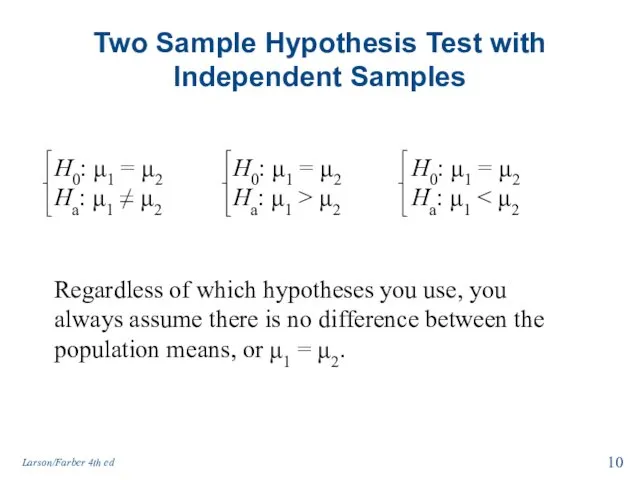
Two Sample Hypothesis Test with Independent Samples
H0: μ1 = μ2
Ha: μ1
Two Sample Hypothesis Test with Independent Samples
H0: μ1 = μ2
Ha: μ1
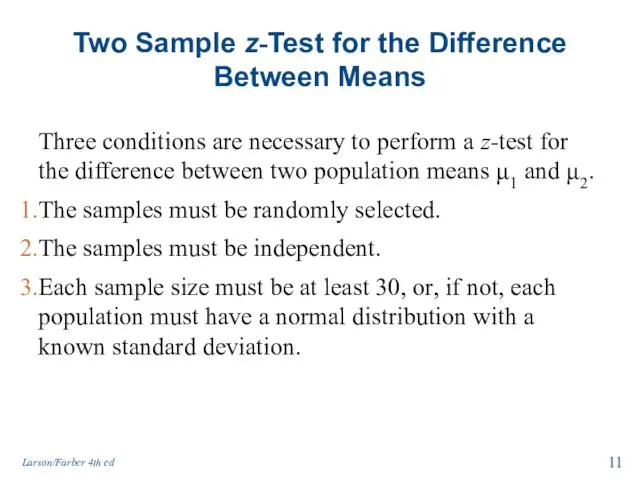
Two Sample z-Test for the Difference Between Means
Three conditions are necessary
Two Sample z-Test for the Difference Between Means
Three conditions are necessary
Two Sample z-Test for the Difference Between Means
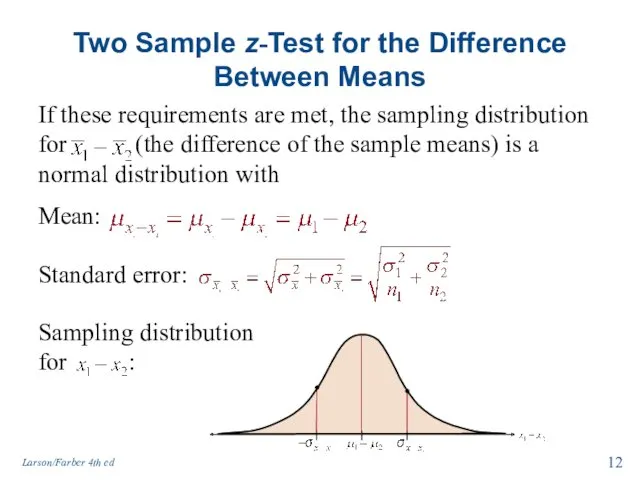
If these requirements are
Two Sample z-Test for the Difference Between Means
If these requirements are
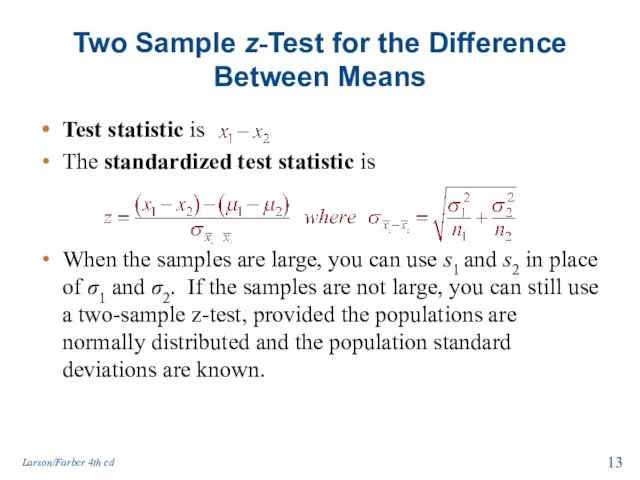
Two Sample z-Test for the Difference Between Means
Test statistic is
The
Two Sample z-Test for the Difference Between Means
Test statistic is
The
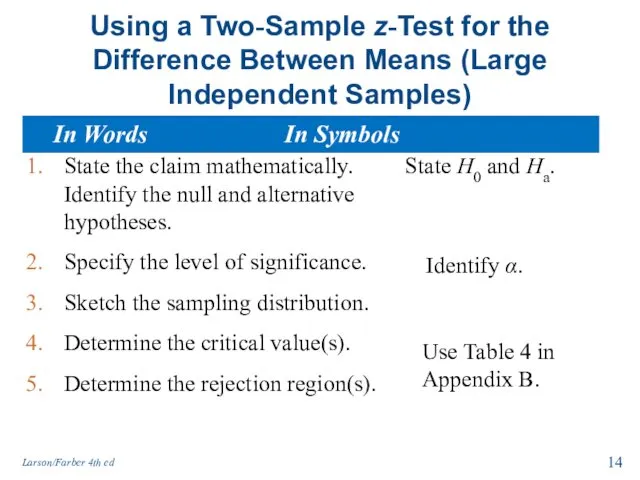
Using a Two-Sample z-Test for the Difference Between Means (Large Independent
Using a Two-Sample z-Test for the Difference Between Means (Large Independent
Using a Two-Sample z-Test for the Difference Between Means (Large Independent
Using a Two-Sample z-Test for the Difference Between Means (Large Independent
Example: Two-Sample z-Test for the Difference Between Means
A consumer education organization
Example: Two-Sample z-Test for the Difference Between Means
A consumer education organization
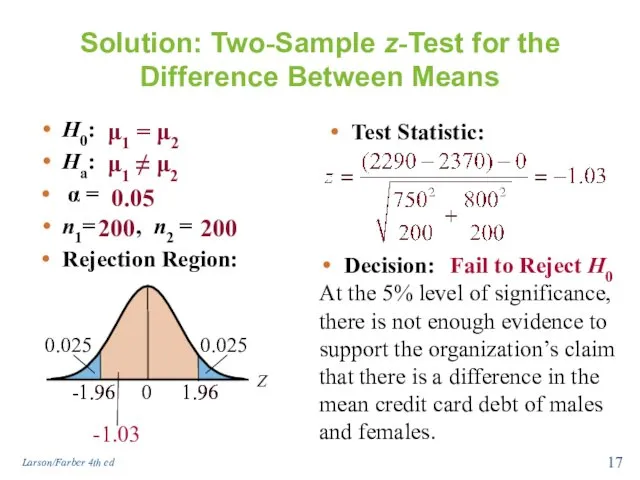
Solution: Two-Sample z-Test for the Difference Between Means
H0:
Ha:
α =
n1=
Solution: Two-Sample z-Test for the Difference Between Means
H0:
Ha:
α =
n1=
Example: Using Technology to Perform a Two-Sample z-Test
The American Automobile Association
Example: Using Technology to Perform a Two-Sample z-Test
The American Automobile Association
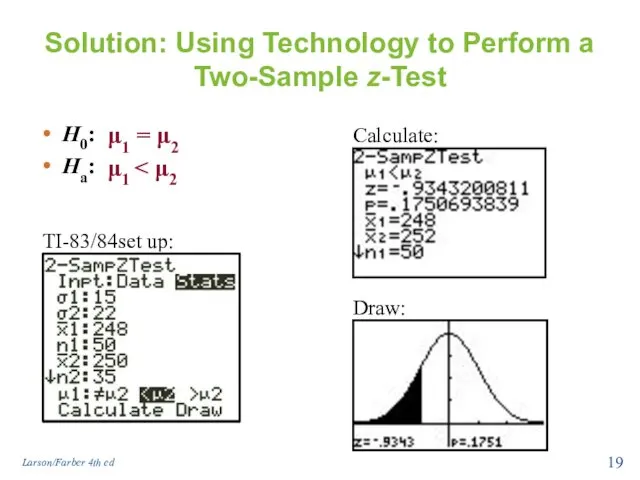
Solution: Using Technology to Perform a Two-Sample z-Test
H0:
Ha:
TI-83/84set up:
Calculate:
Draw:
Larson/Farber 4th ed
Solution: Using Technology to Perform a Two-Sample z-Test
H0:
Ha:
TI-83/84set up:
Calculate:
Draw:
Larson/Farber 4th ed
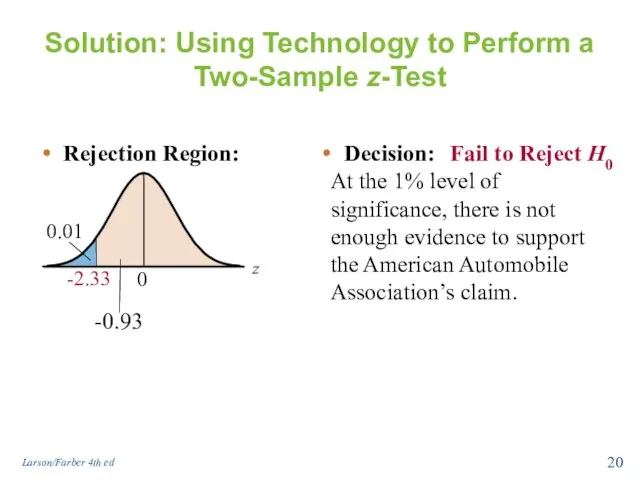
Solution: Using Technology to Perform a Two-Sample z-Test
Decision:
At the 1% level
Solution: Using Technology to Perform a Two-Sample z-Test
Decision:
At the 1% level
Section 8.1 Summary
Determined whether two samples are independent or dependent
Performed a
Section 8.1 Summary
Determined whether two samples are independent or dependent
Performed a
Section 8.2
Testing the Difference Between Means (Small Independent Samples)
Larson/Farber 4th ed
Section 8.2
Testing the Difference Between Means (Small Independent Samples)
Larson/Farber 4th ed
Section 8.2 Objectives
Perform a t-test for the difference between two means
Section 8.2 Objectives
Perform a t-test for the difference between two means
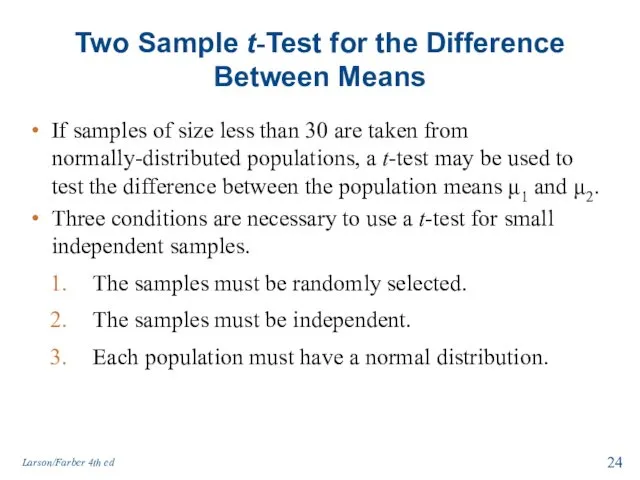
Two Sample t-Test for the Difference Between Means
If samples of size
Two Sample t-Test for the Difference Between Means
If samples of size
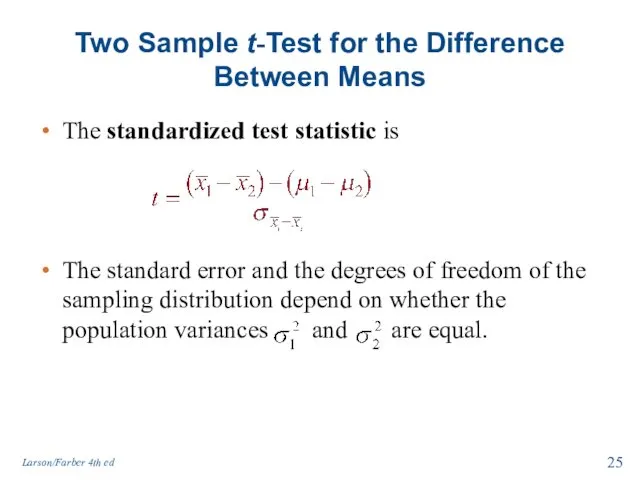
Two Sample t-Test for the Difference Between Means
The standardized test statistic
Two Sample t-Test for the Difference Between Means
The standardized test statistic
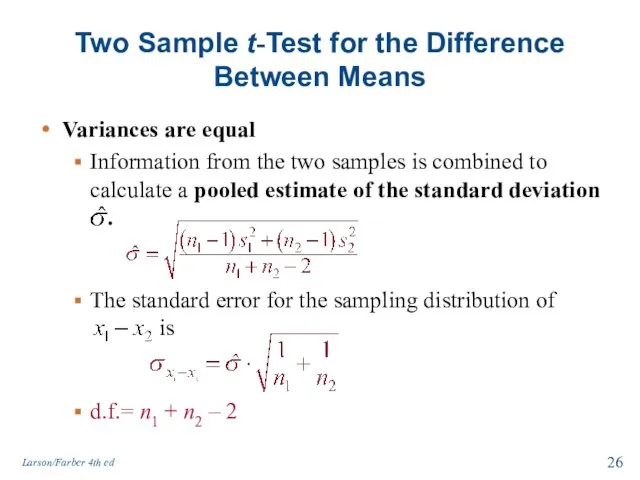
The standard error for the sampling distribution of is
Two Sample
The standard error for the sampling distribution of is
Two Sample
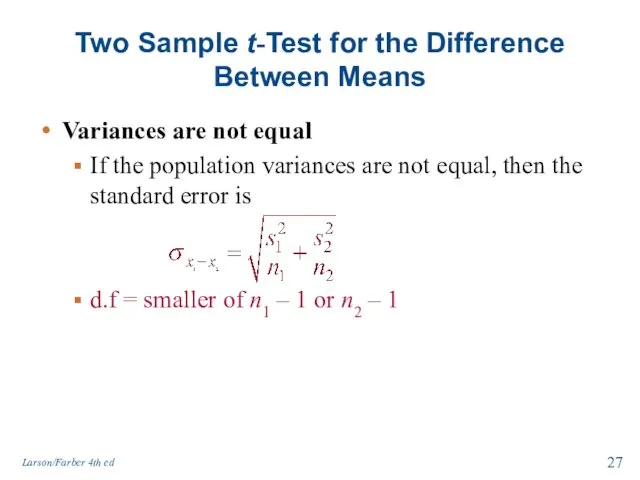
Variances are not equal
If the population variances are not equal, then
Variances are not equal
If the population variances are not equal, then
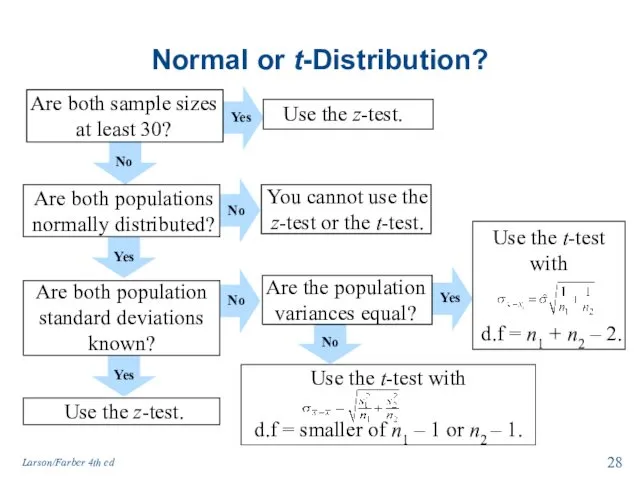
Normal or t-Distribution?
Are both sample sizes at least 30?
Are both populations
Normal or t-Distribution?
Are both sample sizes at least 30?
Are both populations
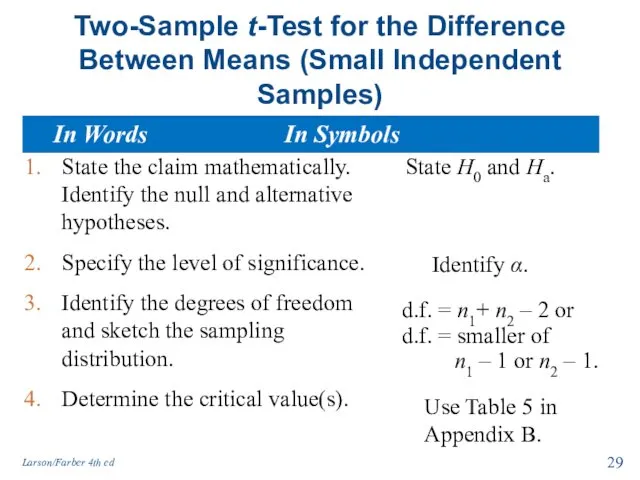
Two-Sample t-Test for the Difference Between Means (Small Independent Samples)
State the
Two-Sample t-Test for the Difference Between Means (Small Independent Samples)
State the
Two-Sample t-Test for the Difference Between Means (Small Independent Samples)
Determine the
Two-Sample t-Test for the Difference Between Means (Small Independent Samples)
Determine the
Example: Two-Sample t-Test for the Difference Between Means
The braking distances of
Example: Two-Sample t-Test for the Difference Between Means
The braking distances of
Solution: Two-Sample t-Test for the Difference Between Means
H0:
Ha:
α =
d.f.
Solution: Two-Sample t-Test for the Difference Between Means
H0:
Ha:
α =
d.f.
Example: Two-Sample t-Test for the Difference Between Means
A manufacturer claims that
Example: Two-Sample t-Test for the Difference Between Means
A manufacturer claims that
Solution: Two-Sample t-Test for the Difference Between Means
H0:
Ha:
α =
d.f.
Solution: Two-Sample t-Test for the Difference Between Means
H0:
Ha:
α =
d.f.
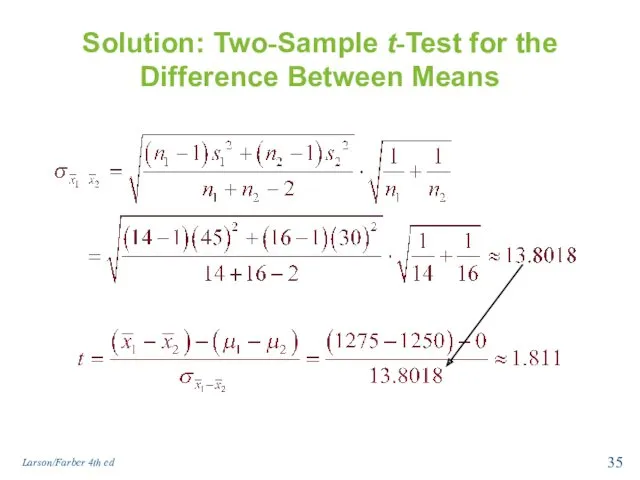
Solution: Two-Sample t-Test for the Difference Between Means
Larson/Farber 4th ed
Solution: Two-Sample t-Test for the Difference Between Means
Larson/Farber 4th ed
Solution: Two-Sample t-Test for the Difference Between Means
H0:
Ha:
α =
d.f.
Solution: Two-Sample t-Test for the Difference Between Means
H0:
Ha:
α =
d.f.
Section 8.2 Summary
Performed a t-test for the difference between two means
Section 8.2 Summary
Performed a t-test for the difference between two means
Section 8.3
Testing the Difference Between Means (Dependent Samples)
Larson/Farber 4th ed
Section 8.3
Testing the Difference Between Means (Dependent Samples)
Larson/Farber 4th ed
Section 8.3 Objectives
Perform a t-test to test the mean of the
Section 8.3 Objectives
Perform a t-test to test the mean of the
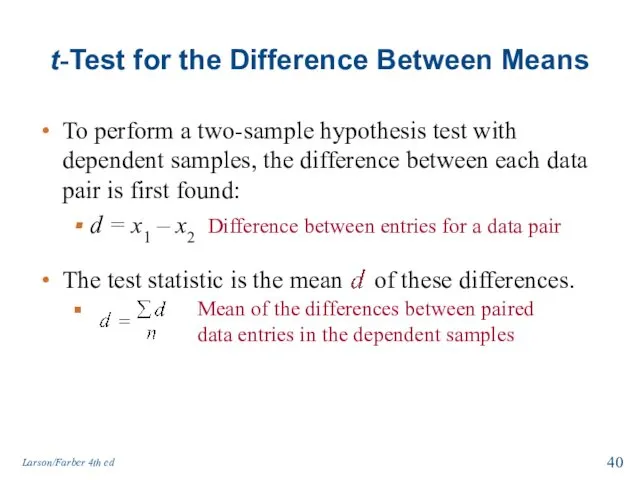
The test statistic is the mean of these differences.
t-Test for the
The test statistic is the mean of these differences.
t-Test for the
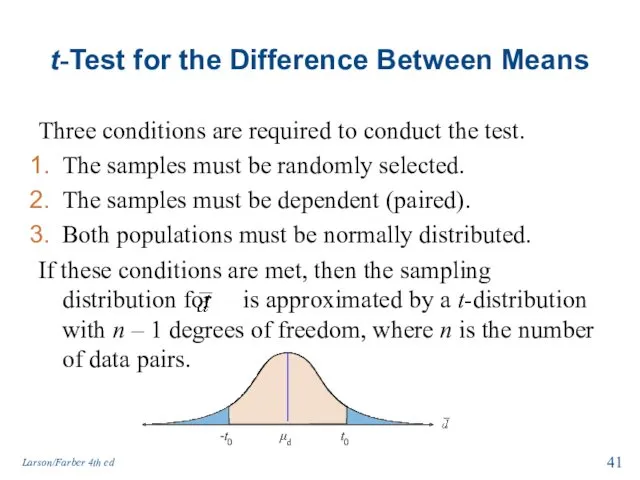
t-Test for the Difference Between Means
Three conditions are required to conduct
t-Test for the Difference Between Means
Three conditions are required to conduct
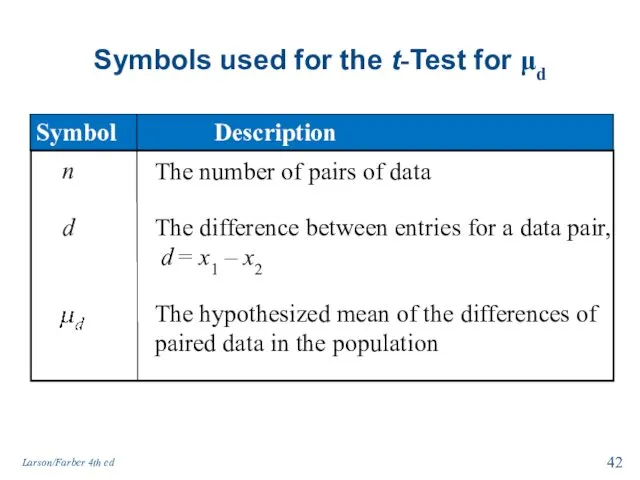
Symbols used for the t-Test for μd
The number of pairs of
Symbols used for the t-Test for μd
The number of pairs of
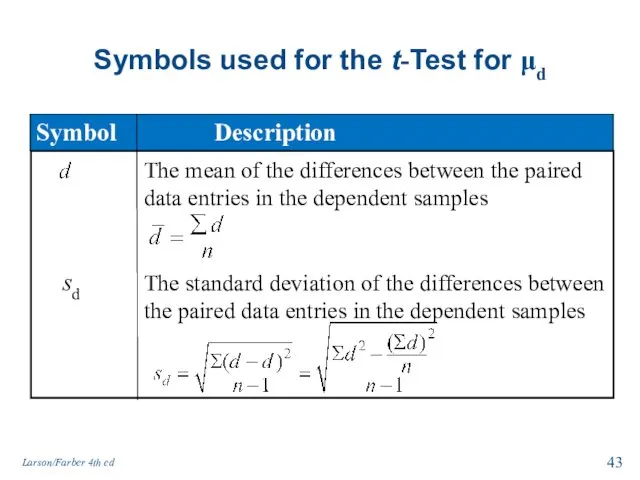
Symbols used for the t-Test for μd
The mean of the differences
Symbols used for the t-Test for μd
The mean of the differences
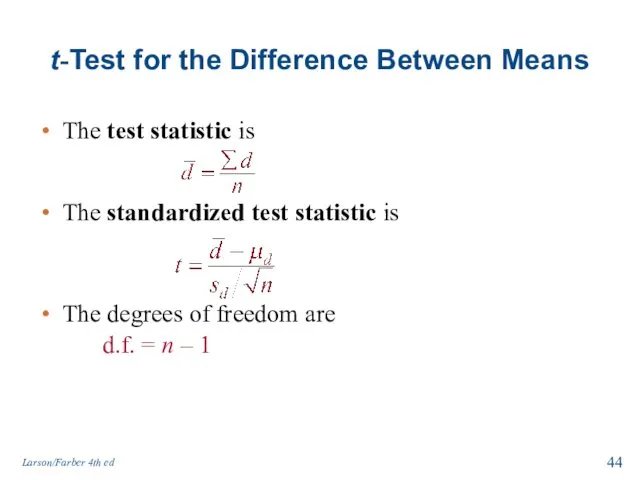
t-Test for the Difference Between Means
The test statistic is
The standardized test
t-Test for the Difference Between Means
The test statistic is
The standardized test
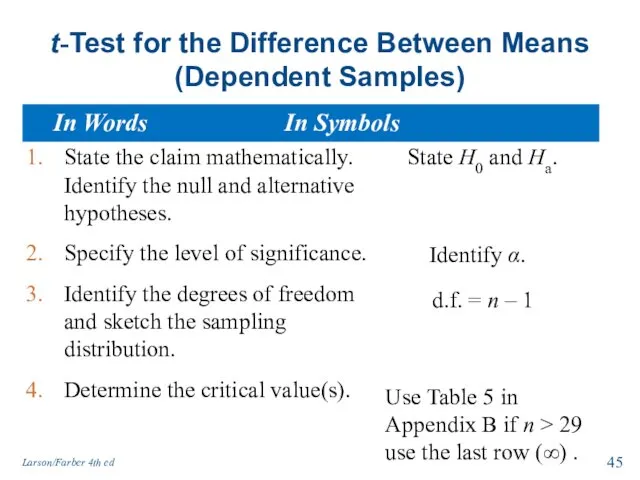
t-Test for the Difference Between Means (Dependent Samples)
State the claim mathematically.
t-Test for the Difference Between Means (Dependent Samples)
State the claim mathematically.
t-Test for the Difference Between Means (Dependent Samples)
Determine the rejection region(s).
Calculate
t-Test for the Difference Between Means (Dependent Samples)
Determine the rejection region(s).
Calculate
t-Test for the Difference Between Means (Dependent Samples)
Make a decision to
t-Test for the Difference Between Means (Dependent Samples)
Make a decision to
Example: t-Test for the Difference Between Means
A golf club manufacturer claims
Example: t-Test for the Difference Between Means
A golf club manufacturer claims
Solution: Two-Sample t-Test for the Difference Between Means
H0:
Ha:
α =
d.f.
Solution: Two-Sample t-Test for the Difference Between Means
H0:
Ha:
α =
d.f.
Solution: Two-Sample t-Test for the Difference Between Means
d = (old score)
Solution: Two-Sample t-Test for the Difference Between Means
d = (old score)
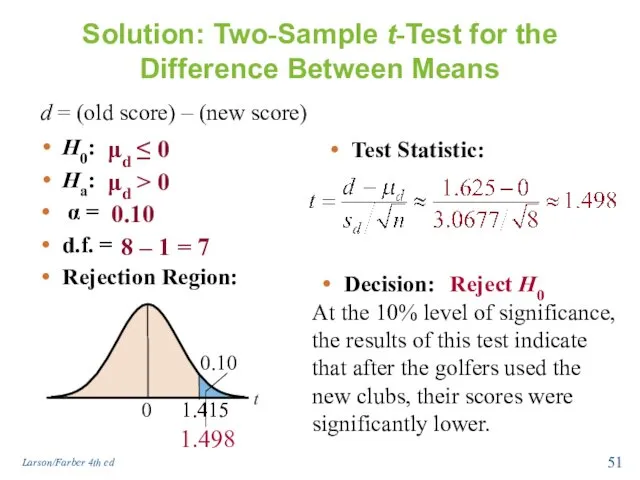
Solution: Two-Sample t-Test for the Difference Between Means
H0:
Ha:
α =
d.f.
Solution: Two-Sample t-Test for the Difference Between Means
H0:
Ha:
α =
d.f.
Section 8.3 Summary
Performed a t-test to test the mean of the
Section 8.3 Summary
Performed a t-test to test the mean of the
Section 8.4
Testing the Difference Between Proportions
Larson/Farber 4th ed
Section 8.4
Testing the Difference Between Proportions
Larson/Farber 4th ed
Section 8.4 Objectives
Perform a z-test for the difference between two population
Section 8.4 Objectives
Perform a z-test for the difference between two population
Two-Sample z-Test for Proportions
Used to test the difference between two population
Two-Sample z-Test for Proportions
Used to test the difference between two population
Two-Sample z-Test for the Difference Between Proportions
If these conditions are met,
Two-Sample z-Test for the Difference Between Proportions
If these conditions are met,
Two-Sample z-Test for the Difference Between Proportions
The test statistic is
The standardized
Two-Sample z-Test for the Difference Between Proportions
The test statistic is
The standardized
Two-Sample z-Test for the Difference Between Proportions
State the claim. Identify the
Two-Sample z-Test for the Difference Between Proportions
State the claim. Identify the
Two-Sample z-Test for the Difference Between Proportions
Find the standardized test statistic.
Make
Two-Sample z-Test for the Difference Between Proportions
Find the standardized test statistic.
Make
Example: Two-Sample z-Test for the Difference Between Proportions
In a study of
Example: Two-Sample z-Test for the Difference Between Proportions
In a study of
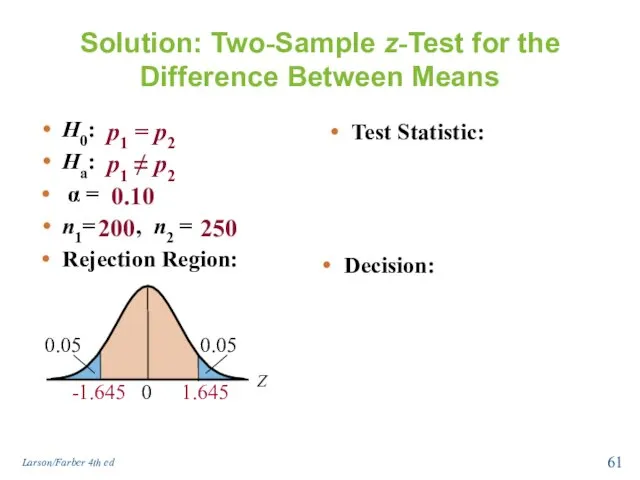
Solution: Two-Sample z-Test for the Difference Between Means
H0:
Ha:
α =
n1=
Solution: Two-Sample z-Test for the Difference Between Means
H0:
Ha:
α =
n1=
Solution: Two-Sample z-Test for the Difference Between Means
Larson/Farber 4th ed
Solution: Two-Sample z-Test for the Difference Between Means
Larson/Farber 4th ed
Solution: Two-Sample z-Test for the Difference Between Means
Larson/Farber 4th ed
Solution: Two-Sample z-Test for the Difference Between Means
Larson/Farber 4th ed
Solution: Two-Sample z-Test for the Difference Between Means
H0:
Ha:
α =
n1=
Solution: Two-Sample z-Test for the Difference Between Means
H0:
Ha:
α =
n1=
Example: Two-Sample z-Test for the Difference Between Proportions
A medical research team
Example: Two-Sample z-Test for the Difference Between Proportions
A medical research team
Solution: Two-Sample z-Test for the Difference Between Means
H0:
Ha:
α =
n1=
Solution: Two-Sample z-Test for the Difference Between Means
H0:
Ha:
α =
n1=
Solution: Two-Sample z-Test for the Difference Between Means
Larson/Farber 4th ed
Solution: Two-Sample z-Test for the Difference Between Means
Larson/Farber 4th ed
Solution: Two-Sample z-Test for the Difference Between Means
Larson/Farber 4th ed
Solution: Two-Sample z-Test for the Difference Between Means
Larson/Farber 4th ed
Solution: Two-Sample z-Test for the Difference Between Means
H0:
Ha:
α =
n1=
Solution: Two-Sample z-Test for the Difference Between Means
H0:
Ha:
α =
n1=
 Преобразование фигур на плоскости. Виды движения
 Уравнение. Корень уравнения
 Способы решения квадратных уравнений
 Графическое решение уравнений с двумя переменными
 Вычитание дроби из натурального числа
 Нахождение процента от числа и числа по его проценту. Расшифруйте
 Сравнение дробей. Классная работа
 Центральные и вписанные углы
 Разложение разности квадратов на множители
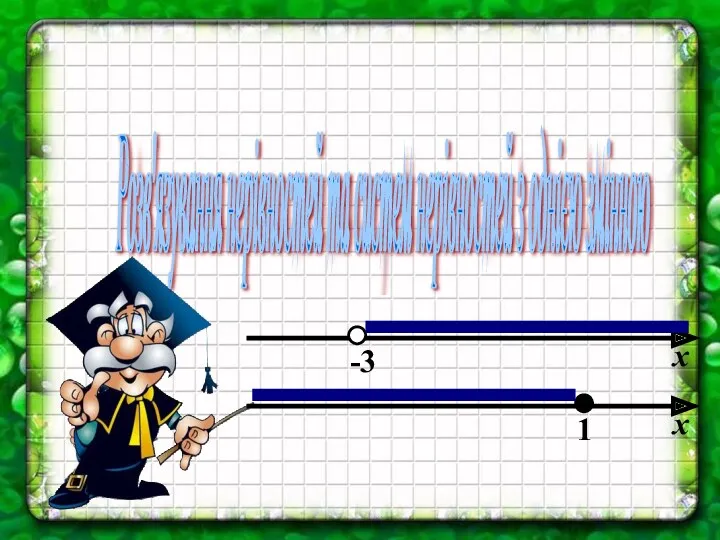 Розв'язування нерівностей та систем нерівностей з однією змінною
 Теория алгоритмов. Основные понятия и определения
 Конспект совместной деятельности педагога с детьми по математике во 2 младшей группе Путешествие в волшебную страну
 Веселый счет для малышей
 Элементы алгебры логики. Математические основы информатики. Таблицы истинности
 Основные теоремы теории вероятностей
 Числовые последовательности. Способы задания последовательностей
 Нумерация чисел от 11 до 20
 Цифра 8
 Урок математики в 4 классе с использованием ИКТ на тему Встречное движение
 Геометрические головоломки
 Задачи с практическим содержанием. Задания В1 ЕГЭ по математике
 Метод математических моделей в экономике
 Математика и экономика. Задачи о наибольших и наименьших значениях величин
 Презентация к уроку математики на тему: Деление на 2
 Функция y=k/x, её график и свойства. 8 класс. Урок 1
 Действия с обыкновенными дробями
 Презентация по теме Формирование познавательных УУД на уроках математики в 1 классе
 Школа Квентин – подготовка к ЕГЭ