- Operational Risk Management: Best Practice Overview and Implementation

Содержание
- 2. Table of Contents
- 3. Table of Contents
- 4. Table of Contents
- 5. OpRisk IS AN ENTERPRISE-WIDE RISK OR has been managed already before it has been „labelled― so.
- 6. RECENT OUTSTANDING OPERATIONAL LOSSES BARINGS PLC – 1995, USD 1.3 Bln – unauthorized trading by Nick
- 7. ISO Standards: 31100 – Enterprise Risk Management; 27900 – Information Security FERMA (Federation of European Risk
- 8. INTERNATIONAL REGULATORY PERCEPTION OF the companyING OR Supervisors „discovered― OR as separate risk class => Don‗t
- 9. DEFINE OpRisk PRIOR TO MEASURING IT „Wide“ „Narrow“ (Basel 2, §644, R.Morris Ass.) Risk of losses
- 10. BANKING RISKS Strategic Risk Credit Risk Based on creditworthine ss Market Risk Based on market prices
- 11. OPERATIONAL RISK PORTION IN REGCAP OpRisk Diverse in its scope Encompasses the risks emanating from all
- 12. MANAGEMENT RISK - #1 OpRisk Management Risk components: conflicts of interest excessive pay levels breach of
- 13. LEGAL RISK Causes of legal risk materializing ❑Breakdown of the law enforcement ―industry‖ ❑ Corruption ❑Political
- 14. REPUT RISK INCLUSION INTO THE ORM Reputation is a key asset of a fin institution, as
- 15. Table of Contents
- 16. BASEL-2 PILLARS ON OpRisk Pillar 1 Minimum Capital Requirements (Objective: limit risk taking) Pillar 2 Capital
- 17. B2/PILLAR 1: ORM QUANTITATIVE & QUALITATIVE REQUIREMENTS OpRisk Capital allocation: 15% of average 3-y gross income
- 18. STAGES OF ORM DEVELOPMENT IN A BANK
- 19. GOALS OF OPERATIONAL RISK MANAGEMENT UNDER AMA Allocate - Budgets for Risk Reduction; - Capital Understand
- 20. COMPLEX BASEL AMA RISK GOVERNANCE FRAMEWORK Effective ORM Environment Governance & Organization ORM Function Design Committee
- 21. B2/PILLAR 2: PRINCIPLES FOR THE SOUND MANAGEMENT OF OpRisk (JUNE 2011) OpRisk mngt is especially important
- 22. FUNDAMENTAL PRINCIPLE 1: BOD’s Leadership … and ultimate responsibility for strong ORM culture Internal OR culture
- 23. RISK CULTURE Includes: Integrity and ethical values; Management philosophy & operating style; Organizational structure; Delegation of
- 24. OP RISK APPETITE (ORA) “the amount and type of risk an organization is prepared to seek,
- 25. Fundamental P2: OpRisk framework integrated into overall risk management processes It depends on size, complexity and
- 26. B2: AMA – EXAMPLE OF ORM FRAMEWORK
- 27. MANAGING OpRisk THROUGH FRAMEWORK OR has been managed already before it has been „labelled― so: „4-eyes―-principle,
- 28. ORM FRAMEWORK IMPLEMENTATION I T ION DENTIFICA ASSESSMENT Find quantifiable means to track OR; Create Reporting
- 29. EXAMPLE OF COMPLEX ORM FRAMEWORK Mitigating actions Mitigating actions Net loss distribution Risk capital Capital allocation
- 30. P6. Operational Risk Assessment Assessment of operational risk in all material products, processes and systems. Identification
- 31. LOSS TYPES Loss type Causes Monetary loss Legal and liability Lost legal suit External legal and
- 32. Processes People Systems External events BASEL 2, 2D-CLASSIFICATION – EVENT/CAUSE BASED Internal fraud (due to acts
- 33. Internal Fraud Unauthorized Activity (transactions intentionally not reported; transaction type unauthorized w/o monetary loss), intentional mismarking
- 34. OP LOSSES: CAUSE CATEGORIES & ACTIVITY EXAMPLES Clients, Products & Biz Practices Suitability, Disclosure & Fiduciary
- 35. 3D OPERATIONAL LOSS CLASSIFICATION Internal fraud External fraud Damage to physical assets Business disruption & system
- 36. RISK MANAGEMENT ENVIRONMENT -OpRisk shall be managed as a distinct category of risks -Set principles for
- 37. RISK MANAGEMENT CONTROL ENVIRONMENT (P9) I. Internal controls: II. Risk mitigation strategies III. Risk transfer strategies
- 38. Table of Contents
- 39. Table of Contents
- 40. MAIN OPERATIONAL RISK MANAGEMENT TOOLS Risk and Control Self- Assessment Loss event Database Scenario Modeling &
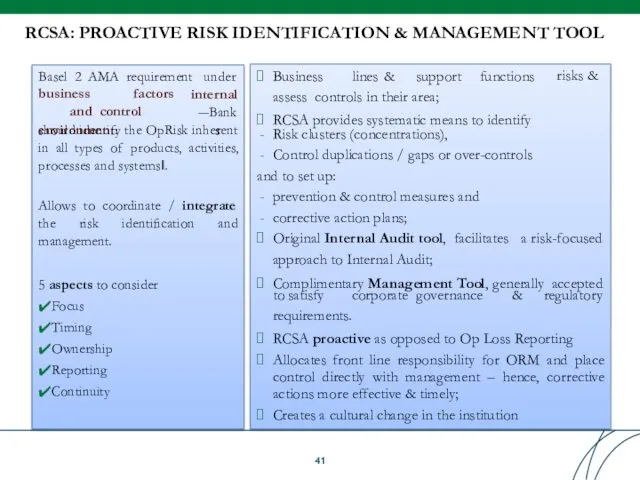
- 41. RCSA: PROACTIVE RISK IDENTIFICATION & MANAGEMENT TOOL risks & Business lines & support functions assess controls
- 42. RCSA AIMS Establish a contact with risk owners Qualitative risk assessment Get details on typical risk
- 43. RCSA MILESTONES Corrective Action Plans / Risk Mitigation Plans (RMPs) Exterminate weak areas in prevention &
- 44. RCSA WORKFLOW Define the implementation mode / Document the process Update KRIs, adjust scenario analysis, enhance
- 45. RCSA TOOLKIT-3: OpRisk MAPPING Risk register (also for output) High level business process (e.g. HR Mngt)
- 47. INPUT OpRisk MAPPING SAMPLE
- 48. MANAGEMENT RESULTS REPORTIG TOOLS Unless RCSA results are relevant for management decision making, the exercise is
- 49. OUTPUT RISK SCORECARD
- 50. HEAT MAPPING facilitates the assessment of the likelihood and impact of the risk materializing; Can also
- 51. OPERATIONAL FREQUENCY – SEVERITY RISK MAPPING Card fraud Frequency Severity High Low Low High Unauthorized access
- 52. RCSA FOLLOW UP RCSA results ought to be used in conjunction with other components of ORM
- 53. Table of Contents
- 54. Basel Committee on Banking Supervision Principles for the Sound Management of Operational Risk, June 2011 Indicators
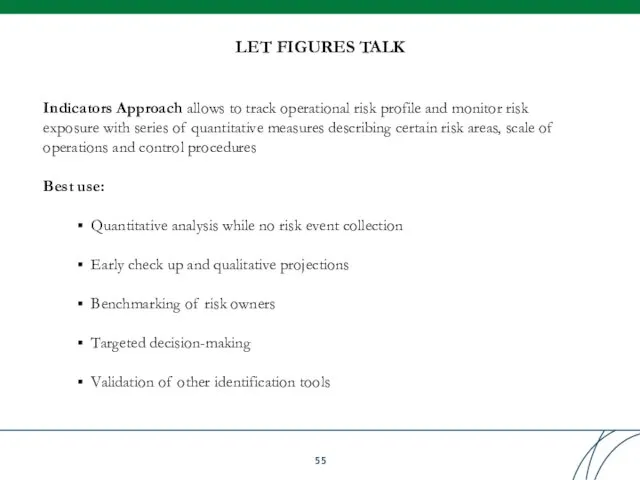
- 55. Indicators Approach allows to track operational risk profile and monitor risk exposure with series of quantitative
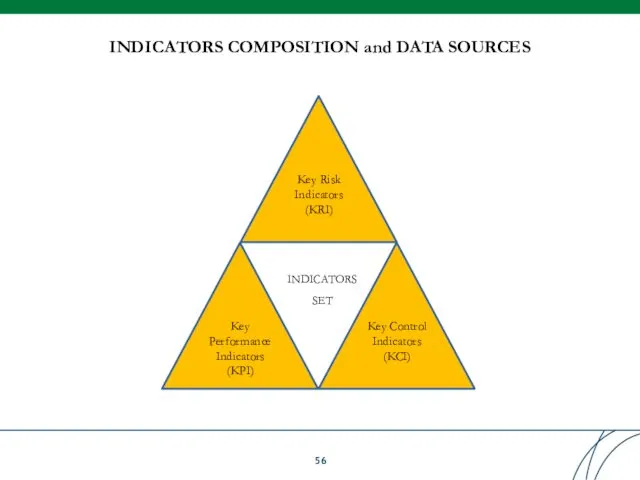
- 56. INDICATORS COMPOSITION and DATA SOURCES Key Risk Indicators (KRI) Key Performance Indicators (KPI) Key Control Indicators
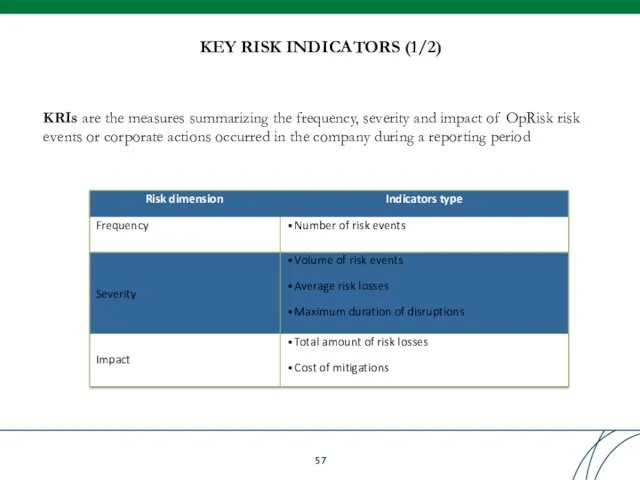
- 57. KRIs are the measures summarizing the frequency, severity and impact of OpRisk risk events or corporate
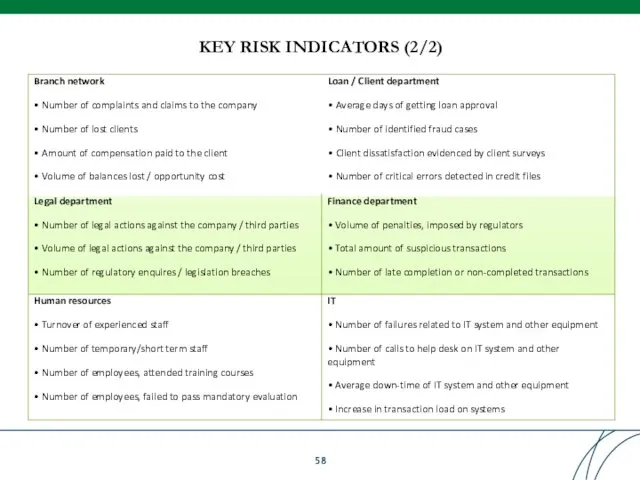
- 58. KEY RISK INDICATORS (2/2)
- 59. KPIs are the measures that evaluate scale of banking activities. According to many empirical observations that
- 60. KCIs are the measures that enables to monitor effectiveness of OpRisk management procedures established in the
- 61. DATA SOURCES Key Risk Indicators (KRI) Key Performance Indicators (KPI) Key Control Indicators (KCI) INDICATORS SET
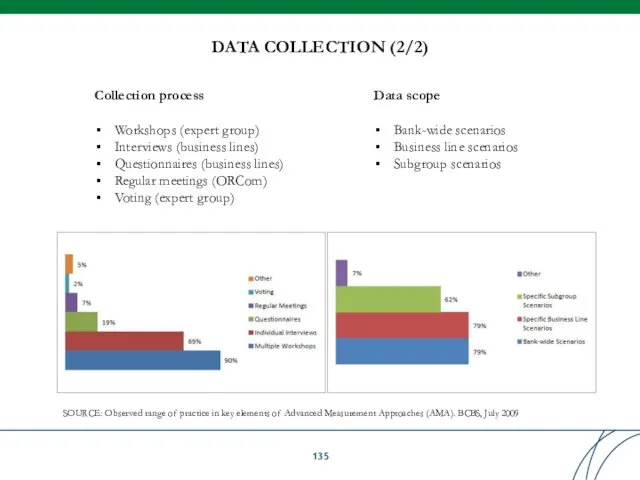
- 62. DATA COLLECTION FREQUENCY SOURCE: Observed range of practice in key elements of Advanced Measurement Approaches (AMA).
- 63. DATA BREAKDOWNS Upright Peers All bank Headquarter Branch network DATA ANALYSIS (1/2) Horizontal Business lines Departments
- 64. DATA ANALYSIS (2/2) Trend analysis Retrospective Business plan Regressions Peers KPI comparison Thresholds Control Peers line
- 65. REPORTING MATRIX
- 66. DECISION MAKING MATRIX
- 67. Table of Contents
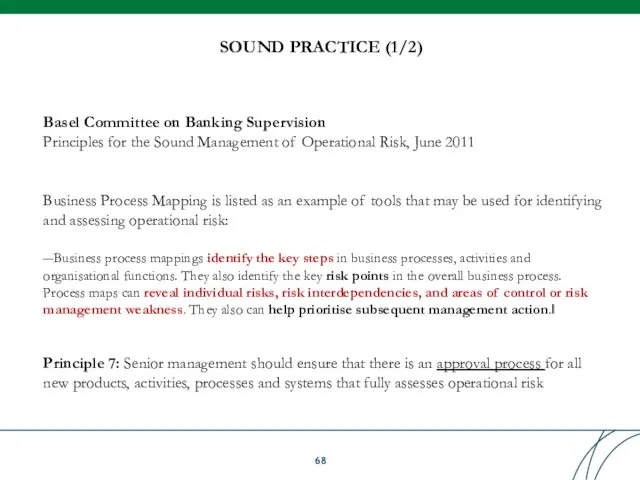
- 68. Basel Committee on Banking Supervision Principles for the Sound Management of Operational Risk, June 2011 Business
- 69. The review and approval process should consider: inherent risks in the new product, service, or activity
- 70. Business process is a collection of linked activities that consume inputs, add value, and produce an
- 71. BUSINESS PROCESS MANAGEMENT TOOLS Process engineering Process initiation document As Is: Flowchart Activity flow diagram RACI
- 72. HOW RISK MANAGEMENT SIGN OFF THE PROCESS? PROCESS BENEFICIERY BUSINESS DEVELOPMENT ENDORSING DEPARTMENTS RISK MANAGEMENT Risk
- 73. Process risk map is composed and monitored by Risk management on the basis of key workflows
- 74. RISK CONTRIBUTION TO FLOWCHART Quality controls make the flowchart telling what goes wrong or well in
- 75. Table of Contents
- 76. Table of Contents
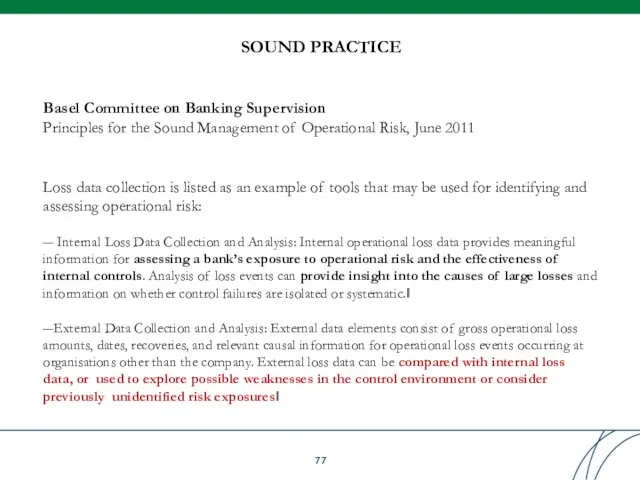
- 77. Basel Committee on Banking Supervision Principles for the Sound Management of Operational Risk, June 2011 Loss
- 78. Risk event database is a register of risk event records that enables to accumulate, classify, keep
- 79. WHY COLLECT DATA? RISK EVENT DATABASE Immediate Actions Advanced Measurement Approach (AMA) 1 2 Risk Reporting
- 80. DATABASE DEVELOPMENT 1. Classify business lines, risk, loss types 2. Define risk event data and data
- 81. DATABASE CLASSIFICATORS (1/2) Business Areas Corporate Finance Trading & Sales Retail Banking Commercial Banking Payment and
- 82. DATABASE CLASSIFICATORS (2/2) Practical considerations Coding classes (Size and Filtering) Low-level breakdowns of first-rank classes Cross
- 83. RISK GRANULARITY BASEL II Framework: A bank's risk measurement system must be sufficiently 'granular' to capture
- 84. WHAT DATA ARE ESSENTIAL TO COLLECT? • Risk Coordinator • Observer • Actions taken • Actions
- 85. DATABASE FUNCTIONAL MAP Data Upload Database Report confi- gurator Reports Data contributors Risk owners Audit reports
- 86. Bank Staff Coordinator Identify risk event Inform Coordinator Examine the details of risk event Report to
- 87. DATA COLLECTION: DIFFICULTIES AND SOLUTIONS Difficulties Lack of knowledge which information to be reported Fear of
- 88. KEY DATES OF DATA COLLECTION SOURCE: Observed range of practice in key elements of Advanced Measurement
- 89. SPECIFIC EVENT TYPES (1/3) SOURCE: Operational Risk Reporting Standards. ORX, Edition 2011 OpRisk event is an
- 90. SPECIFIC EVENT TYPES (2/3) SOURCE: Operational Risk Reporting Standards. ORX, Edition 2011 Observed range of practice
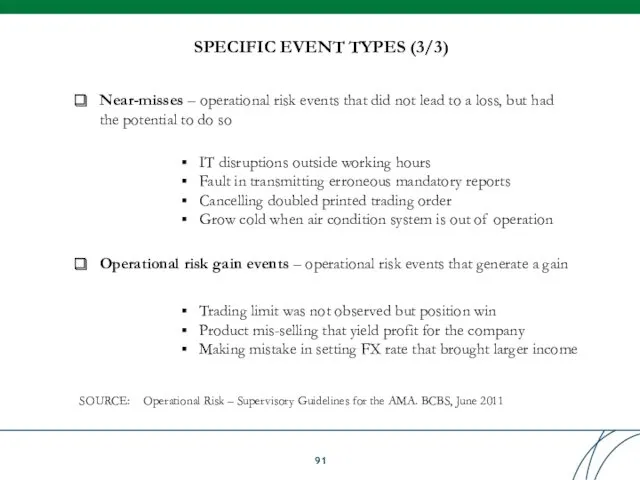
- 91. SPECIFIC EVENT TYPES (3/3) Near-misses – operational risk events that did not lead to a loss,
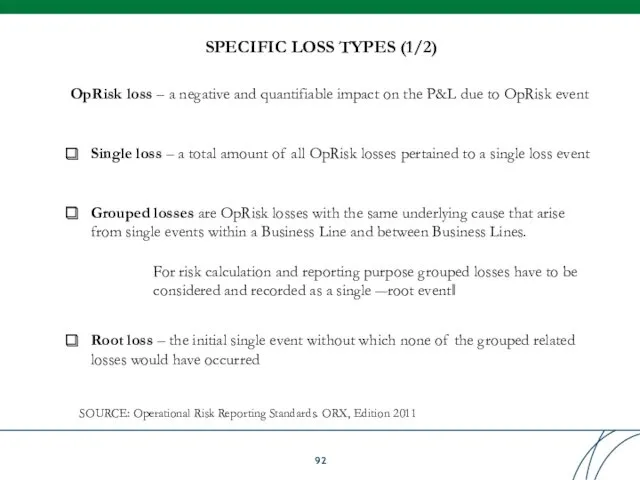
- 92. SPECIFIC LOSS TYPES (1/2) SOURCE: Operational Risk Reporting Standards. ORX, Edition 2011 OpRisk loss – a
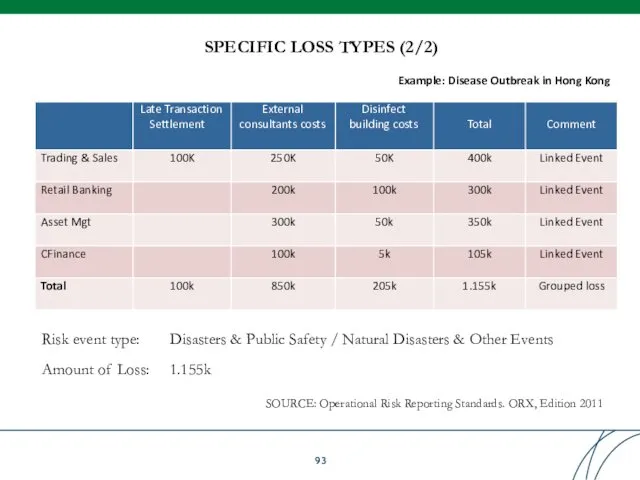
- 93. SPECIFIC LOSS TYPES (2/2) SOURCE: Operational Risk Reporting Standards. ORX, Edition 2011 Risk event type: Amount
- 94. EXTERNAL LOSS DATA (1/4) Lack of internal observations No data integrity and granularity Low confidence level
- 95. EXTERNAL LOSS DATA (2/4) SOURCE: Observed range of practice in key elements of Advanced Measurement Approaches
- 96. EXTERNAL LOSS DATA (3/4) Key information Business line / Event type Causes / Consequences Amount of
- 97. QUIZ: EXTERNAL LOSS DATA – local examples Internal fraud External fraud Reputational risk Products and processes
- 98. RISK EVENT DATA REPORTING MATRIX
- 99. KEY RISK REPORTS: 8x7 Matrix SOURCE: Results from the 2008 Loss Data Collection Exercise for Operational
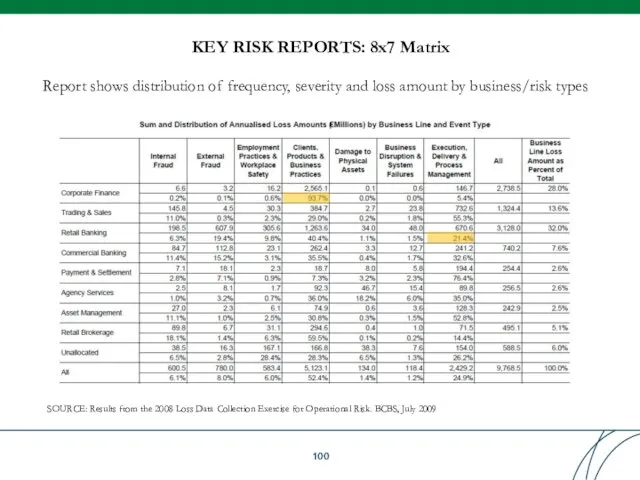
- 100. KEY RISK REPORTS: 8x7 Matrix SOURCE: Results from the 2008 Loss Data Collection Exercise for Operational
- 101. KEY RISK REPORTS: Severity Distribution Report shows distribution of frequency and loss amount by loss severity
- 102. KEY RISK REPORTS: Summary Report Report aggregates frequency and loss amount by business / risk types
- 103. KEY RISK REPORTS: Register Report Report lists key parameters of risk events collected in database during
- 104. DATABASE SET INCLUDES: Classifications matrixes Data structure Reporting templates Workflow guidelines Job descriptions of key involved
- 105. Table of Contents
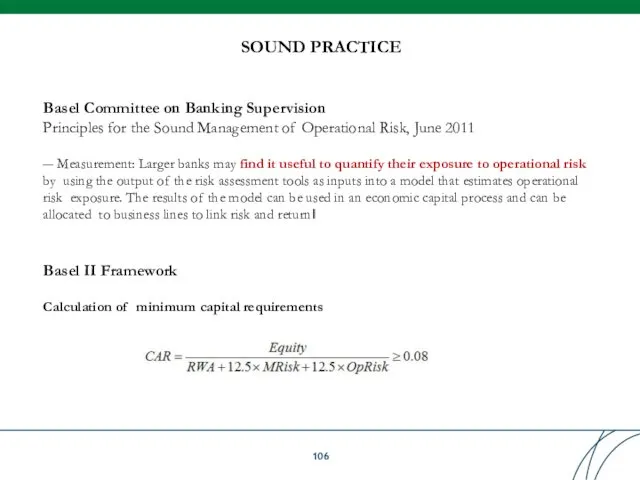
- 106. Basel Committee on Banking Supervision Principles for the Sound Management of Operational Risk, June 2011 ―
- 107. MEASUREMENT APPROACHES Deviation of Capital Charge | Opportunity Costs Complexity | implementation Costs Basic Indicator Approach
- 108. SELECTION CRITERIA Complexity or intensity of banking operations Meeting qualitative standards Partial use Restriction to revert
- 109. BASIC INDICATOR APPROACH (1/2) The simplest approach based on linear dependence between income as key exposure
- 110. BASIC INDICATOR APPROACH (2/2)
- 111. THE STANDARDIZED APPROACH (1/3) More accurate approach sensitive to business line segmentation Advantages: Fairly simple Specific
- 112. THE STANDARDIZED APPROACH (2/3)
- 113. THE STANDARDIZED APPROACH (3/3) Minimum qualifying criteria for TSA: Management oversight of ORM framework Soundness and
- 114. ALTERNATIVE STANDARDIZED APPROACH (1/3) A modification to TSA encompassing volume exposure indicator Advantages: Fairly simple Specific
- 115. ALTERNATIVE STANDARDIZED APPROACH (2/3)
- 116. ALTERNATIVE STANDARDIZED APPROACH (3/3)
- 117. ADVANCED MEASUREMENT APPROACHES (1/3) Capital Charge with AMA Stress Losses VaR (L) E(L) Allowances Risk capital
- 118. Qualifying standards: Meeting minimum qualifying criteria used for TSA Having independent full-fledged ORM function ORM is
- 119. Quantitative standards: Capture potentially severe ‗tail‘ loss events at one year holding period and a 99.9th
- 120. INTERNAL MEASUREMENT APPROACH (1/2) Approach based on linear proxy between expected and unexpected losses Parameters γ
- 121. INTERNAL MEASUREMENT APPROACH (2/2) Advantages Flexibility of exposure indicators Specific to business type Dependent on internal
- 122. LOSS DISTRIBUTION APPROACH (1/6) LDA estimates for each business line / event type the likely distribution
- 123. LOSS DISTRIBUTION APPROACH (2/6) OpRisk Loss Simulation Algorithm: Collect statistics on loss events no. per day
- 124. LOSS DISTRIBUTION APPROACH (3/6) Severity distributions Lognormal Pareto Weibull Validation tests Q-Q plot K-S test SOURCE:
- 125. LOSS DISTRIBUTION APPROACH (4/6) Frequency distributions Poisson Negative Binomial Validation tests χ2-test SOURCE: Observed range of
- 126. LOSS DISTRIBUTION APPROACH (5/6) Loss aggregation BU/ET 1 BU/ET n BU/ET … Gross Loss SOURCE: Carol
- 127. LOSS DISTRIBUTION APPROACH (6/6) SOURCE: Observed range of practice in key elements of Advanced Measurement Approaches
- 128. Table of Contents
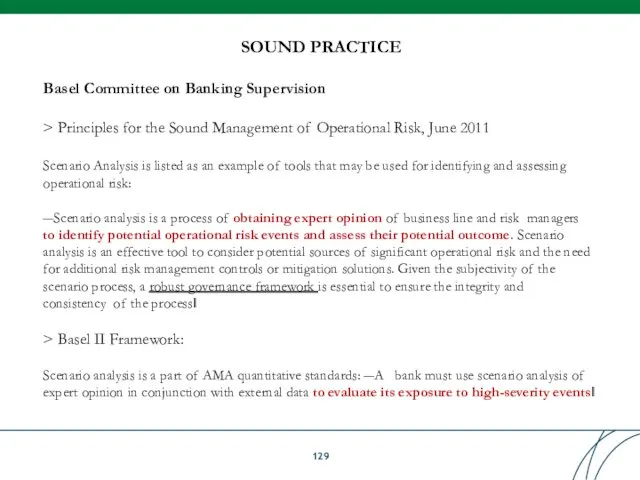
- 129. Basel Committee on Banking Supervision > Principles for the Sound Management of Operational Risk, June 2011
- 130. Business areas Risk types Data sources Scenario risk drivers Frequency Severity Loss Amount Recovery Return time
- 131. WRITING SCENARIOS ALGO Defining and structuring the task, specifying the area of interest and identifying the
- 132. WHAT SCENARIOS ARE RELEVANT? Frequency Loss severity High Low High Low RCSA Key risk indicators Audit
- 133. FORWARD-LOOKING FOCUS Internal / External loss database Past-looking RCSA / KRI Current performance Scenario Analysis Forward-looking
- 134. SOURCE: Observed range of practice in key elements of Advanced Measurement Approaches (AMA). BCBS, July 2009
- 135. SOURCE: Observed range of practice in key elements of Advanced Measurement Approaches (AMA). BCBS, July 2009
- 136. SCENARIO RISK DRIVERS RCSA may help to identify the business lines and event types of high
- 137. SCENARIO DISTRIBUTION SOURCE: Results from the 2008 Loss Data Collection Exercise for Operational Risk. BCBS, July
- 138. HIGH SEVERITY SCENARIO EXAMPLES Large loan or card fraud (internal / external) High-scale unauthorized trading Legislation
- 139. SCENARIO PARAMETERS
- 140. QUANTIFICATION USE Scenario estimates should add high frequency, but low severity internal loss data Scenarios account
- 141. Overconfidence: underestimation of risk due to the number of observed events being small Availability: overestimation of
- 142. Banks are likely to deviate from true risk estimate due to low frequency of events, too
- 143. Established scenario framework should ensure the integrity and consistency of the estimates produced with the following
- 144. Table of Contents
- 145. Table of Contents
- 146. RISK TAKING & MANAGEMENT OPTIONS Profit>Ri sk Cost =>Perform activity => OpRisk taking Profit => abandon
- 147. Processes People Systems External events OP RISK MITIGATION Mitigate Cause s Risk managem ent options
- 148. BSBC PRINCIPLE 10: BUSINESS RESILIENCY AND CONTINUITY PLANNING BC-Plans shall take into account different types of
- 149. BUSINESS CONTINUITY PLANNING BCP = disaster prevention & disaster recovery planning. Disaster prevention aims to reduce
- 150. BCP PHASING - Phase 1: Project Planning Identify disaster scenarios to be addressed - Develop Standards
- 151. BCP SCENARIO/RISK ANALYSIS BASED Scenario & Risk Analysis Health Check of Physical & IT Security Controls;
- 152. CRISIS MANAGEMENT STRUCTURE
- 153. PERIODIC BCP CHECKS BCP ought to fit the activity, prioritizing the core ones. BCP covers all
- 154. BCP TIPS Simple preventive measures – geographic dispersion of intellectual capital; Implement alternative IT solutions for
- 155. Processes People Systems External events Insure X E.g.: Vault transport of cash X Bankers professional indemnity
- 156. INSURANCE Conditions: Must be related to actual risk exposure of bank to evidence need for mitigation,
- 157. INSURANCE MITIGATION UNDER AMA
- 158. OUTSOURCING RISKS Op Risk Outsourcing drivers Cost reduction Higher process quality Risk sharing/ transfer Benefits from
- 159. COMPETITIVE EDGE –OUTSOURCING IS NOT OR-FREE “Prudent Outsourcer” Rules The final responsibility towards clients and supervisors
- 160. ART (Alternative Risk Transfer) Regulators concerns: -Complex voidance clauses narrowly defined insured / risk events Limitations
- 161. Table of Contents
- 162. OpRisk CORPORATE GOVERNANCE Clear org structure with defined lines of responsibility Hierarchic decision- making process Adequate
- 163. RISK GOVERNANCE: 3 (4) LINES OF DEFENSE Role of Supervisors -Conduct regular independent evaluations of banks‘
- 164. RISK MANAGEMENT ORGANIZATION
- 165. OpRisk GOVERNANCE INTERNAL STRUCTURE 1. Supervisory Board Responsible to implement risk mgnt strategy Approves and periodically
- 166. OpRisk Governance Support Element ORM Tasks & Responsibility
- 167. SPECIAL ROLE OF RISK FUNCTION Policy Monitoring Assessment Systems Methodology Other (optional) Develop, adapt & maintain
- 168. RISK GOVERNANCE ELEMENTS
- 169. ORM GOVERNANCE FRAMEWORK Evolving Governance Model: (1)a central OpRisk Mngr reporting to the CRO. The role
- 170. OR GOVERNANCE STRUCTURE: DB EXAMPLE Head Risk Committee(s) initiates Line management ORM function Audit Compliance CRO
- 171. DISCLOSURE TO EXTERNAL STAKEHOLDERS -Meet rating agency expectations (ORM assessment form part of their overall firm‘s
- 172. RULES OF STAKEHOLDER ENGAGEMENT ❑Do internal (“machine room”) and external (context) intelligence; ❑Communication team composition: Experts
- 173. - Who are your stakeholders? -What’s your Symbol (Brand, Reputation)? - Is it worth protecting?
- 174. BENEFITS OF OR GOVERNANCE ✔ Reduction of operational losses; ✔ Improved business and performance management; ✔Protection
- 175. ORM IS SIMPLY GOOD CORPORATE GOVERNANCE Good ORM Fewer Surprises Increased shareholder value
- 176. Table of Contents
- 177. Contact information INTERNATIONAL FINANCE CORPORATION (IFC) Bank Advisory Program Central Asia and Eastern Europe Yevgeni Prokopenko,
- 179. Скачать презентацию
Table of Contents
Table of Contents
Table of Contents
Table of Contents

Table of Contents
Table of Contents
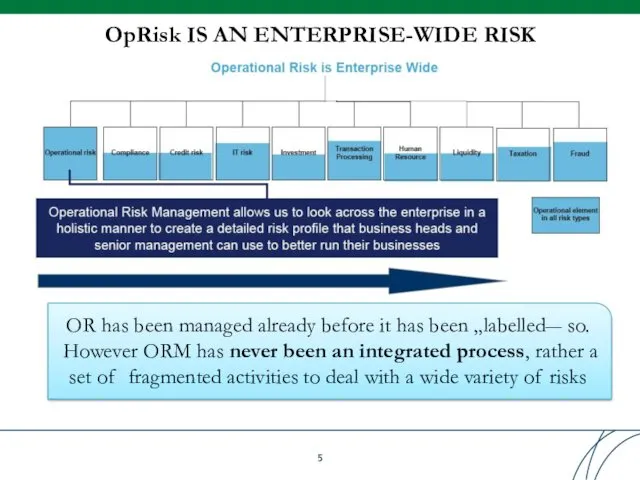
OpRisk IS AN ENTERPRISE-WIDE RISK
OR has been managed already before it
OpRisk IS AN ENTERPRISE-WIDE RISK
OR has been managed already before it
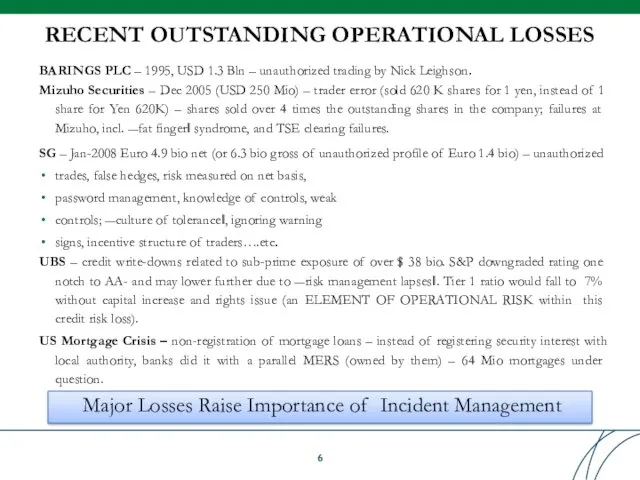
RECENT OUTSTANDING OPERATIONAL LOSSES
BARINGS PLC – 1995, USD 1.3 Bln –
RECENT OUTSTANDING OPERATIONAL LOSSES
BARINGS PLC – 1995, USD 1.3 Bln –
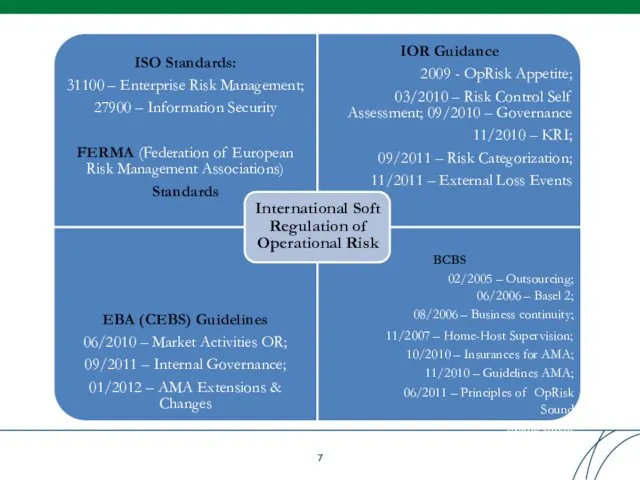
ISO Standards:
31100 – Enterprise Risk Management;
27900 – Information Security
FERMA (Federation of
ISO Standards:
31100 – Enterprise Risk Management;
27900 – Information Security
FERMA (Federation of
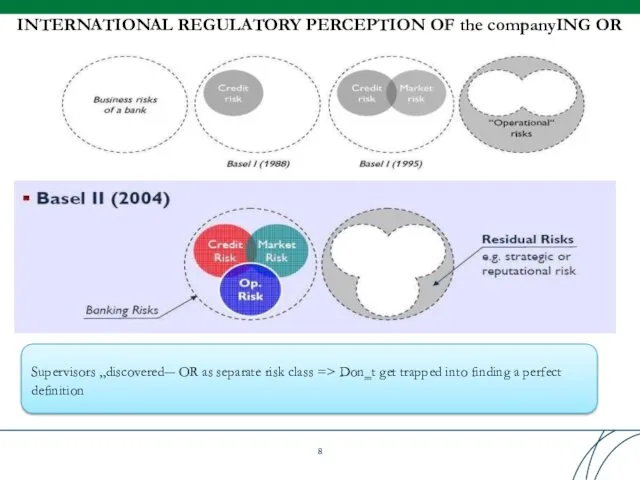
INTERNATIONAL REGULATORY PERCEPTION OF the companyING OR
Supervisors „discovered― OR as separate
INTERNATIONAL REGULATORY PERCEPTION OF the companyING OR
Supervisors „discovered― OR as separate
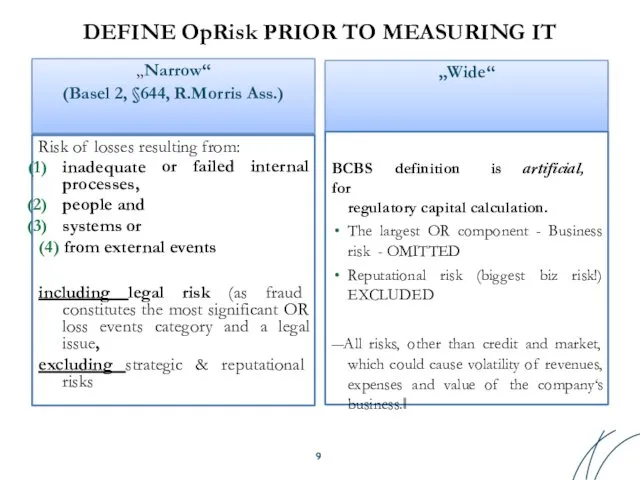
DEFINE OpRisk PRIOR TO MEASURING IT
„Wide“
„Narrow“
(Basel 2, §644, R.Morris Ass.)
Risk of
DEFINE OpRisk PRIOR TO MEASURING IT
„Wide“
„Narrow“
(Basel 2, §644, R.Morris Ass.)
Risk of
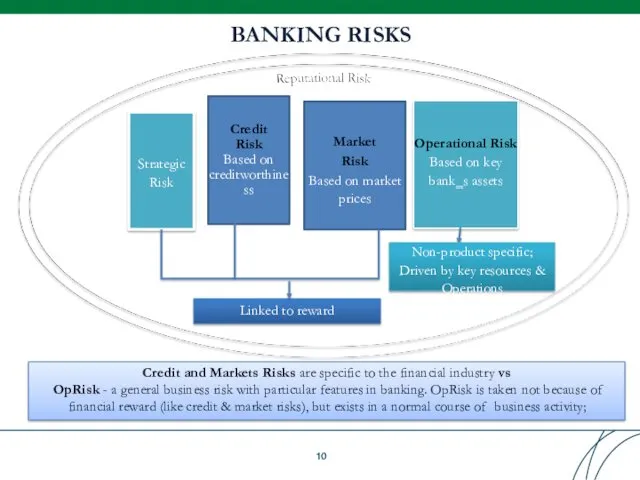
BANKING RISKS
Strategic Risk
Credit Risk Based on
creditworthine
ss
Market
Risk
Based on market prices
Operational Risk Based
BANKING RISKS
Strategic Risk
Credit Risk Based on
creditworthine
ss
Market
Risk
Based on market prices
Operational Risk Based
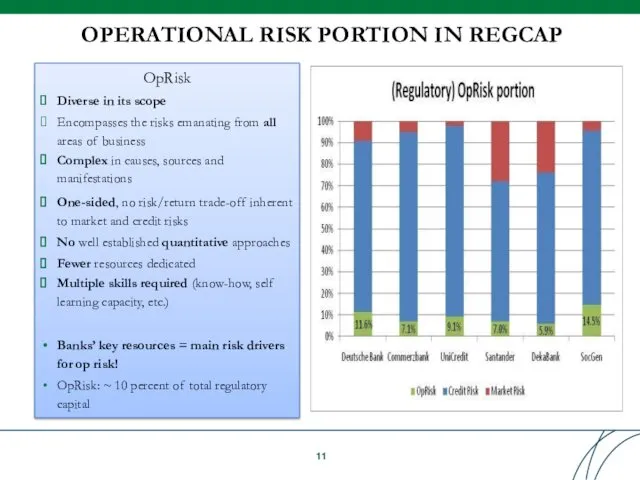
OPERATIONAL RISK PORTION IN REGCAP
OpRisk
Diverse in its scope
Encompasses the risks emanating
OPERATIONAL RISK PORTION IN REGCAP
OpRisk
Diverse in its scope
Encompasses the risks emanating
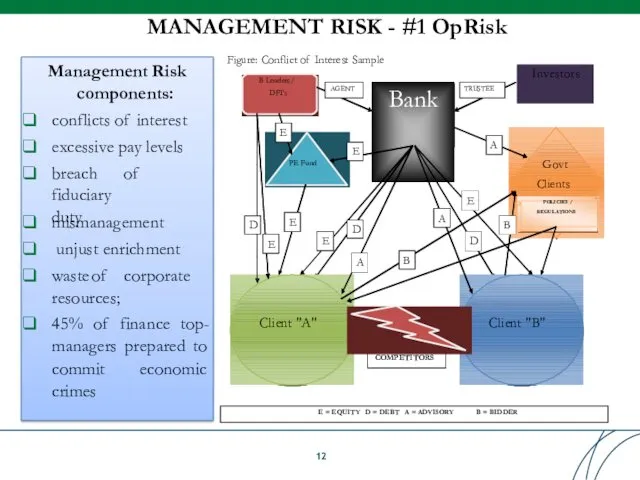
MANAGEMENT RISK - #1 OpRisk
Management Risk
components:
conflicts of interest
excessive pay levels
breach of fiduciary
duty
mismanagement
unjust enrichment
waste of corporate
resources;
45%
MANAGEMENT RISK - #1 OpRisk
Management Risk
components:
conflicts of interest
excessive pay levels
breach of fiduciary
duty
mismanagement
unjust enrichment
waste of corporate
resources;
45%
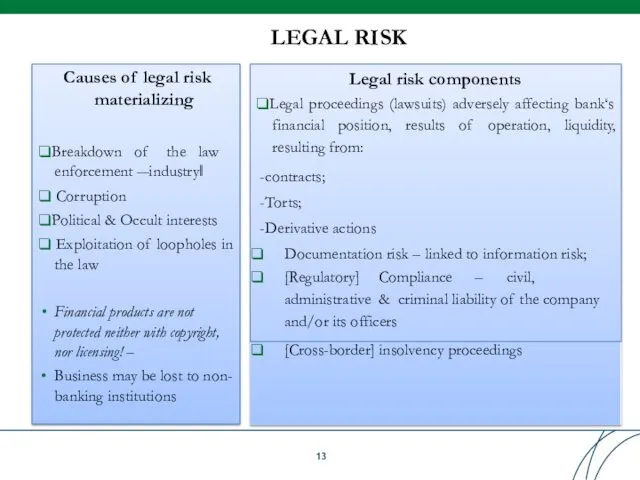
LEGAL RISK
Causes of legal risk materializing
❑Breakdown of the law enforcement ―industry‖
❑ Corruption
❑Political & Occult
LEGAL RISK
Causes of legal risk materializing
❑Breakdown of the law enforcement ―industry‖
❑ Corruption
❑Political & Occult
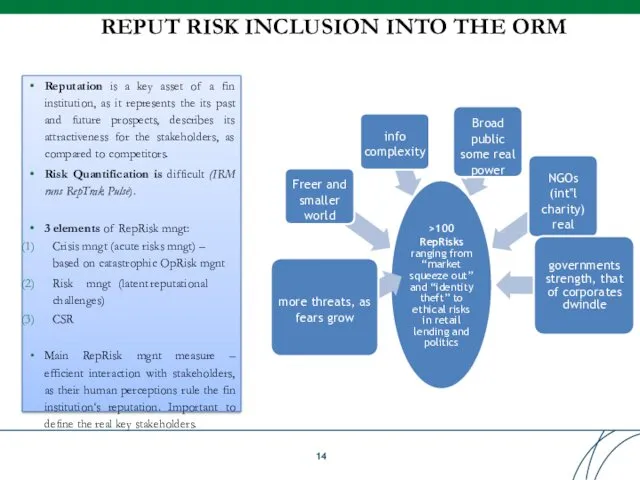
REPUT RISK INCLUSION INTO THE ORM
Reputation is a key asset of
REPUT RISK INCLUSION INTO THE ORM
Reputation is a key asset of
Table of Contents
Table of Contents
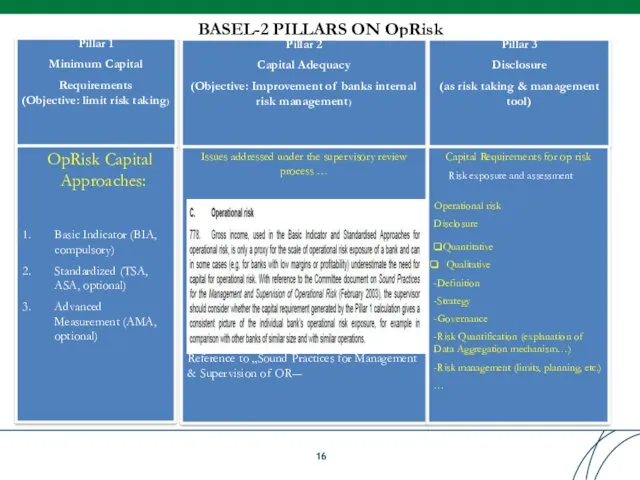
BASEL-2 PILLARS ON OpRisk
Pillar 1 Minimum Capital
Requirements (Objective: limit risk taking)
Pillar
BASEL-2 PILLARS ON OpRisk
Pillar 1 Minimum Capital
Requirements (Objective: limit risk taking)
Pillar
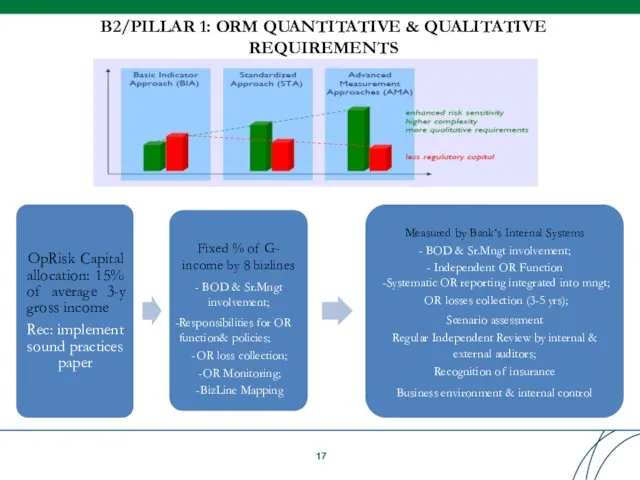
B2/PILLAR 1: ORM QUANTITATIVE & QUALITATIVE
REQUIREMENTS
OpRisk Capital allocation: 15% of average
B2/PILLAR 1: ORM QUANTITATIVE & QUALITATIVE
REQUIREMENTS
OpRisk Capital allocation: 15% of average
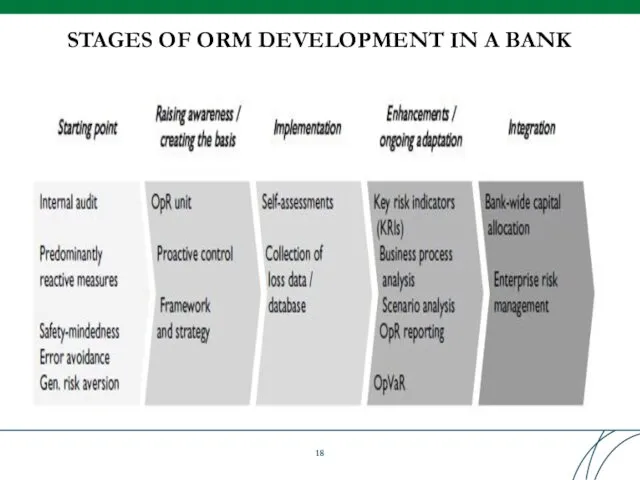
STAGES OF ORM DEVELOPMENT IN A BANK
STAGES OF ORM DEVELOPMENT IN A BANK
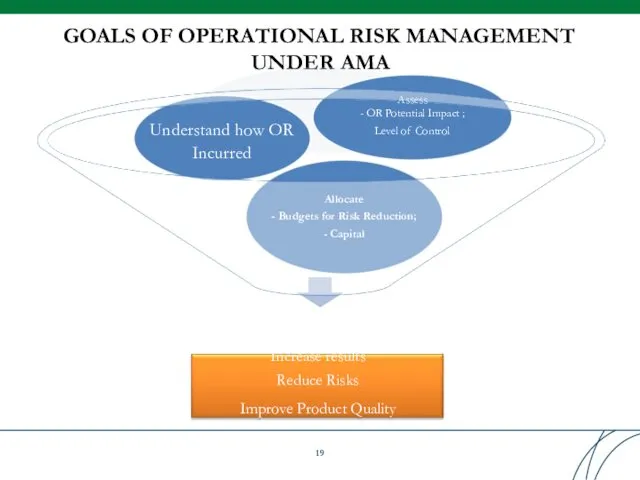
GOALS OF OPERATIONAL RISK MANAGEMENT UNDER AMA
Allocate
- Budgets for Risk Reduction;
-
GOALS OF OPERATIONAL RISK MANAGEMENT UNDER AMA
Allocate
- Budgets for Risk Reduction;
-
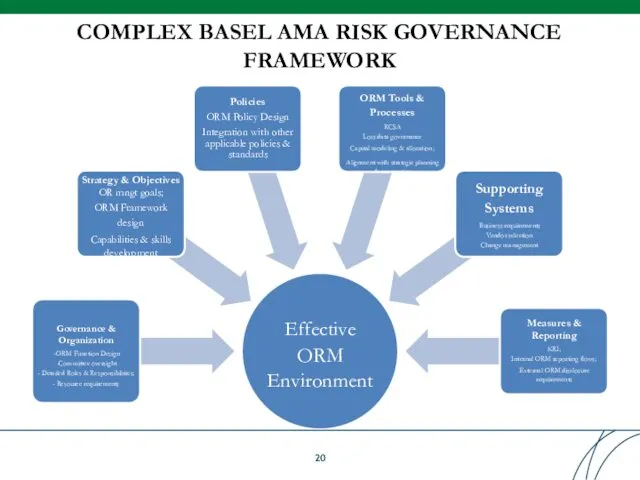
COMPLEX BASEL AMA RISK GOVERNANCE FRAMEWORK
Effective
ORM
Environment
Governance & Organization
ORM Function Design
Committee oversight
-
COMPLEX BASEL AMA RISK GOVERNANCE FRAMEWORK
Effective
ORM
Environment
Governance & Organization
ORM Function Design
Committee oversight
-
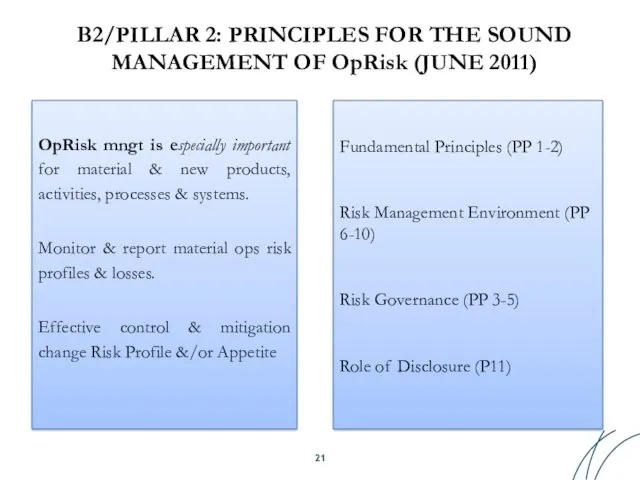
B2/PILLAR 2: PRINCIPLES FOR THE SOUND
MANAGEMENT OF OpRisk (JUNE 2011)
OpRisk mngt
B2/PILLAR 2: PRINCIPLES FOR THE SOUND
MANAGEMENT OF OpRisk (JUNE 2011)
OpRisk mngt
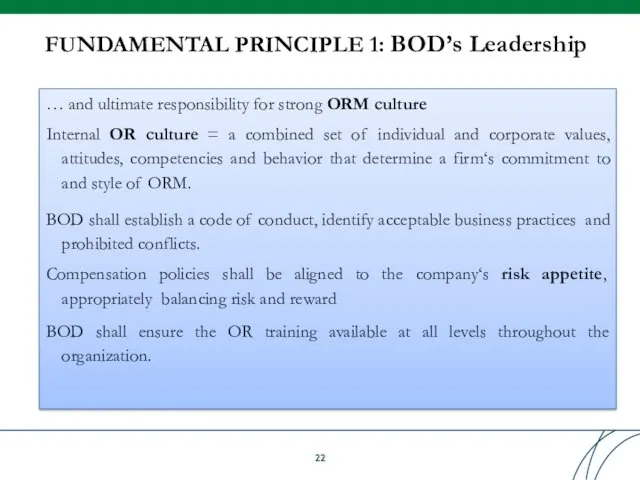
FUNDAMENTAL PRINCIPLE 1: BOD’s Leadership
… and ultimate responsibility for strong ORM
FUNDAMENTAL PRINCIPLE 1: BOD’s Leadership
… and ultimate responsibility for strong ORM
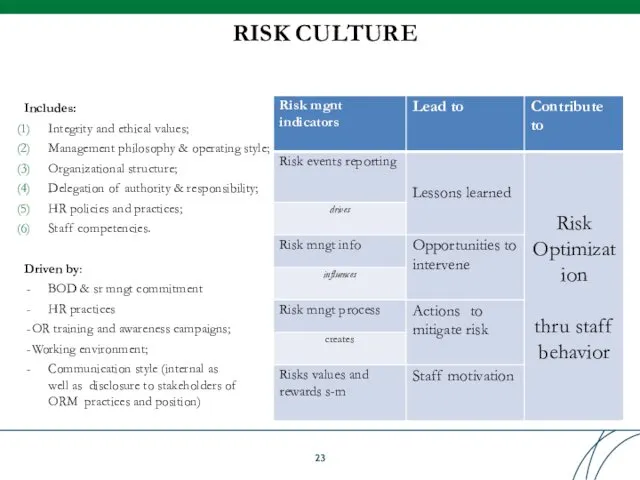
RISK CULTURE
Includes:
Integrity and ethical values;
Management philosophy & operating style;
Organizational structure;
Delegation of
RISK CULTURE
Includes:
Integrity and ethical values;
Management philosophy & operating style;
Organizational structure;
Delegation of
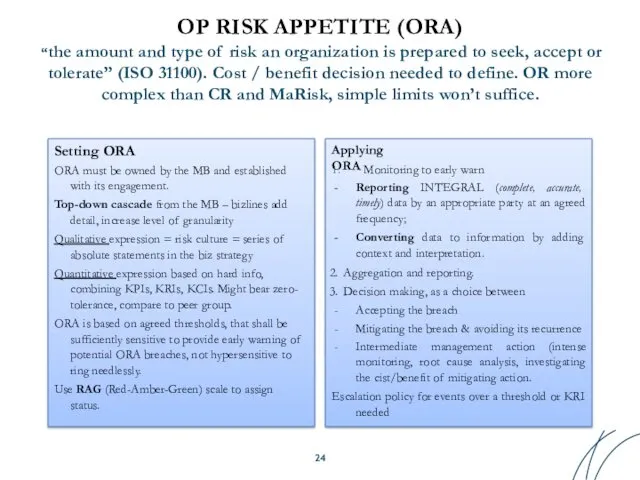
OP RISK APPETITE (ORA)
“the amount and type of risk an organization
OP RISK APPETITE (ORA)
“the amount and type of risk an organization
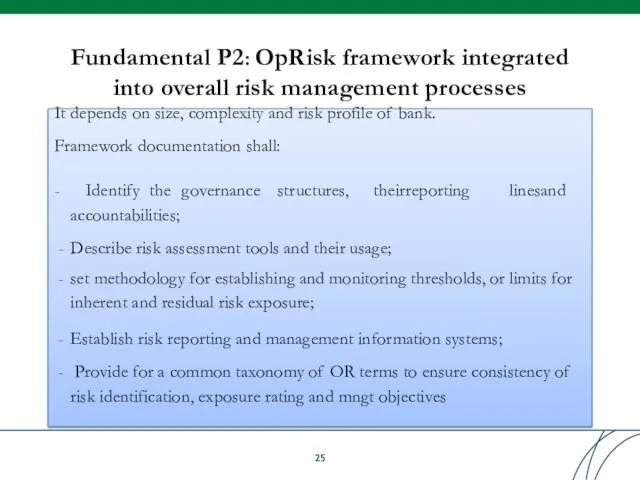
Fundamental P2: OpRisk framework integrated into overall risk management processes
It depends
Fundamental P2: OpRisk framework integrated into overall risk management processes
It depends
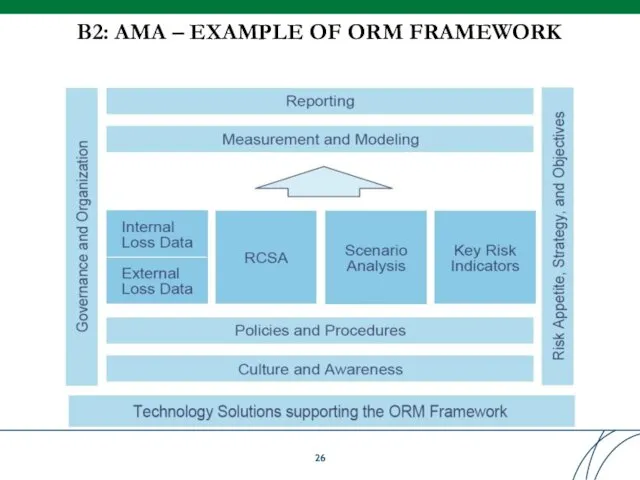
B2: AMA – EXAMPLE OF ORM FRAMEWORK
B2: AMA – EXAMPLE OF ORM FRAMEWORK
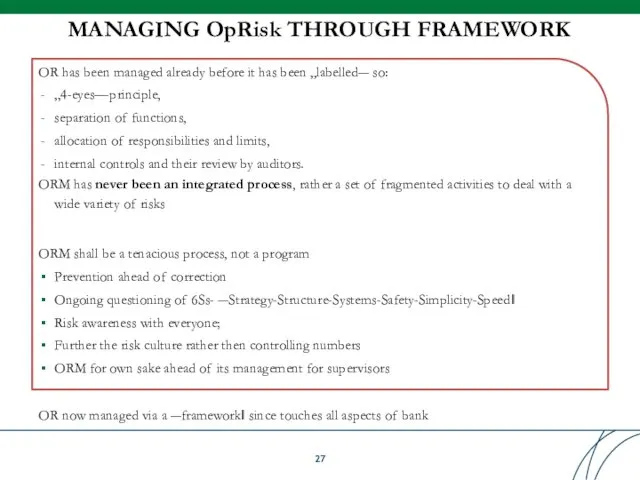
MANAGING OpRisk THROUGH FRAMEWORK
OR has been managed already before it has
MANAGING OpRisk THROUGH FRAMEWORK
OR has been managed already before it has
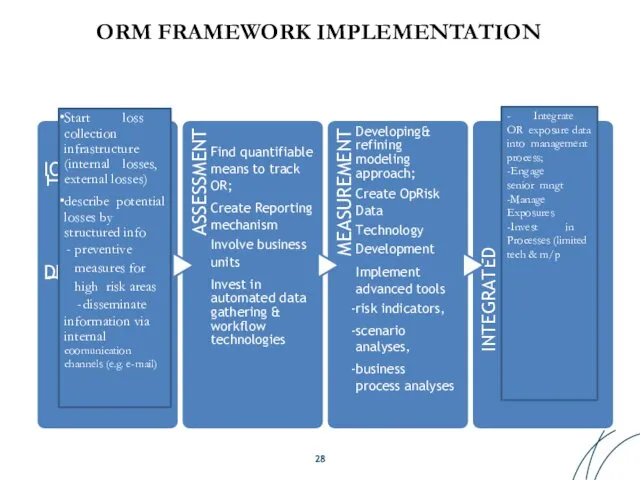
ORM FRAMEWORK IMPLEMENTATION
I
T
ION
DENTIFICA
ASSESSMENT
Find quantifiable means to track OR;
Create Reporting mechanism
Involve business
units
Invest
ORM FRAMEWORK IMPLEMENTATION
I
T
ION
DENTIFICA
ASSESSMENT
Find quantifiable means to track OR;
Create Reporting mechanism
Involve business
units
Invest
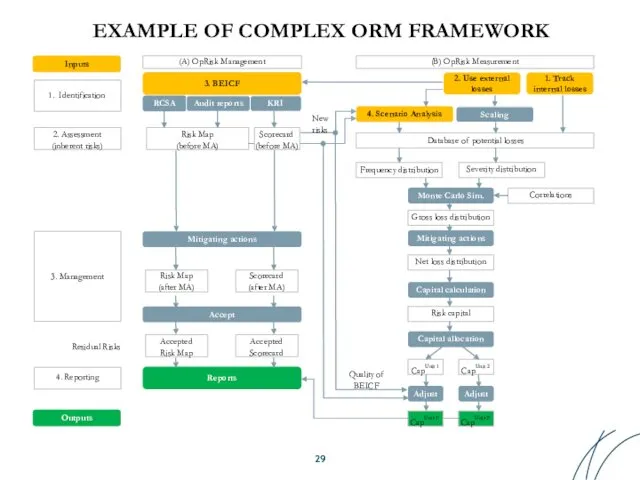
EXAMPLE OF COMPLEX ORM FRAMEWORK
Mitigating actions
Mitigating actions
Net loss distribution
Risk capital
Capital allocation
CapUnit
EXAMPLE OF COMPLEX ORM FRAMEWORK
Mitigating actions
Mitigating actions
Net loss distribution
Risk capital
Capital allocation
CapUnit
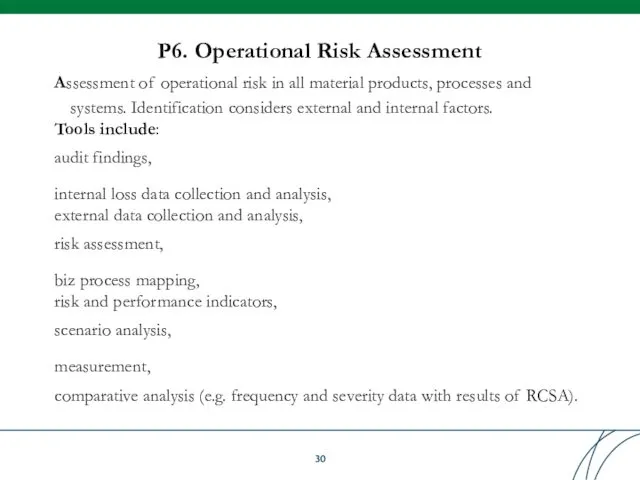
P6. Operational Risk Assessment
Assessment of operational risk in all material products,
P6. Operational Risk Assessment
Assessment of operational risk in all material products,
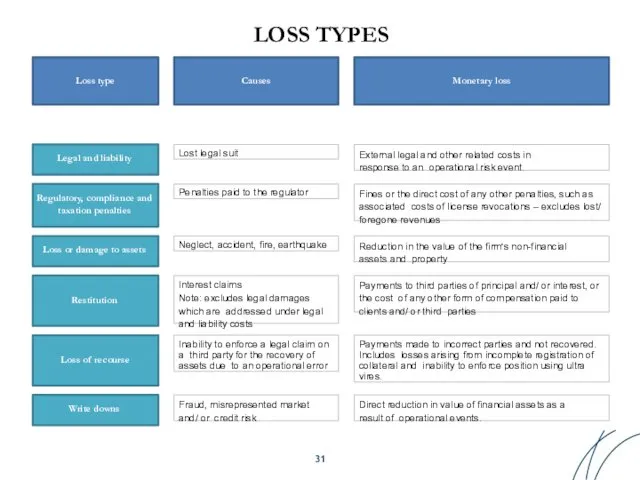
LOSS TYPES
Loss type
Causes
Monetary loss
Legal and liability
Lost legal suit
External legal and other
LOSS TYPES
Loss type
Causes
Monetary loss
Legal and liability
Lost legal suit
External legal and other
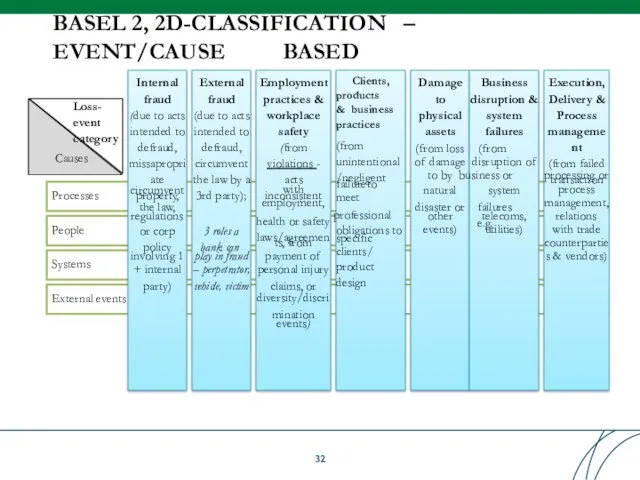
Processes
People
Systems
External events
BASEL 2, 2D-CLASSIFICATION – EVENT/CAUSE
BASED
Internal fraud
(due to acts intended to defraud,
Processes
People
Systems
External events
BASEL 2, 2D-CLASSIFICATION – EVENT/CAUSE
BASED
Internal fraud
(due to acts intended to defraud,
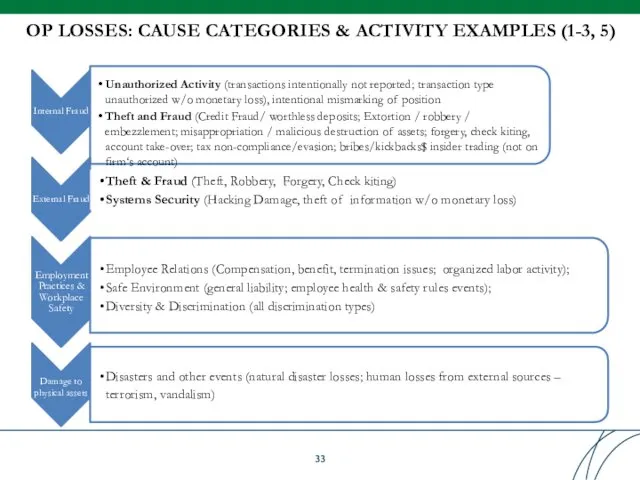
Internal Fraud
Unauthorized Activity (transactions intentionally not reported; transaction type unauthorized w/o
Internal Fraud
Unauthorized Activity (transactions intentionally not reported; transaction type unauthorized w/o
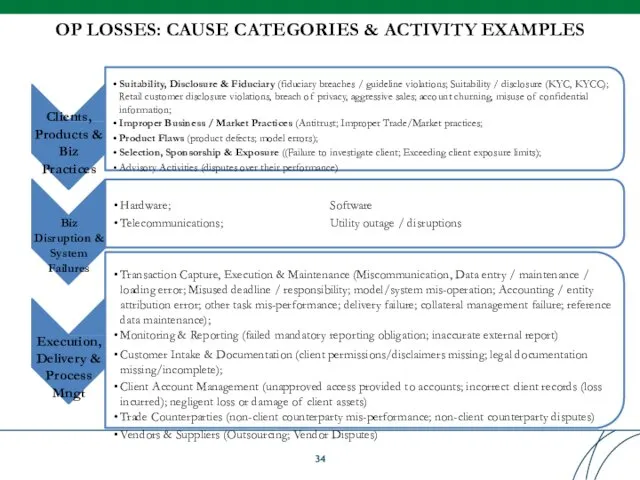
OP LOSSES: CAUSE CATEGORIES & ACTIVITY EXAMPLES
Clients, Products & Biz Practices
Suitability,
OP LOSSES: CAUSE CATEGORIES & ACTIVITY EXAMPLES
Clients, Products & Biz Practices
Suitability,
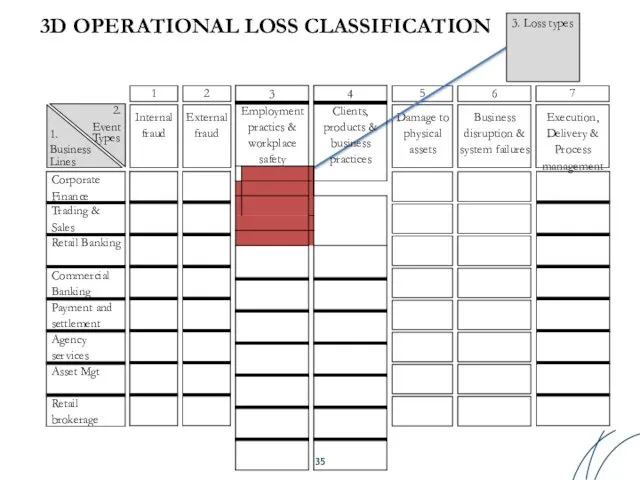
3D OPERATIONAL LOSS CLASSIFICATION
Internal fraud
External fraud
Damage to physical assets
Business disruption &
3D OPERATIONAL LOSS CLASSIFICATION
Internal fraud
External fraud
Damage to physical assets
Business disruption &
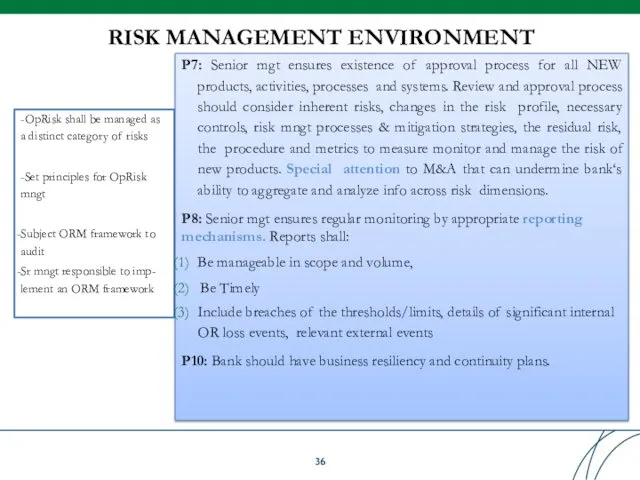
RISK MANAGEMENT ENVIRONMENT
-OpRisk shall be managed as a distinct category of
RISK MANAGEMENT ENVIRONMENT
-OpRisk shall be managed as a distinct category of
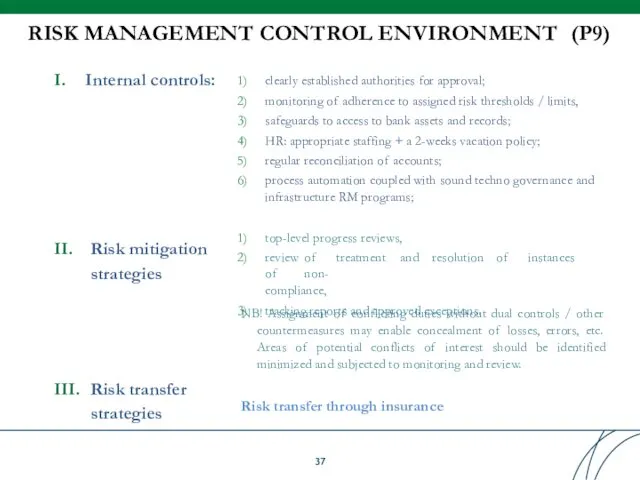
RISK MANAGEMENT CONTROL ENVIRONMENT (P9)
I. Internal controls:
II. Risk mitigation strategies
III. Risk transfer strategies
clearly established authorities
RISK MANAGEMENT CONTROL ENVIRONMENT (P9)
I. Internal controls:
II. Risk mitigation strategies
III. Risk transfer strategies
clearly established authorities
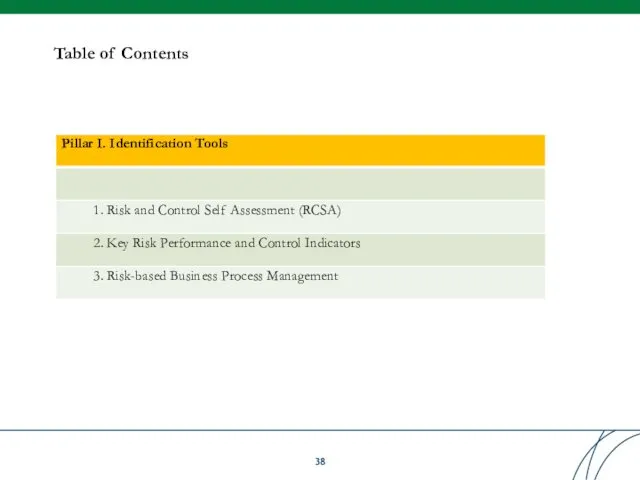
Table of Contents
Table of Contents
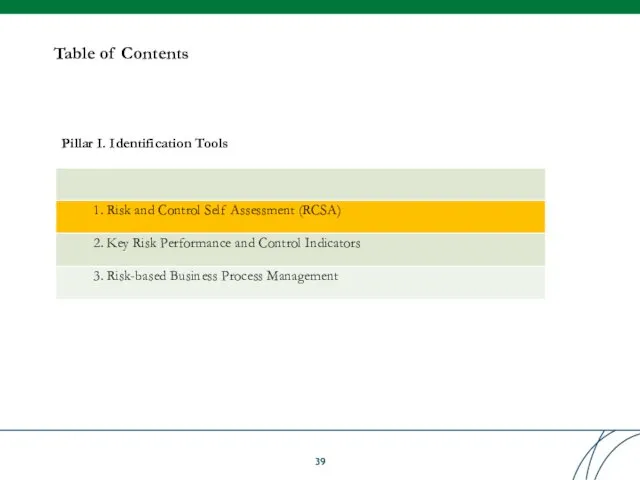
Table of Contents
Table of Contents
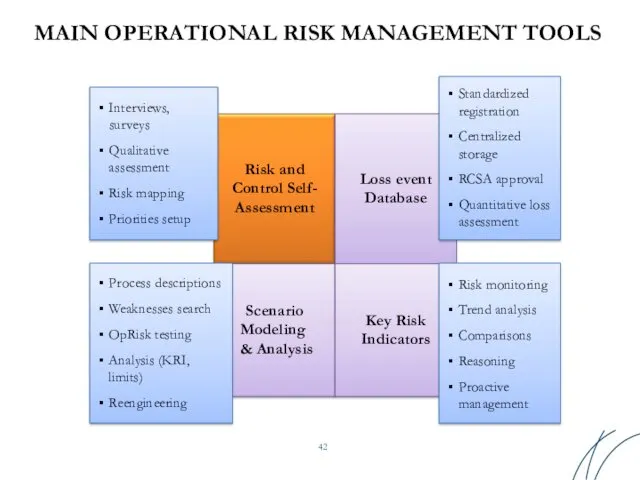
MAIN OPERATIONAL RISK MANAGEMENT TOOLS
Risk and
Control Self-
Assessment
Loss event Database
Scenario Modeling &
MAIN OPERATIONAL RISK MANAGEMENT TOOLS
Risk and
Control Self-
Assessment
Loss event Database
Scenario Modeling &
RCSA: PROACTIVE RISK IDENTIFICATION & MANAGEMENT TOOL
risks &
Business lines & support functions assess controls in their area;
RCSA
RCSA: PROACTIVE RISK IDENTIFICATION & MANAGEMENT TOOL
risks &
Business lines & support functions assess controls in their area;
RCSA
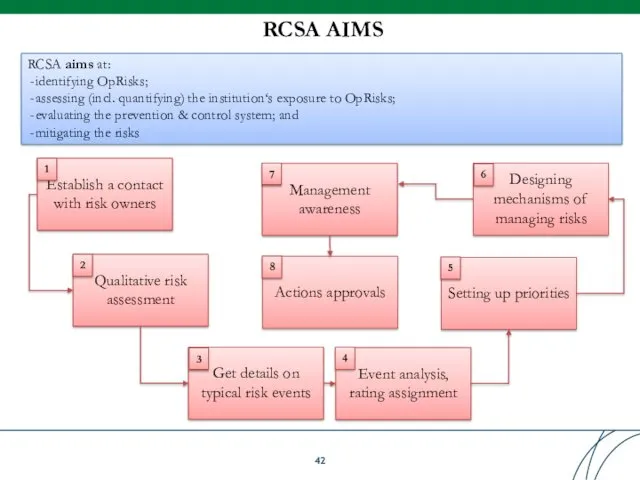
RCSA AIMS
Establish a contact
with risk owners
Qualitative risk
assessment
Get details on
typical risk events
Event
RCSA AIMS
Establish a contact
with risk owners
Qualitative risk
assessment
Get details on
typical risk events
Event
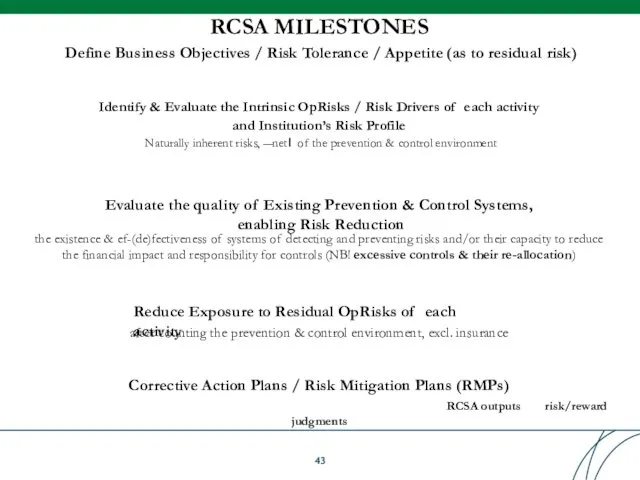
RCSA MILESTONES
Corrective Action Plans / Risk Mitigation Plans (RMPs)
Exterminate weak areas
RCSA MILESTONES
Corrective Action Plans / Risk Mitigation Plans (RMPs)
Exterminate weak areas
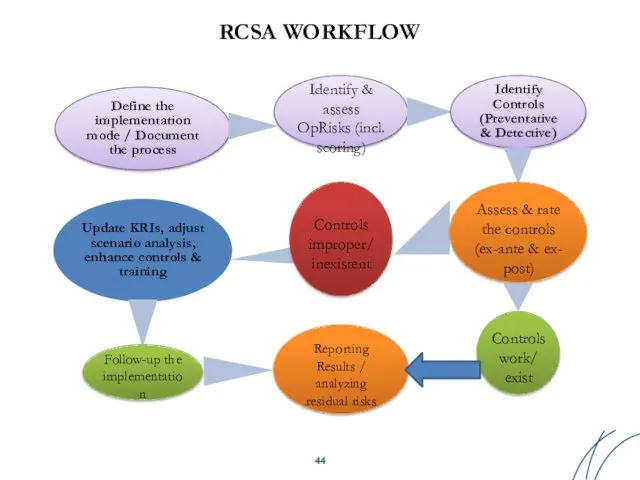
RCSA WORKFLOW
Define the implementation mode / Document the process
Update KRIs, adjust
RCSA WORKFLOW
Define the implementation mode / Document the process
Update KRIs, adjust
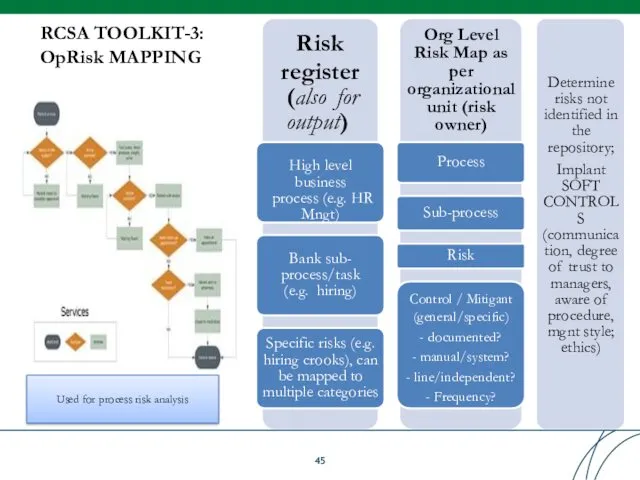
RCSA TOOLKIT-3:
OpRisk MAPPING
Risk
register (also for output)
High level business process (e.g. HR
RCSA TOOLKIT-3:
OpRisk MAPPING
Risk
register (also for output)
High level business process (e.g. HR
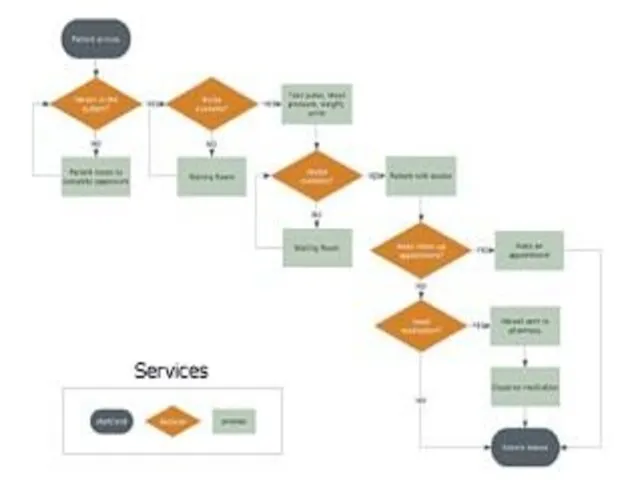
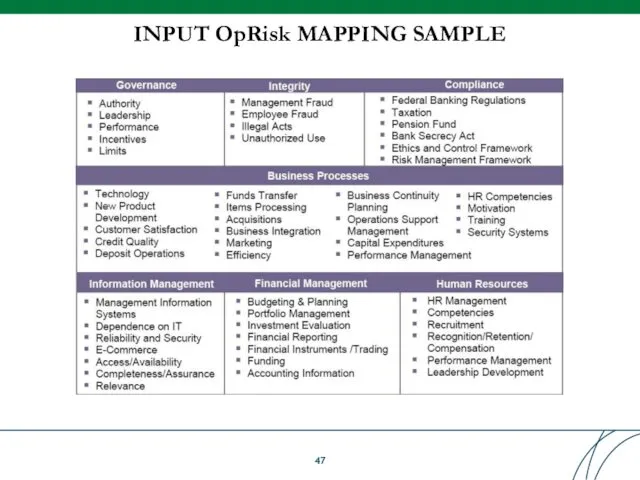
INPUT OpRisk MAPPING SAMPLE
INPUT OpRisk MAPPING SAMPLE
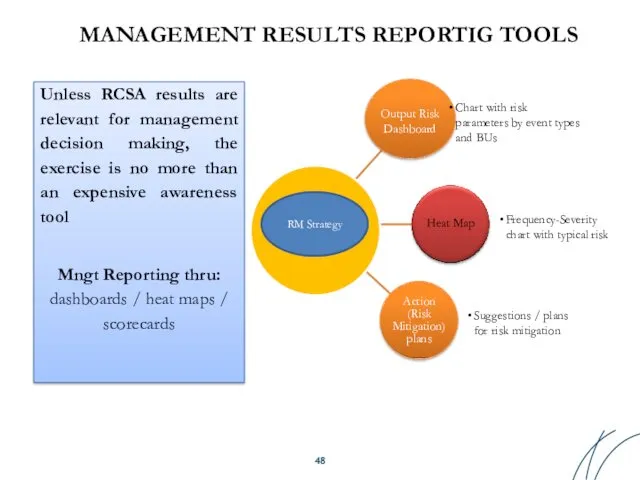
MANAGEMENT RESULTS REPORTIG TOOLS
Unless RCSA results are relevant for management decision
MANAGEMENT RESULTS REPORTIG TOOLS
Unless RCSA results are relevant for management decision
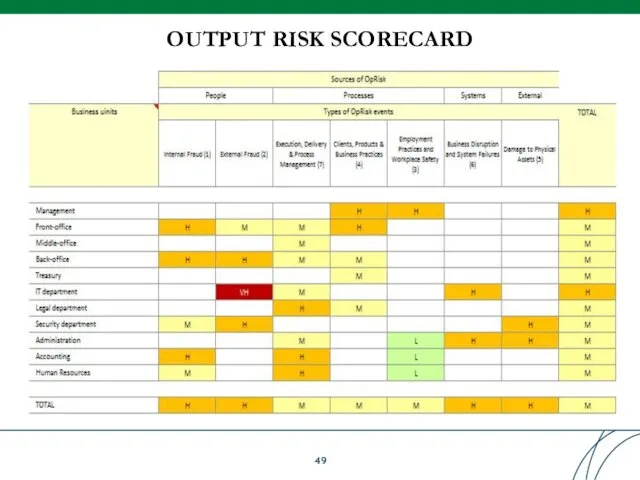
OUTPUT RISK SCORECARD
OUTPUT RISK SCORECARD
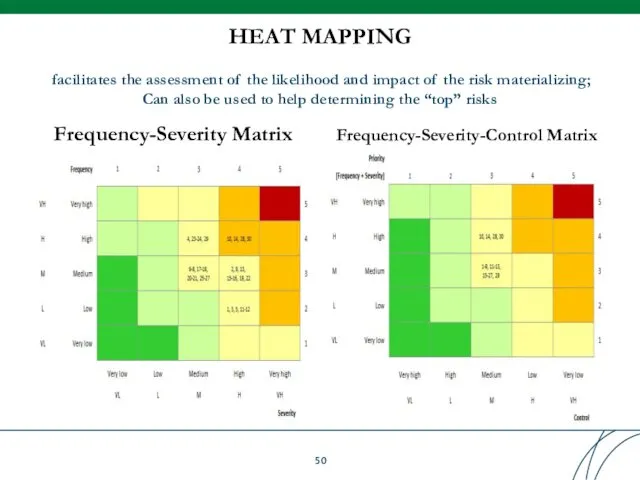
HEAT MAPPING
facilitates the assessment of the likelihood and impact of the
HEAT MAPPING
facilitates the assessment of the likelihood and impact of the
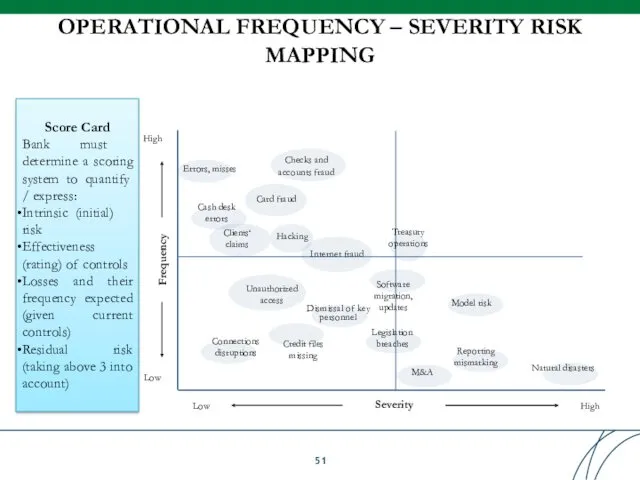
OPERATIONAL FREQUENCY – SEVERITY RISK
MAPPING
Card fraud
Frequency
Severity
High
Low
Low
High
Unauthorized access
Checks and
accounts fraud
Errors, misses
Internet fraud
Hacking
Connections
OPERATIONAL FREQUENCY – SEVERITY RISK
MAPPING
Card fraud
Frequency
Severity
High
Low
Low
High
Unauthorized access
Checks and
accounts fraud
Errors, misses
Internet fraud
Hacking
Connections
RCSA FOLLOW UP
RCSA results ought to be used in conjunction with
RCSA FOLLOW UP
RCSA results ought to be used in conjunction with
Table of Contents
Table of Contents
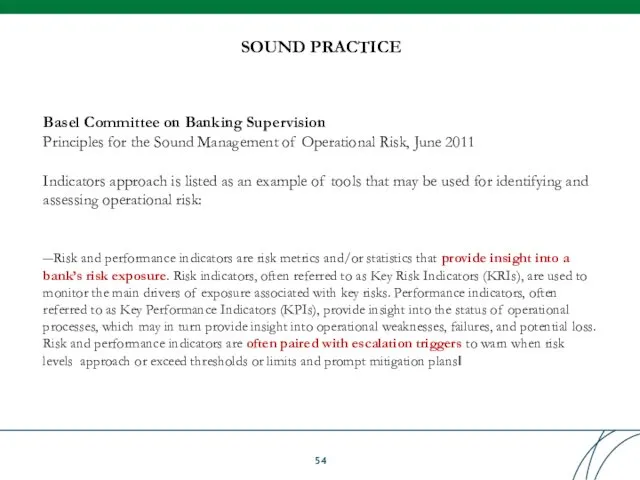
Basel Committee on Banking Supervision
Principles for the Sound Management of Operational
Basel Committee on Banking Supervision
Principles for the Sound Management of Operational
Indicators Approach allows to track operational risk profile and monitor risk
Indicators Approach allows to track operational risk profile and monitor risk
INDICATORS COMPOSITION and DATA SOURCES
Key Risk Indicators (KRI)
Key Performance Indicators (KPI)
Key
INDICATORS COMPOSITION and DATA SOURCES
Key Risk Indicators (KRI)
Key Performance Indicators (KPI)
Key
KRIs are the measures summarizing the frequency, severity and impact of
KRIs are the measures summarizing the frequency, severity and impact of
KEY RISK INDICATORS (2/2)
KEY RISK INDICATORS (2/2)
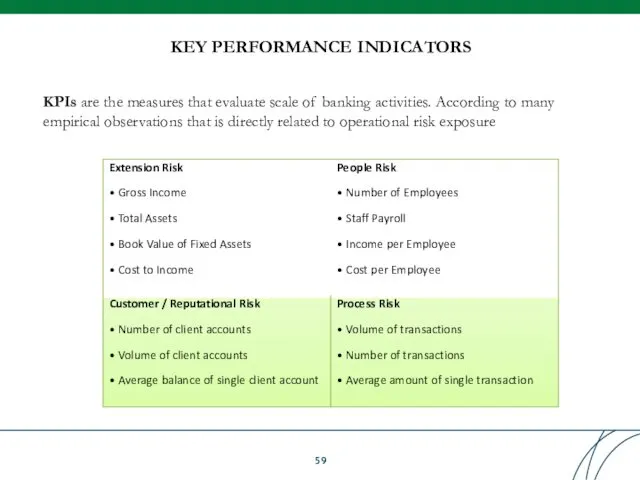
KPIs are the measures that evaluate scale of banking activities. According
KPIs are the measures that evaluate scale of banking activities. According
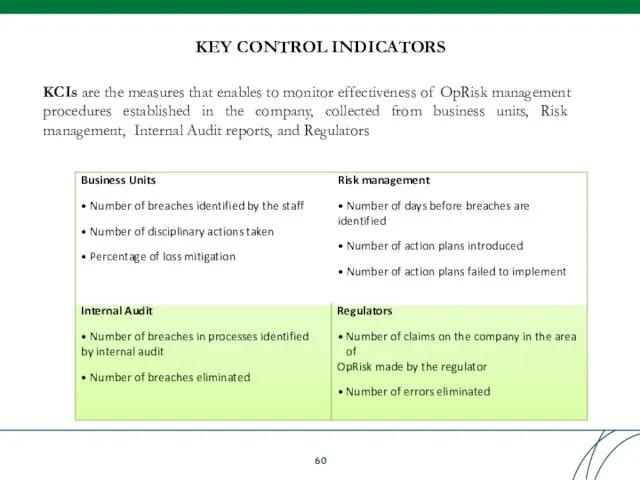
KCIs are the measures that enables to monitor effectiveness of OpRisk
KCIs are the measures that enables to monitor effectiveness of OpRisk
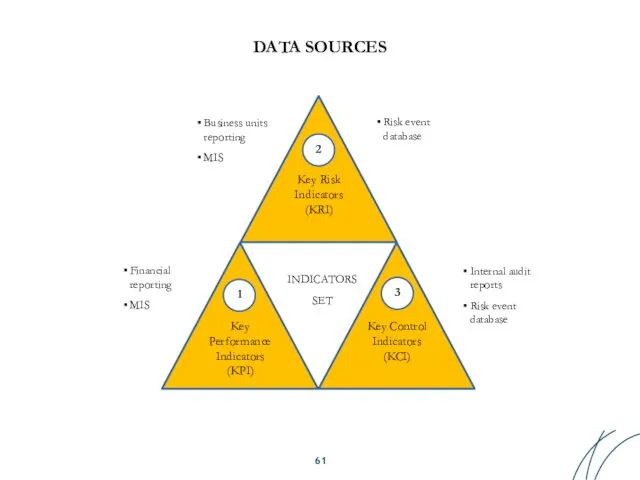
DATA SOURCES
Key Risk Indicators (KRI)
Key Performance Indicators (KPI)
Key Control Indicators (KCI)
INDICATORS
DATA SOURCES
Key Risk Indicators (KRI)
Key Performance Indicators (KPI)
Key Control Indicators (KCI)
INDICATORS
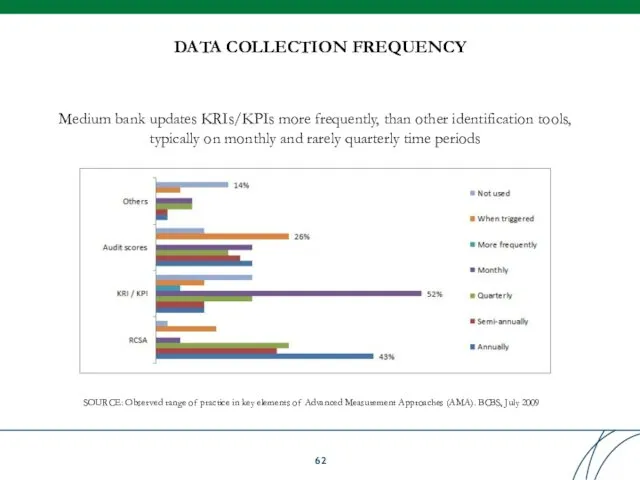
DATA COLLECTION FREQUENCY
SOURCE: Observed range of practice in key elements of
DATA COLLECTION FREQUENCY
SOURCE: Observed range of practice in key elements of
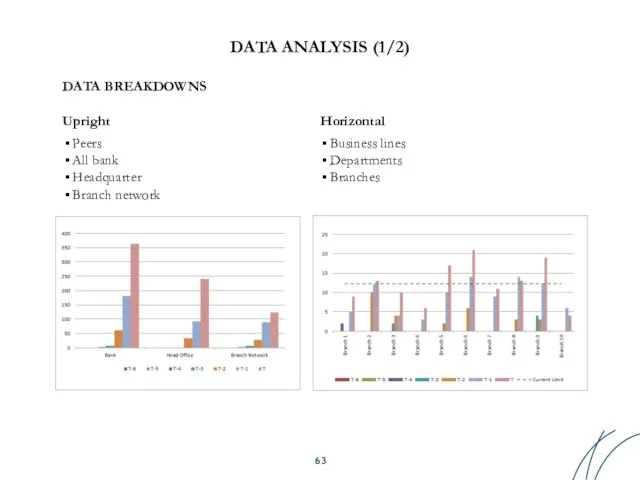
DATA BREAKDOWNS
Upright
Peers
All bank
Headquarter
Branch network
DATA ANALYSIS (1/2)
Horizontal
Business lines
Departments
Branches
DATA BREAKDOWNS
Upright
Peers
All bank
Headquarter
Branch network
DATA ANALYSIS (1/2)
Horizontal
Business lines
Departments
Branches
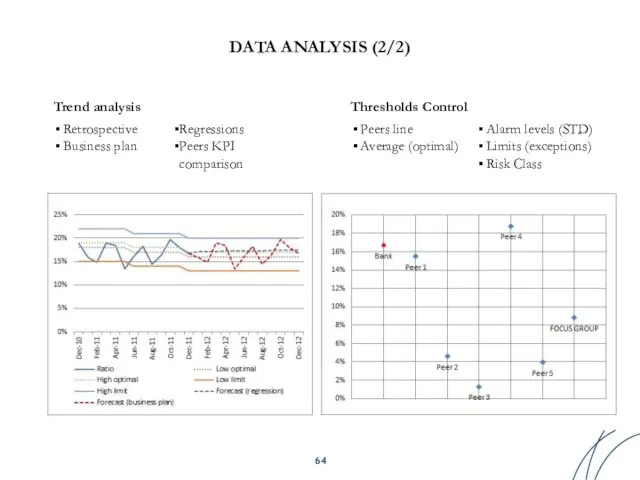
DATA ANALYSIS (2/2)
Trend analysis
Retrospective
Business plan
Regressions
Peers KPI comparison
Thresholds Control
Peers line
Average (optimal)
Alarm levels
DATA ANALYSIS (2/2)
Trend analysis
Retrospective
Business plan
Regressions
Peers KPI comparison
Thresholds Control
Peers line
Average (optimal)
Alarm levels
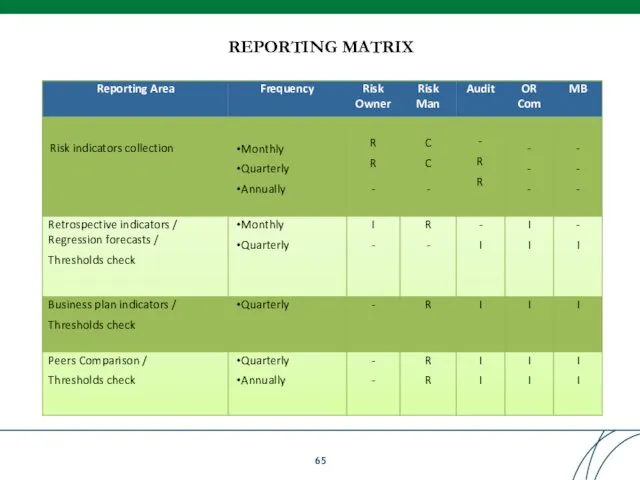
REPORTING MATRIX
REPORTING MATRIX
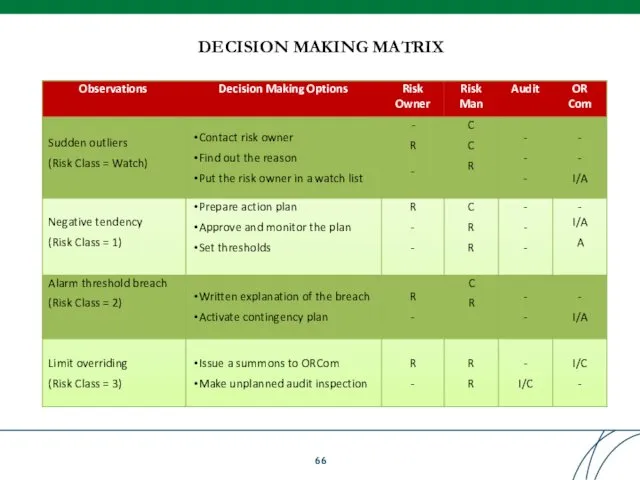
DECISION MAKING MATRIX
DECISION MAKING MATRIX
Table of Contents
Table of Contents
Basel Committee on Banking Supervision
Principles for the Sound Management of Operational
Basel Committee on Banking Supervision
Principles for the Sound Management of Operational
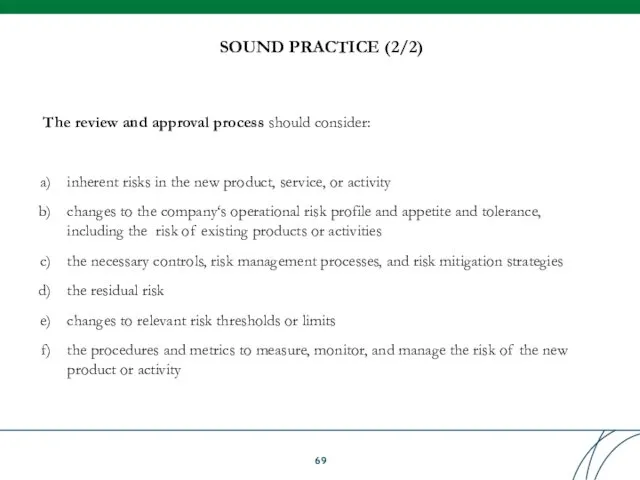
The review and approval process should consider:
inherent risks in the new
The review and approval process should consider:
inherent risks in the new
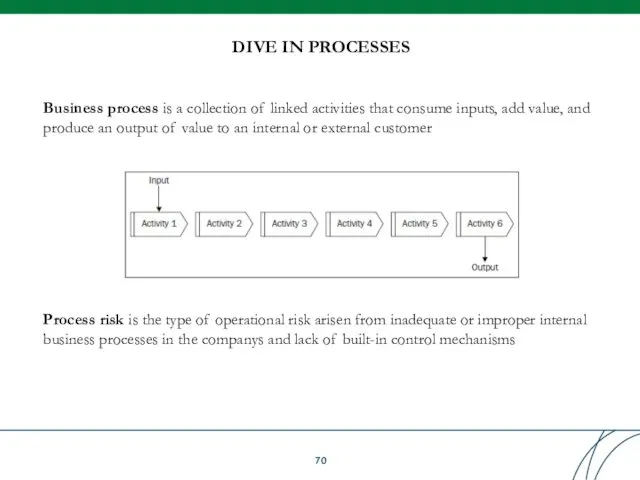
Business process is a collection of linked activities that consume inputs,
Business process is a collection of linked activities that consume inputs,
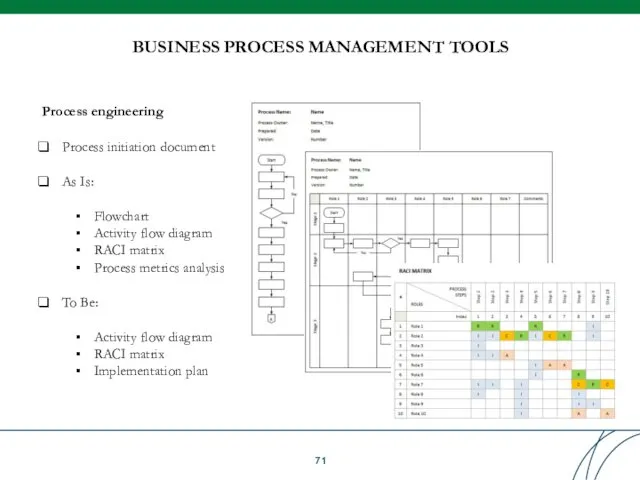
BUSINESS PROCESS MANAGEMENT TOOLS
Process engineering
Process initiation document
As Is:
Flowchart
Activity flow diagram
RACI matrix
Process
BUSINESS PROCESS MANAGEMENT TOOLS
Process engineering
Process initiation document
As Is:
Flowchart
Activity flow diagram
RACI matrix
Process
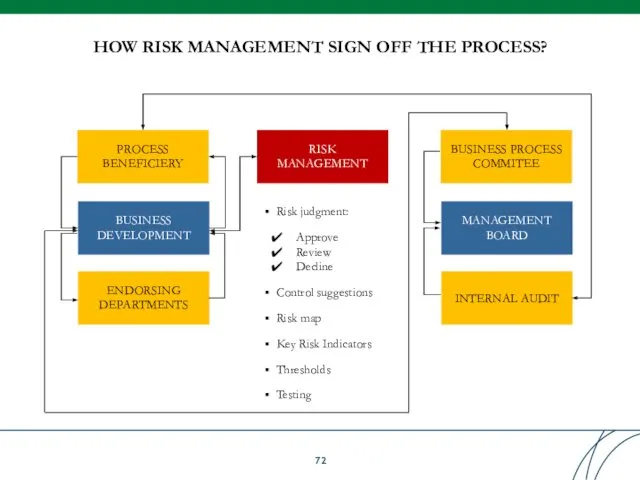
HOW RISK MANAGEMENT SIGN OFF THE PROCESS?
PROCESS BENEFICIERY
BUSINESS DEVELOPMENT
ENDORSING
DEPARTMENTS
RISK MANAGEMENT
Risk judgment:
Approve
Review
Decline
Control
HOW RISK MANAGEMENT SIGN OFF THE PROCESS?
PROCESS BENEFICIERY
BUSINESS DEVELOPMENT
ENDORSING
DEPARTMENTS
RISK MANAGEMENT
Risk judgment:
Approve
Review
Decline
Control
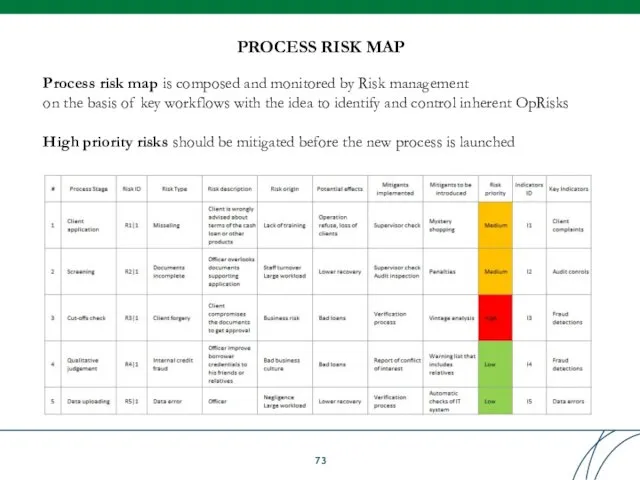
Process risk map is composed and monitored by Risk management
on the
Process risk map is composed and monitored by Risk management
on the
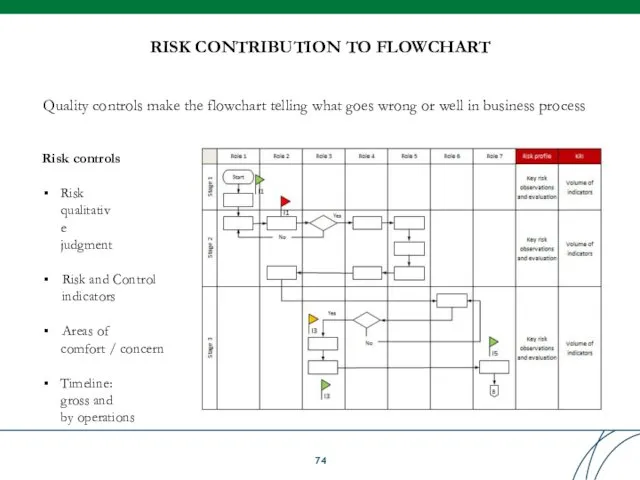
RISK CONTRIBUTION TO FLOWCHART
Quality controls make the flowchart telling what goes
RISK CONTRIBUTION TO FLOWCHART
Quality controls make the flowchart telling what goes
Table of Contents
Table of Contents
Table of Contents
Table of Contents
Basel Committee on Banking Supervision
Principles for the Sound Management of Operational
Basel Committee on Banking Supervision
Principles for the Sound Management of Operational
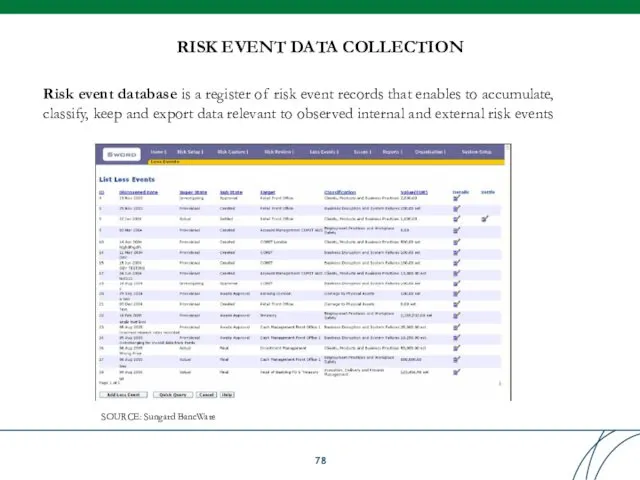
Risk event database is a register of risk event records that
Risk event database is a register of risk event records that
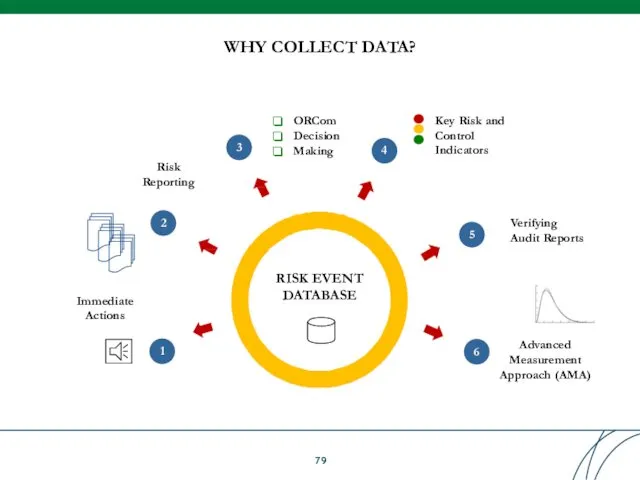
WHY COLLECT DATA?
RISK EVENT DATABASE
Immediate Actions
Advanced Measurement Approach (AMA)
1
2
Risk Reporting
4
Key Risk
WHY COLLECT DATA?
RISK EVENT DATABASE
Immediate Actions
Advanced Measurement Approach (AMA)
1
2
Risk Reporting
4
Key Risk
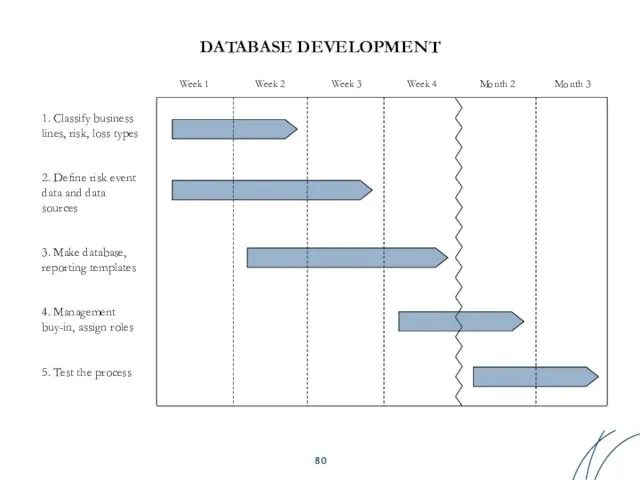
DATABASE DEVELOPMENT
1. Classify business lines, risk, loss types
2. Define risk event
DATABASE DEVELOPMENT
1. Classify business lines, risk, loss types
2. Define risk event
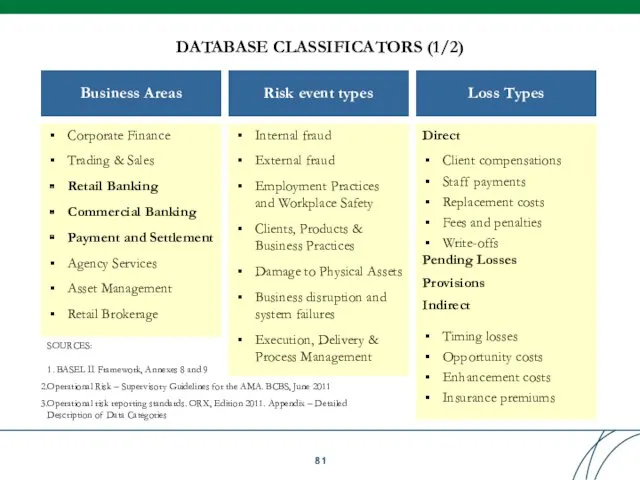
DATABASE CLASSIFICATORS (1/2)
Business Areas
Corporate Finance
Trading & Sales
Retail Banking
Commercial Banking
Payment and Settlement
Agency
DATABASE CLASSIFICATORS (1/2)
Business Areas
Corporate Finance
Trading & Sales
Retail Banking
Commercial Banking
Payment and Settlement
Agency
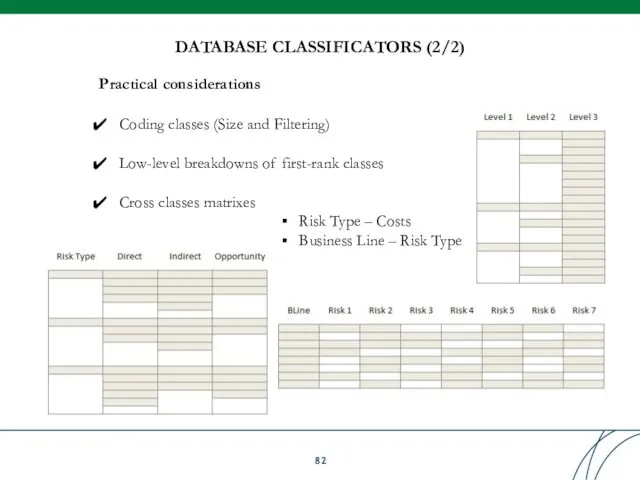
DATABASE CLASSIFICATORS (2/2)
Practical considerations
Coding classes (Size and Filtering)
Low-level breakdowns of first-rank
DATABASE CLASSIFICATORS (2/2)
Practical considerations
Coding classes (Size and Filtering)
Low-level breakdowns of first-rank
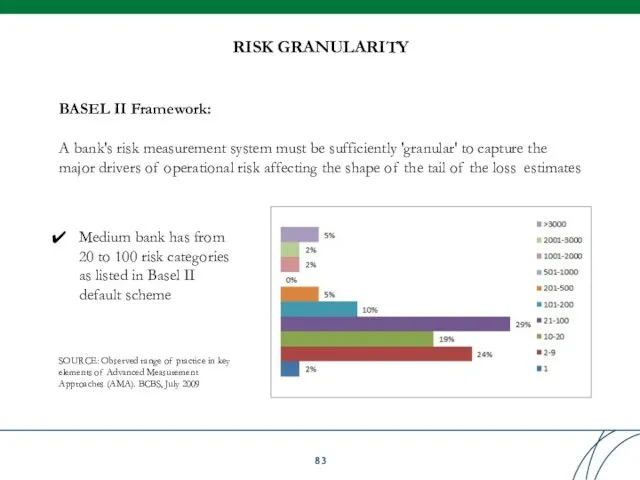
RISK GRANULARITY
BASEL II Framework:
A bank's risk measurement system must be sufficiently
RISK GRANULARITY
BASEL II Framework:
A bank's risk measurement system must be sufficiently
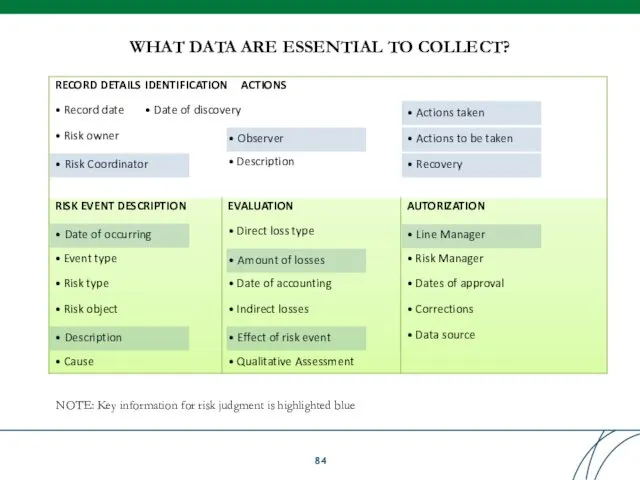
WHAT DATA ARE ESSENTIAL TO COLLECT?
• Risk Coordinator
• Observer
• Actions taken
•
WHAT DATA ARE ESSENTIAL TO COLLECT?
• Risk Coordinator
• Observer
• Actions taken
•
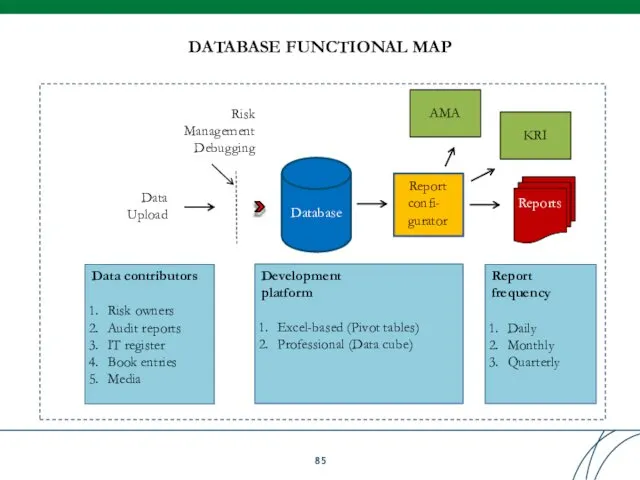
DATABASE FUNCTIONAL MAP
Data
Upload
Database
Report confi- gurator
Reports
Data contributors
Risk owners
Audit reports
IT register
Book entries
Media
Development platform
Excel-based
DATABASE FUNCTIONAL MAP
Data
Upload
Database
Report confi- gurator
Reports
Data contributors
Risk owners
Audit reports
IT register
Book entries
Media
Development platform
Excel-based
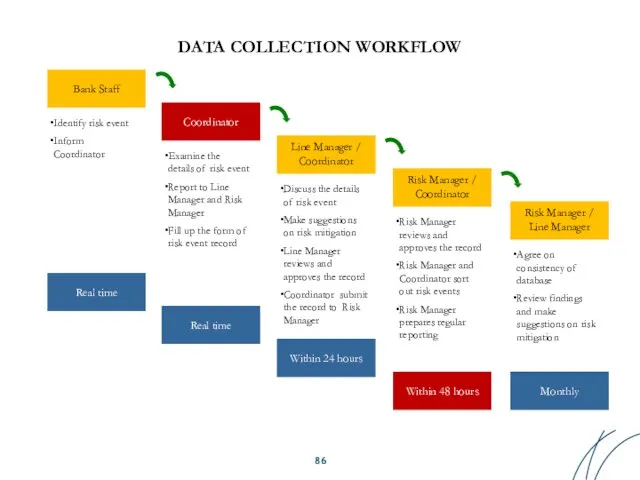
Bank Staff
Coordinator
Identify risk event
Inform Coordinator
Examine the details of risk event
Report to
Coordinator
Identify risk event
Inform Coordinator
Examine the details of risk event
Report to
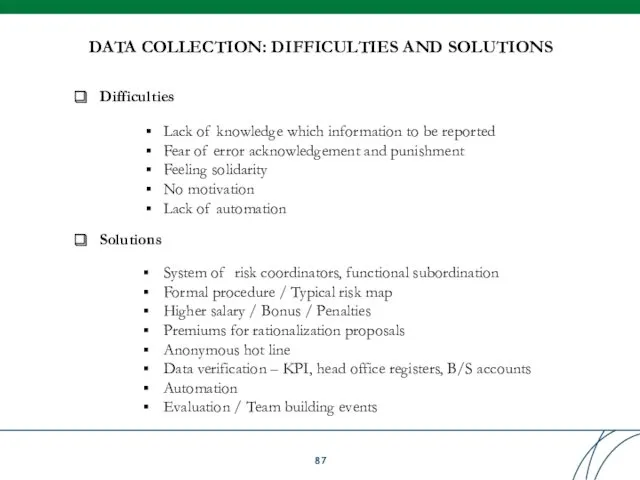
DATA COLLECTION: DIFFICULTIES AND SOLUTIONS
Difficulties
Lack of knowledge which information to be
DATA COLLECTION: DIFFICULTIES AND SOLUTIONS
Difficulties
Lack of knowledge which information to be
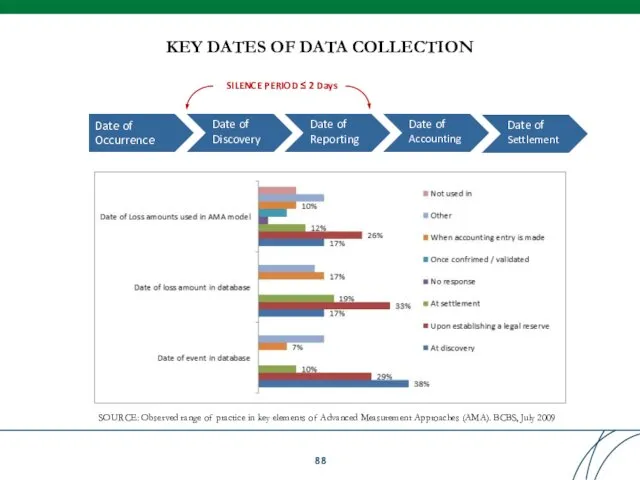
KEY DATES OF DATA COLLECTION
SOURCE: Observed range of practice in key
KEY DATES OF DATA COLLECTION
SOURCE: Observed range of practice in key
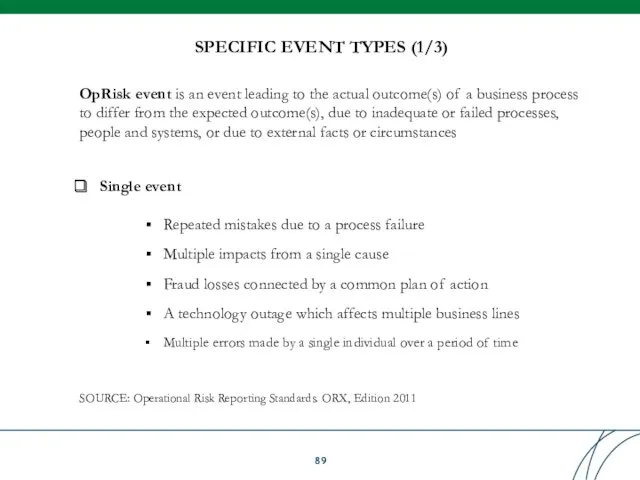
SPECIFIC EVENT TYPES (1/3)
SOURCE: Operational Risk Reporting Standards. ORX, Edition 2011
OpRisk
SPECIFIC EVENT TYPES (1/3)
SOURCE: Operational Risk Reporting Standards. ORX, Edition 2011
OpRisk
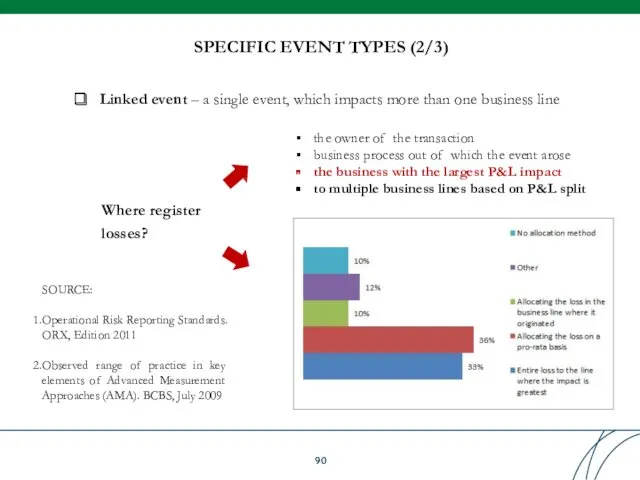
SPECIFIC EVENT TYPES (2/3)
SOURCE:
Operational Risk Reporting Standards. ORX, Edition 2011
Observed range
SPECIFIC EVENT TYPES (2/3)
SOURCE:
Operational Risk Reporting Standards. ORX, Edition 2011
Observed range
SPECIFIC EVENT TYPES (3/3)
Near-misses – operational risk events that did not
SPECIFIC EVENT TYPES (3/3)
Near-misses – operational risk events that did not
SPECIFIC LOSS TYPES (1/2)
SOURCE: Operational Risk Reporting Standards. ORX, Edition 2011
OpRisk
SPECIFIC LOSS TYPES (1/2)
SOURCE: Operational Risk Reporting Standards. ORX, Edition 2011
OpRisk
SPECIFIC LOSS TYPES (2/2)
SOURCE: Operational Risk Reporting Standards. ORX, Edition 2011
Risk
SPECIFIC LOSS TYPES (2/2)
SOURCE: Operational Risk Reporting Standards. ORX, Edition 2011
Risk
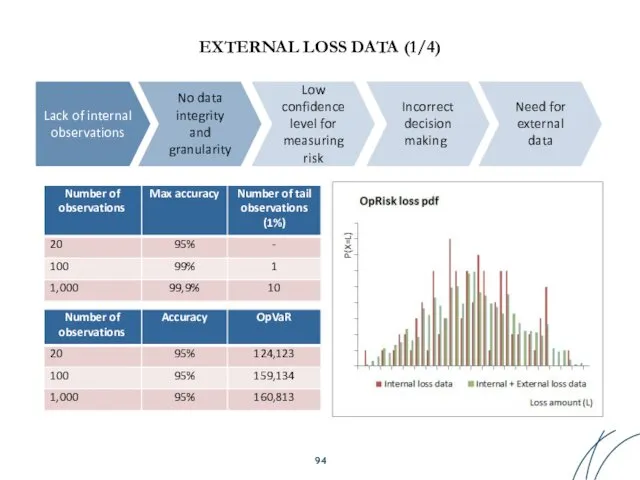
EXTERNAL LOSS DATA (1/4)
Lack of internal observations
No data integrity and granularity
Low
EXTERNAL LOSS DATA (1/4)
Lack of internal observations
No data integrity and granularity
Low
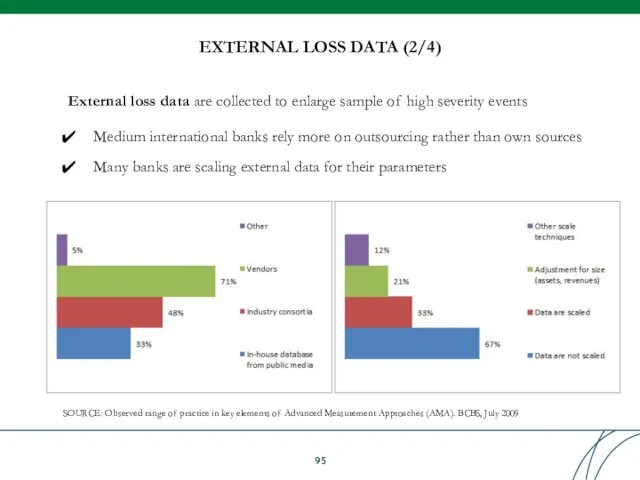
EXTERNAL LOSS DATA (2/4)
SOURCE: Observed range of practice in key elements
EXTERNAL LOSS DATA (2/4)
SOURCE: Observed range of practice in key elements
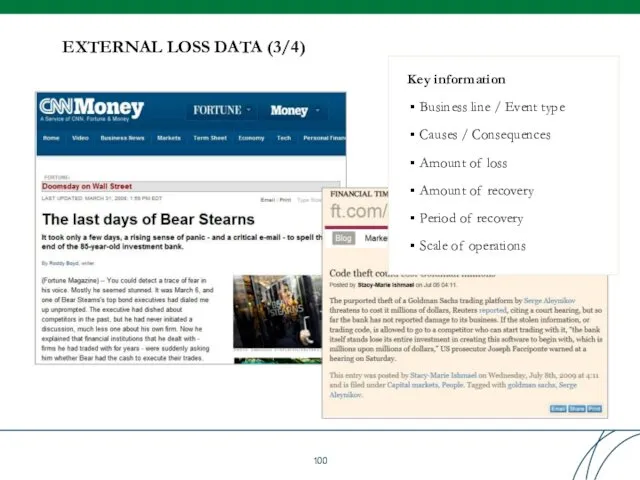
EXTERNAL LOSS DATA (3/4)
Key information
Business line / Event type
Causes / Consequences
Amount
EXTERNAL LOSS DATA (3/4)
Key information
Business line / Event type
Causes / Consequences
Amount
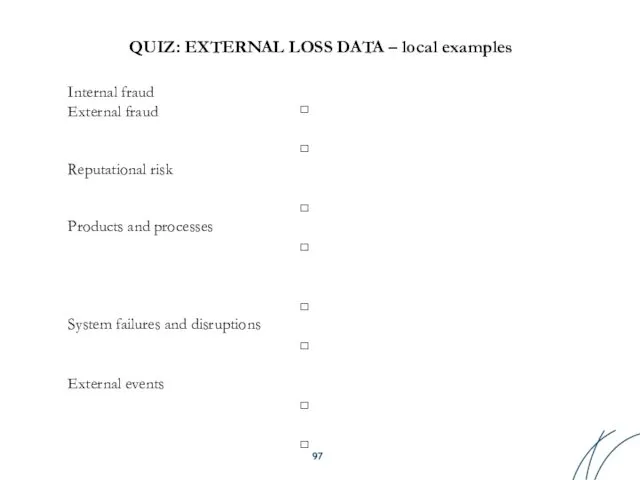
QUIZ: EXTERNAL LOSS DATA – local examples
Internal fraud
External fraud Reputational risk
QUIZ: EXTERNAL LOSS DATA – local examples
Internal fraud
External fraud Reputational risk
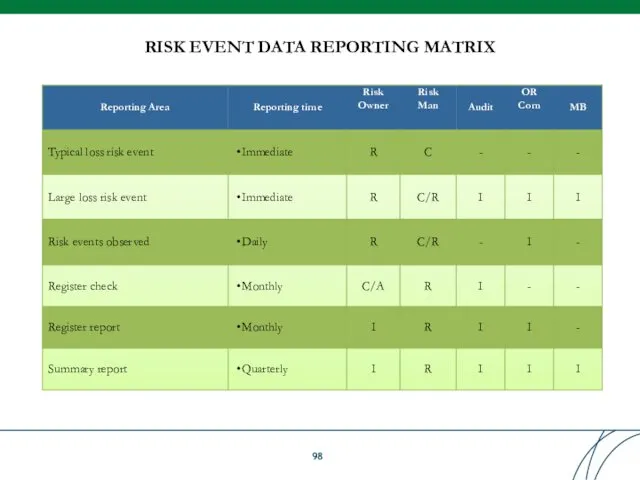
RISK EVENT DATA REPORTING MATRIX
RISK EVENT DATA REPORTING MATRIX
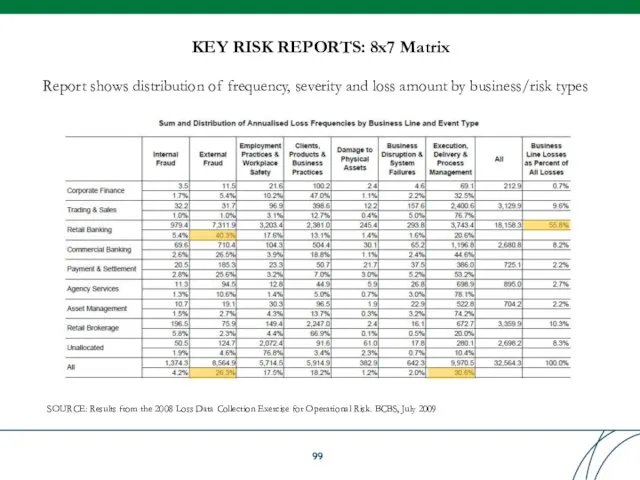
KEY RISK REPORTS: 8x7 Matrix
SOURCE: Results from the 2008 Loss Data
KEY RISK REPORTS: 8x7 Matrix
SOURCE: Results from the 2008 Loss Data
KEY RISK REPORTS: 8x7 Matrix
SOURCE: Results from the 2008 Loss Data
KEY RISK REPORTS: 8x7 Matrix
SOURCE: Results from the 2008 Loss Data
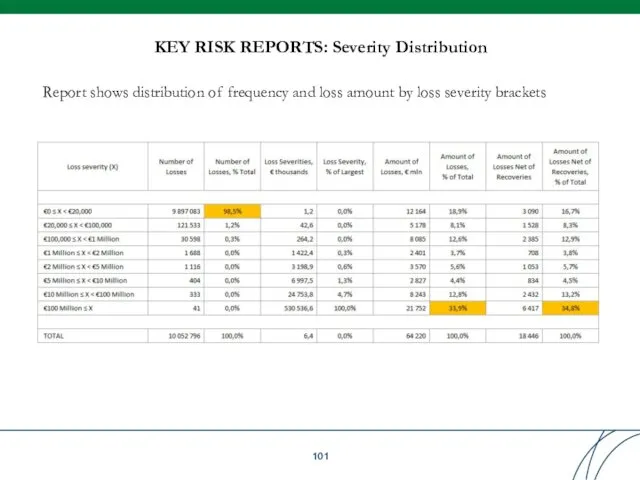
KEY RISK REPORTS: Severity Distribution
Report shows distribution of frequency and loss
KEY RISK REPORTS: Severity Distribution
Report shows distribution of frequency and loss
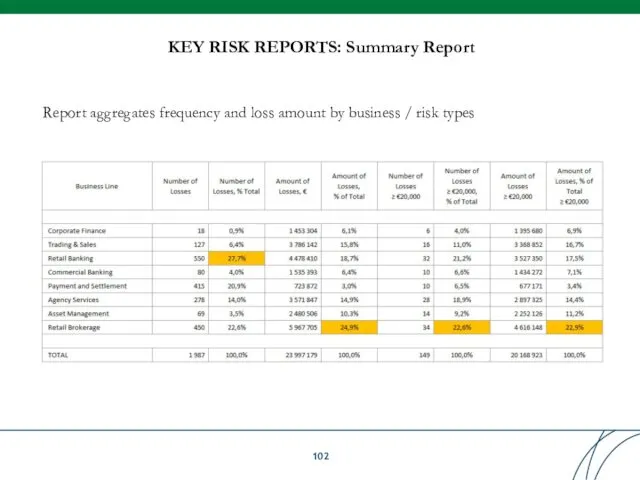
KEY RISK REPORTS: Summary Report
Report aggregates frequency and loss amount by
KEY RISK REPORTS: Summary Report
Report aggregates frequency and loss amount by
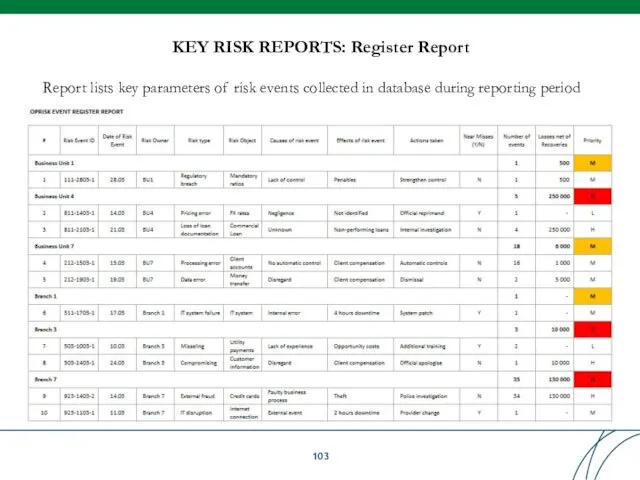
KEY RISK REPORTS: Register Report
Report lists key parameters of risk events
KEY RISK REPORTS: Register Report
Report lists key parameters of risk events
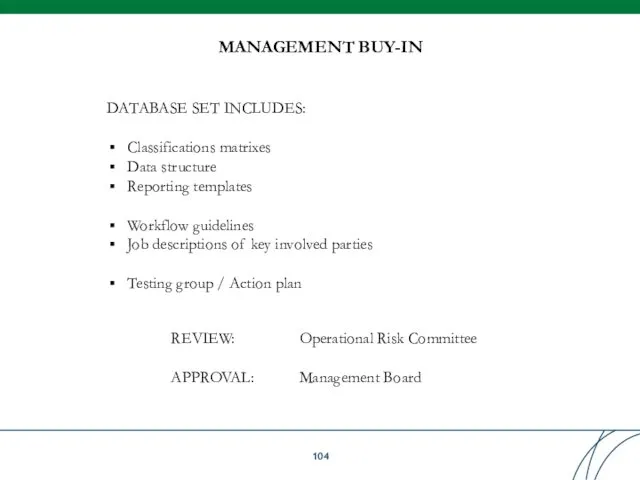
DATABASE SET INCLUDES:
Classifications matrixes
Data structure
Reporting templates
Workflow guidelines
Job descriptions of key involved
DATABASE SET INCLUDES:
Classifications matrixes
Data structure
Reporting templates
Workflow guidelines
Job descriptions of key involved
Table of Contents
Table of Contents
Basel Committee on Banking Supervision
Principles for the Sound Management of Operational
Basel Committee on Banking Supervision
Principles for the Sound Management of Operational
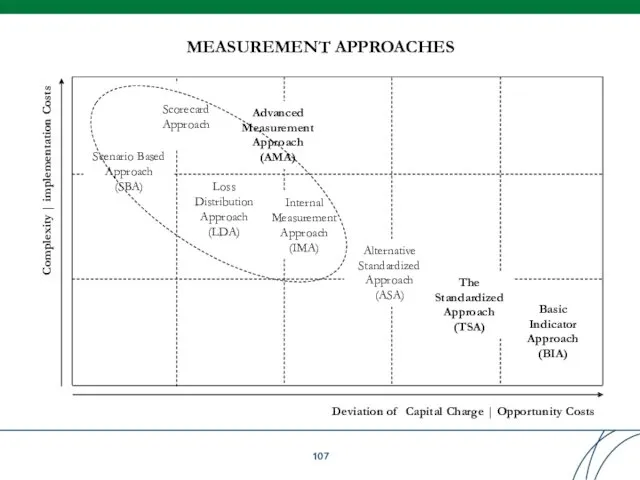
MEASUREMENT APPROACHES
Deviation of Capital Charge | Opportunity Costs
Complexity | implementation Costs
Basic
MEASUREMENT APPROACHES
Deviation of Capital Charge | Opportunity Costs
Complexity | implementation Costs
Basic
SELECTION CRITERIA
Complexity or intensity of banking operations
Meeting qualitative standards
Partial use
Restriction to
SELECTION CRITERIA
Complexity or intensity of banking operations
Meeting qualitative standards
Partial use
Restriction to
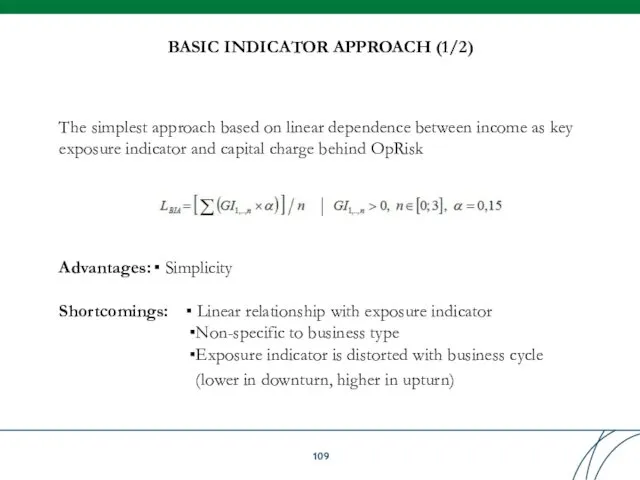
BASIC INDICATOR APPROACH (1/2)
The simplest approach based on linear dependence between
BASIC INDICATOR APPROACH (1/2)
The simplest approach based on linear dependence between
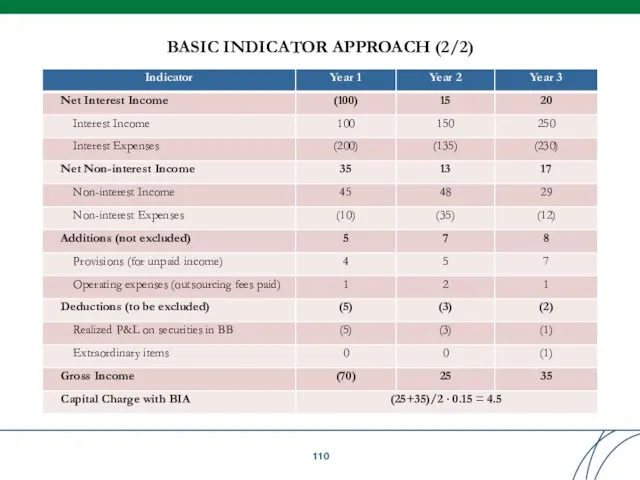
BASIC INDICATOR APPROACH (2/2)
BASIC INDICATOR APPROACH (2/2)
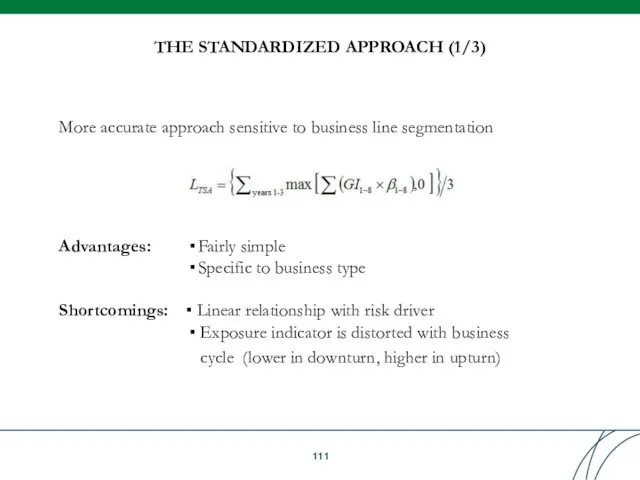
THE STANDARDIZED APPROACH (1/3)
More accurate approach sensitive to business line segmentation
Advantages:
Fairly
THE STANDARDIZED APPROACH (1/3)
More accurate approach sensitive to business line segmentation
Advantages:
Fairly
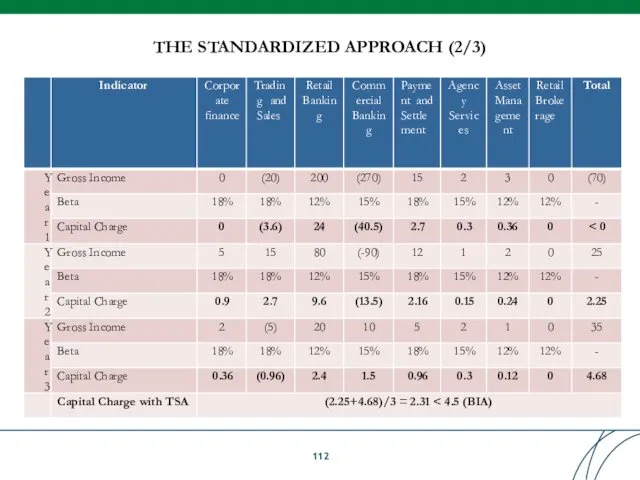
THE STANDARDIZED APPROACH (2/3)
THE STANDARDIZED APPROACH (2/3)
THE STANDARDIZED APPROACH (3/3)
Minimum qualifying criteria for TSA:
Management oversight of ORM
THE STANDARDIZED APPROACH (3/3)
Minimum qualifying criteria for TSA:
Management oversight of ORM
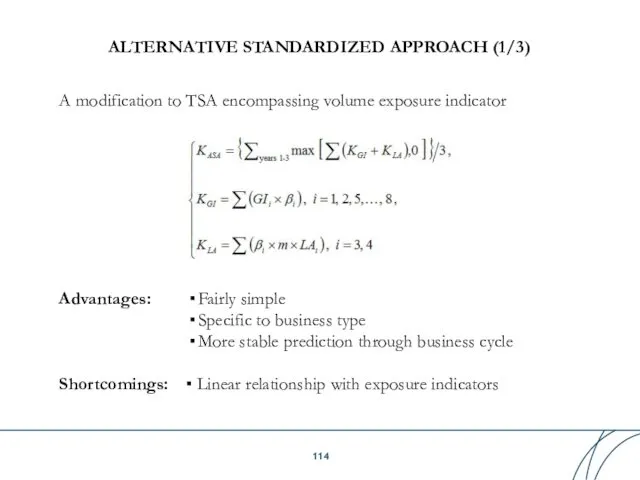
ALTERNATIVE STANDARDIZED APPROACH (1/3)
A modification to TSA encompassing volume exposure indicator
Advantages:
Fairly
ALTERNATIVE STANDARDIZED APPROACH (1/3)
A modification to TSA encompassing volume exposure indicator
Advantages:
Fairly
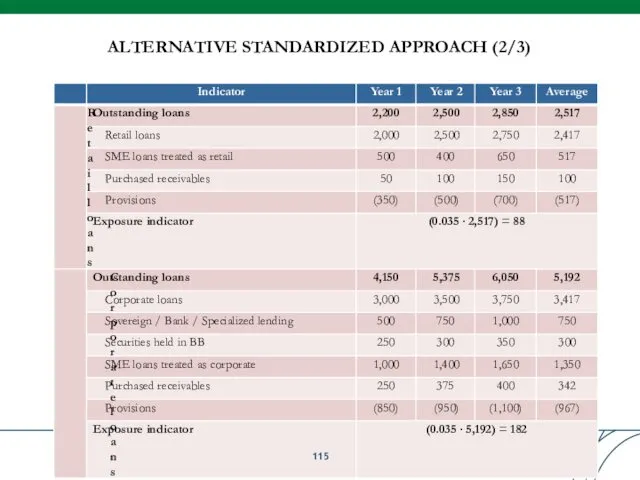
ALTERNATIVE STANDARDIZED APPROACH (2/3)
ALTERNATIVE STANDARDIZED APPROACH (2/3)
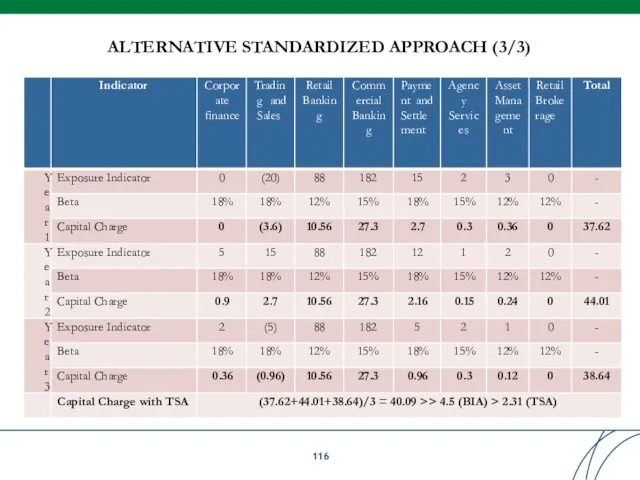
ALTERNATIVE STANDARDIZED APPROACH (3/3)
ALTERNATIVE STANDARDIZED APPROACH (3/3)
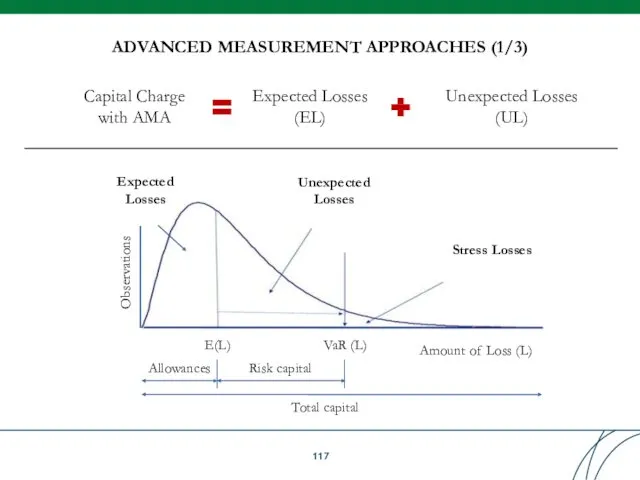
ADVANCED MEASUREMENT APPROACHES (1/3)
Capital Charge with AMA
Stress Losses
VaR (L)
E(L)
Allowances
Risk capital
Total capital
Unexpected
Losses
Expected
ADVANCED MEASUREMENT APPROACHES (1/3)
Capital Charge with AMA
Stress Losses
VaR (L)
E(L)
Allowances
Risk capital
Total capital
Unexpected
Losses
Expected
Qualifying standards:
Meeting minimum qualifying criteria used for TSA
Having independent full-fledged ORM
Qualifying standards:
Meeting minimum qualifying criteria used for TSA
Having independent full-fledged ORM
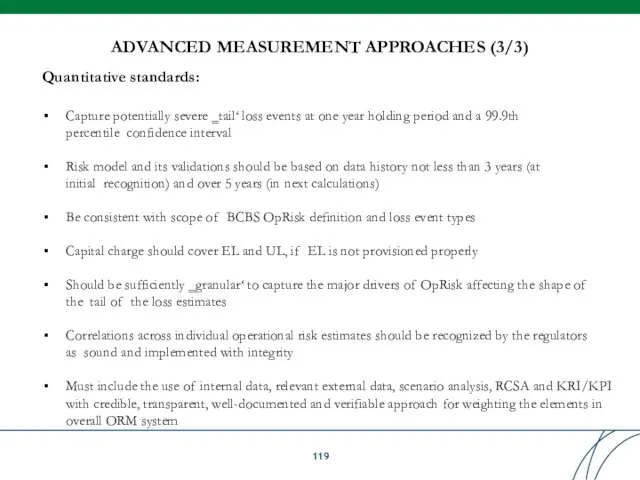
Quantitative standards:
Capture potentially severe ‗tail‘ loss events at one year holding
Quantitative standards:
Capture potentially severe ‗tail‘ loss events at one year holding
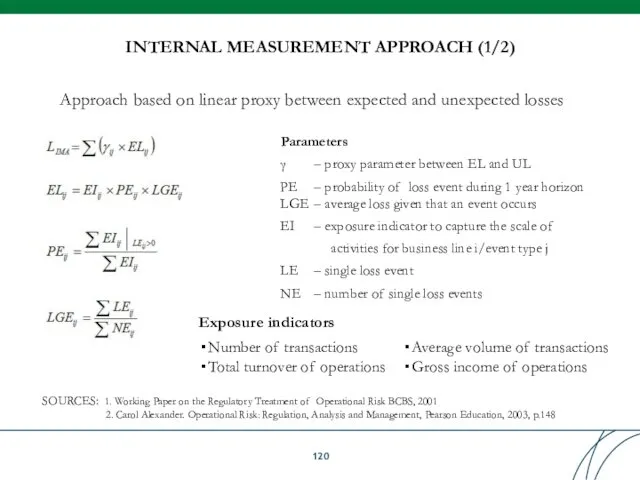
INTERNAL MEASUREMENT APPROACH (1/2)
Approach based on linear proxy between expected and
INTERNAL MEASUREMENT APPROACH (1/2)
Approach based on linear proxy between expected and
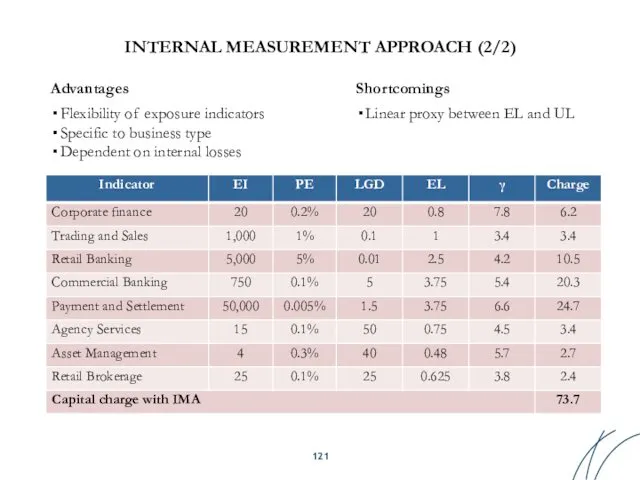
INTERNAL MEASUREMENT APPROACH (2/2)
Advantages
Flexibility of exposure indicators
Specific to business type
Dependent on
INTERNAL MEASUREMENT APPROACH (2/2)
Advantages
Flexibility of exposure indicators
Specific to business type
Dependent on
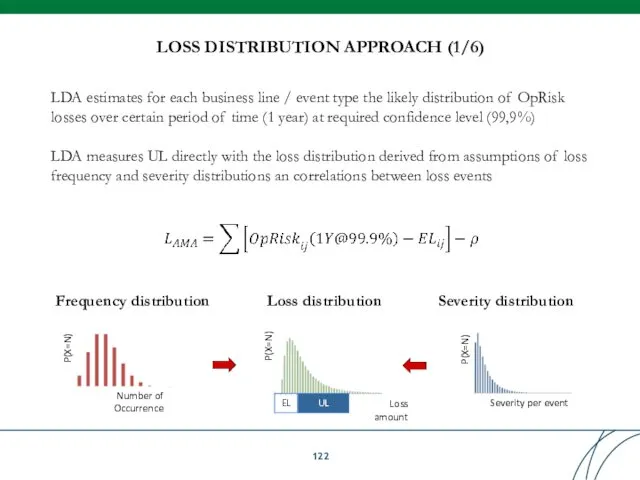
LOSS DISTRIBUTION APPROACH (1/6)
LDA estimates for each business line / event
LOSS DISTRIBUTION APPROACH (1/6)
LDA estimates for each business line / event
LOSS DISTRIBUTION APPROACH (2/6)
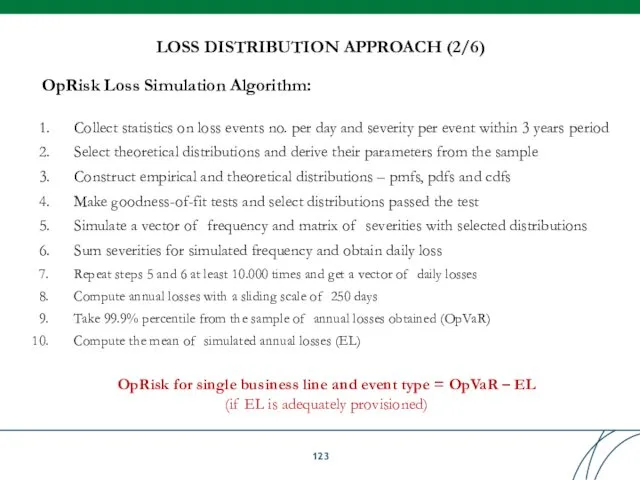
OpRisk Loss Simulation Algorithm:
Collect statistics on loss events
LOSS DISTRIBUTION APPROACH (2/6)
OpRisk Loss Simulation Algorithm:
Collect statistics on loss events
LOSS DISTRIBUTION APPROACH (3/6)
Severity distributions
Lognormal
Pareto
Weibull
Validation tests
Q-Q plot
K-S test
SOURCE: Observed range of
LOSS DISTRIBUTION APPROACH (3/6)
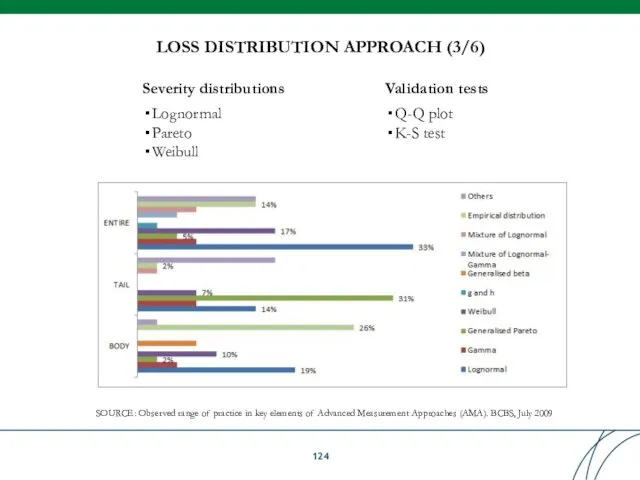
Severity distributions
Lognormal
Pareto
Weibull
Validation tests
Q-Q plot
K-S test
SOURCE: Observed range of
LOSS DISTRIBUTION APPROACH (4/6)
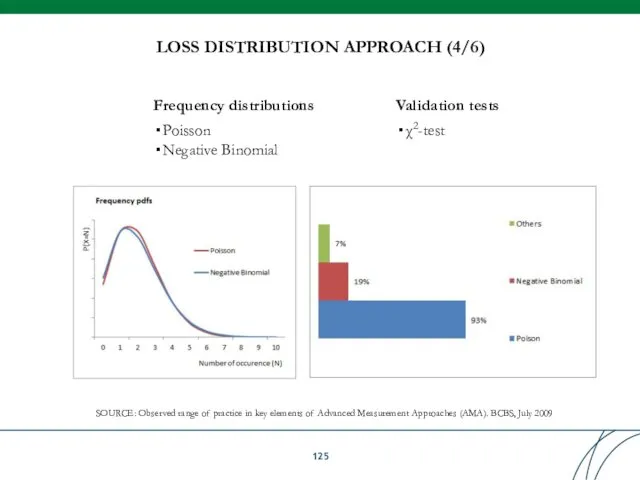
Frequency distributions
Poisson
Negative Binomial
Validation tests
χ2-test
SOURCE: Observed range of practice
LOSS DISTRIBUTION APPROACH (4/6)
Frequency distributions
Poisson
Negative Binomial
Validation tests
χ2-test
SOURCE: Observed range of practice
LOSS DISTRIBUTION APPROACH (5/6)
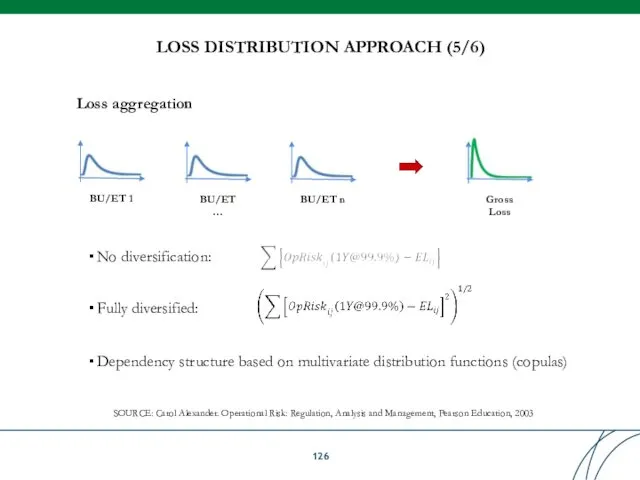
Loss aggregation
BU/ET 1
BU/ET n
BU/ET
…
Gross Loss
SOURCE: Carol Alexander. Operational
LOSS DISTRIBUTION APPROACH (5/6)
Loss aggregation
BU/ET 1
BU/ET n
BU/ET
…
Gross Loss
SOURCE: Carol Alexander. Operational
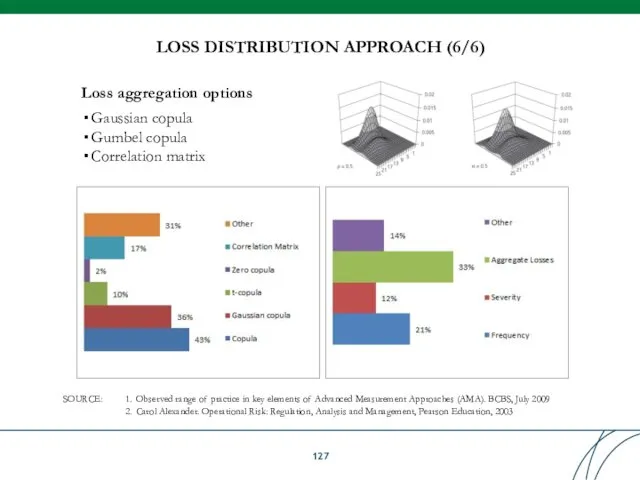
LOSS DISTRIBUTION APPROACH (6/6)
SOURCE:
Observed range of practice in key elements of
LOSS DISTRIBUTION APPROACH (6/6)
SOURCE:
Observed range of practice in key elements of
Table of Contents
Table of Contents
Basel Committee on Banking Supervision
> Principles for the Sound Management of
Basel Committee on Banking Supervision
> Principles for the Sound Management of
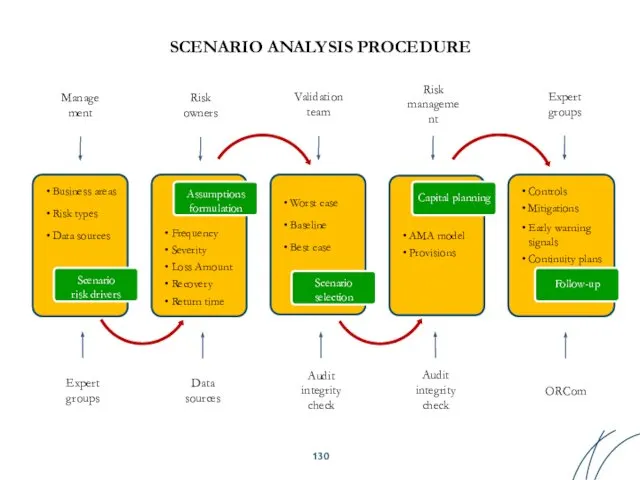
Business areas
Risk types
Data sources
Scenario risk drivers
Frequency
Severity
Loss Amount
Recovery
Return time
Assumptions formulation
Worst case
Baseline
Best case
Scenario
Business areas
Risk types
Data sources
Scenario risk drivers
Frequency
Severity
Loss Amount
Recovery
Return time
Assumptions formulation
Worst case
Baseline
Best case
Scenario
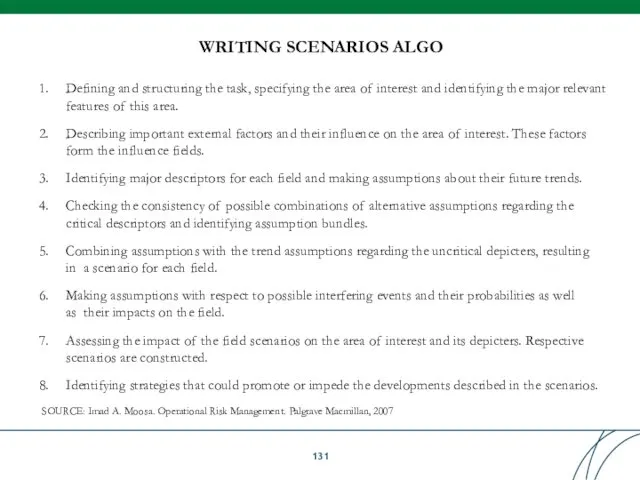
WRITING SCENARIOS ALGO
Defining and structuring the task, specifying the area of
WRITING SCENARIOS ALGO
Defining and structuring the task, specifying the area of
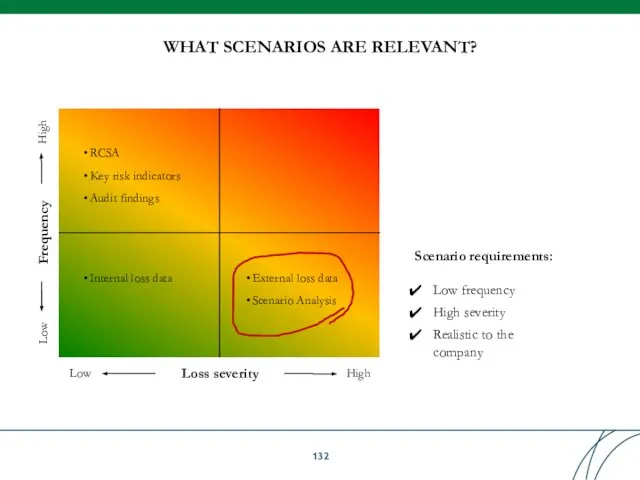
WHAT SCENARIOS ARE RELEVANT?
Frequency
Loss severity
High
Low
High
Low
RCSA
Key risk indicators
Audit findings
Internal loss data
External loss
WHAT SCENARIOS ARE RELEVANT?
Frequency
Loss severity
High
Low
High
Low
RCSA
Key risk indicators
Audit findings
Internal loss data
External loss
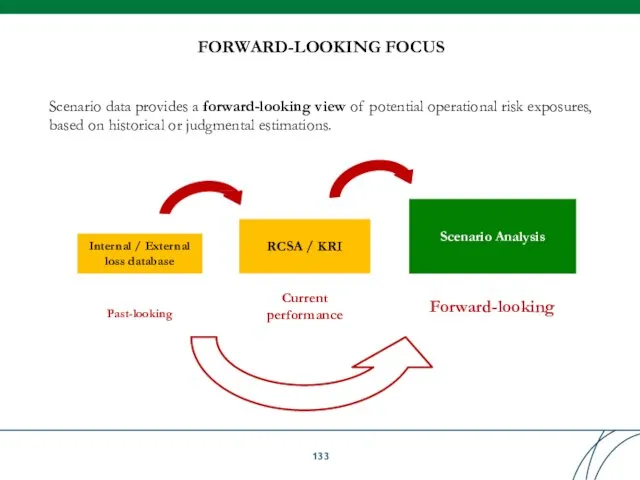
FORWARD-LOOKING FOCUS
Internal / External loss database
Past-looking
RCSA / KRI
Current performance
Scenario Analysis
Forward-looking
Scenario data
FORWARD-LOOKING FOCUS
Internal / External loss database
Past-looking
RCSA / KRI
Current performance
Scenario Analysis
Forward-looking
Scenario data
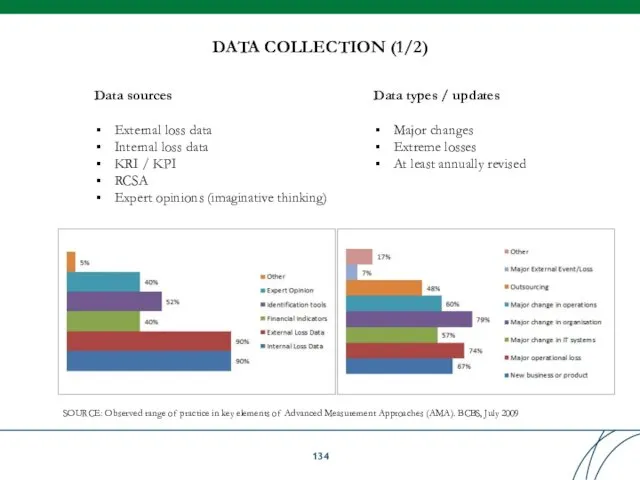
SOURCE: Observed range of practice in key elements of Advanced Measurement
SOURCE: Observed range of practice in key elements of Advanced Measurement
SOURCE: Observed range of practice in key elements of Advanced Measurement
SOURCE: Observed range of practice in key elements of Advanced Measurement
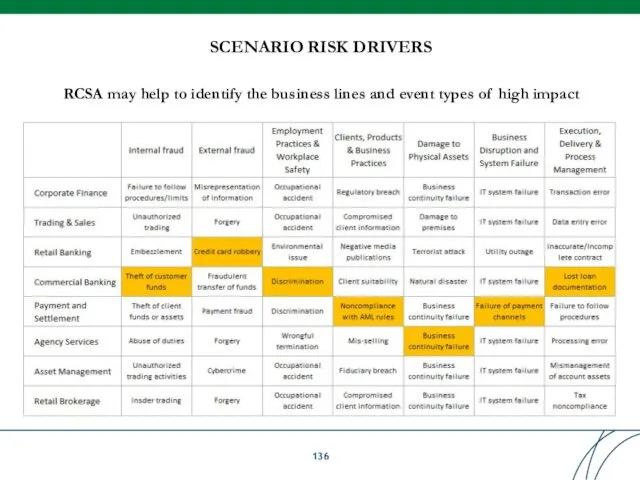
SCENARIO RISK DRIVERS
RCSA may help to identify the business lines and
SCENARIO RISK DRIVERS
RCSA may help to identify the business lines and
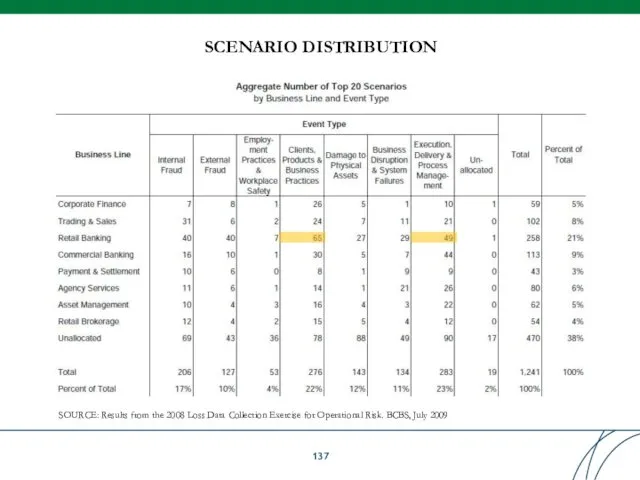
SCENARIO DISTRIBUTION
SOURCE: Results from the 2008 Loss Data Collection Exercise for
SCENARIO DISTRIBUTION
SOURCE: Results from the 2008 Loss Data Collection Exercise for
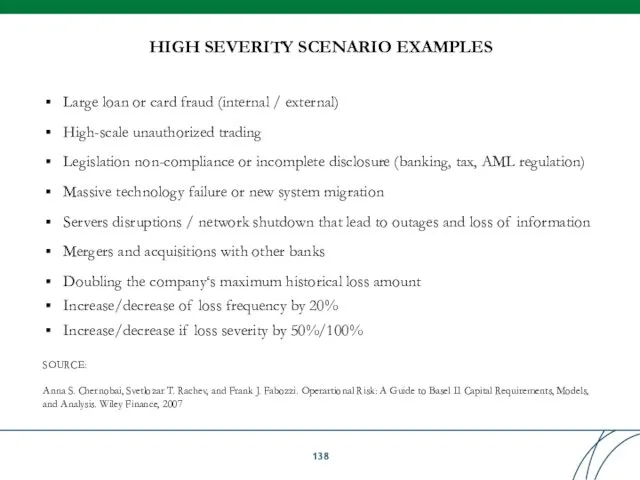
HIGH SEVERITY SCENARIO EXAMPLES
Large loan or card fraud (internal / external)
High-scale
HIGH SEVERITY SCENARIO EXAMPLES
Large loan or card fraud (internal / external)
High-scale
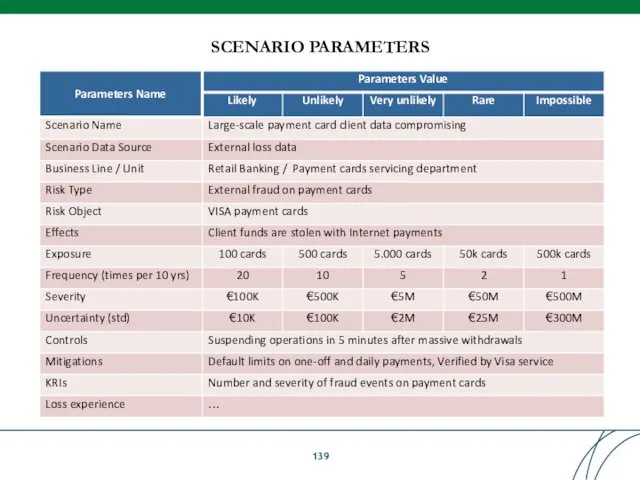
SCENARIO PARAMETERS
SCENARIO PARAMETERS
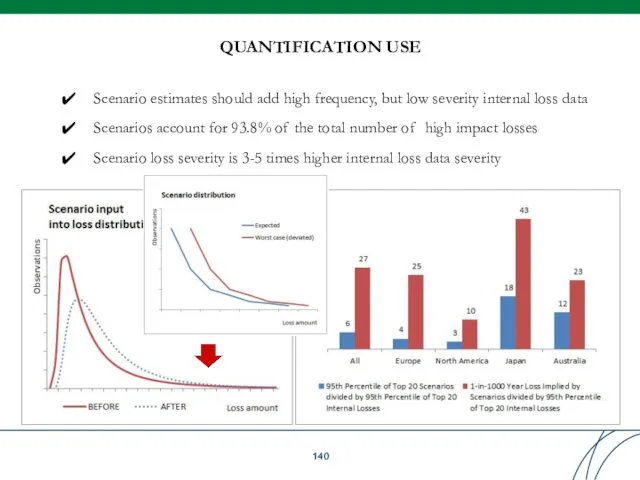
QUANTIFICATION USE
Scenario estimates should add high frequency, but low severity internal
QUANTIFICATION USE
Scenario estimates should add high frequency, but low severity internal
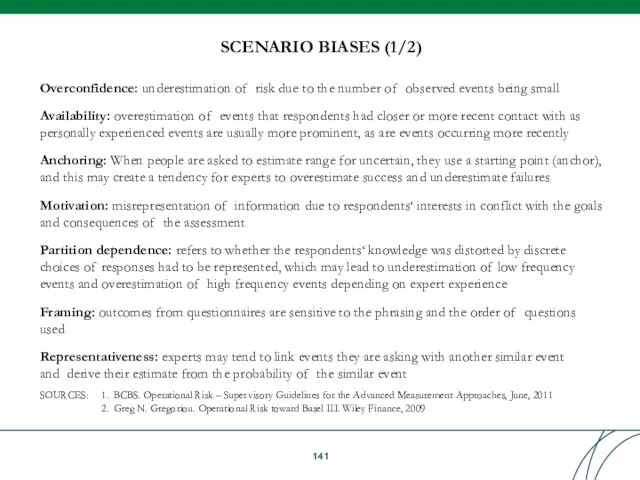
Overconfidence: underestimation of risk due to the number of observed events
Overconfidence: underestimation of risk due to the number of observed events
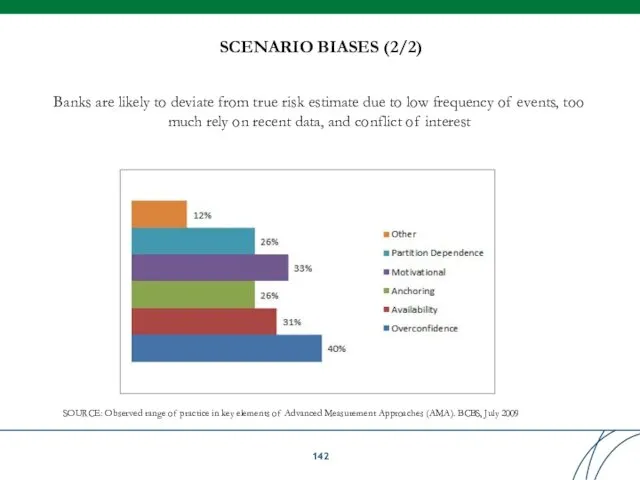
Banks are likely to deviate from true risk estimate due to
Banks are likely to deviate from true risk estimate due to
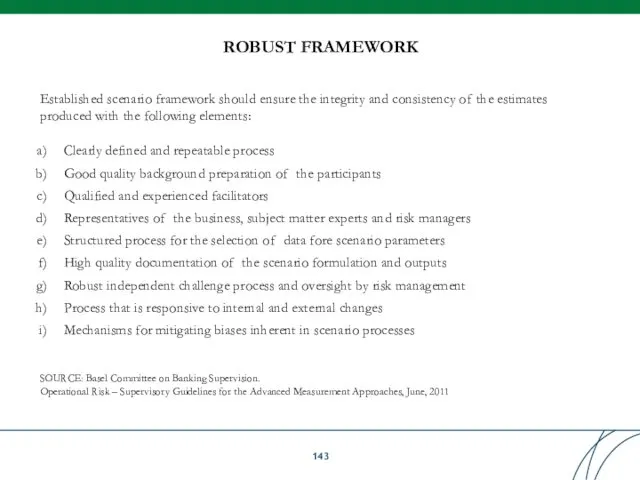
Established scenario framework should ensure the integrity and consistency of the
Established scenario framework should ensure the integrity and consistency of the
Table of Contents
Table of Contents
Table of Contents
Table of Contents
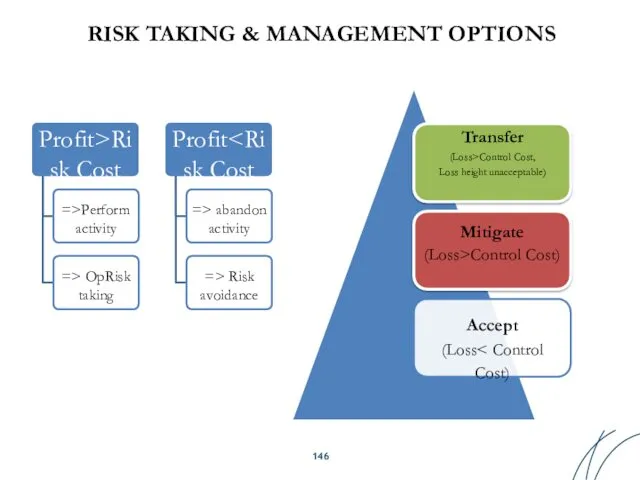
RISK TAKING & MANAGEMENT OPTIONS
Profit>Ri sk Cost
=>Perform activity
=> OpRisk taking
Profit
RISK TAKING & MANAGEMENT OPTIONS
Profit>Ri sk Cost
=>Perform activity
=> OpRisk taking
Profit
Processes
People
Systems
External events
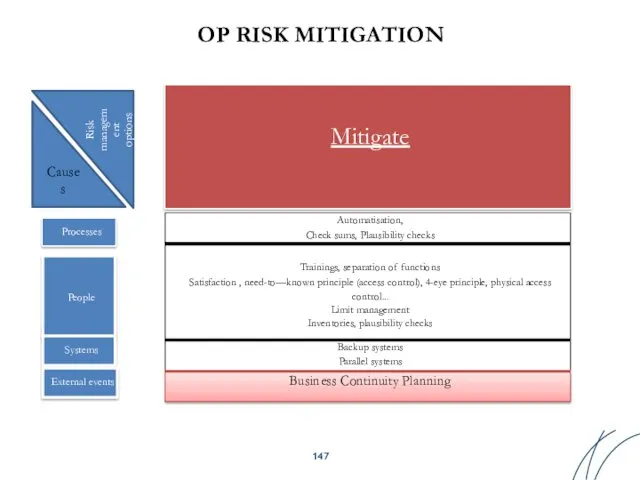
OP RISK MITIGATION
Mitigate
Cause s
Risk
managem ent options
Processes
People
Systems
External events
OP RISK MITIGATION
Mitigate
Cause s
Risk
managem ent options
BSBC PRINCIPLE 10: BUSINESS RESILIENCY
AND CONTINUITY PLANNING
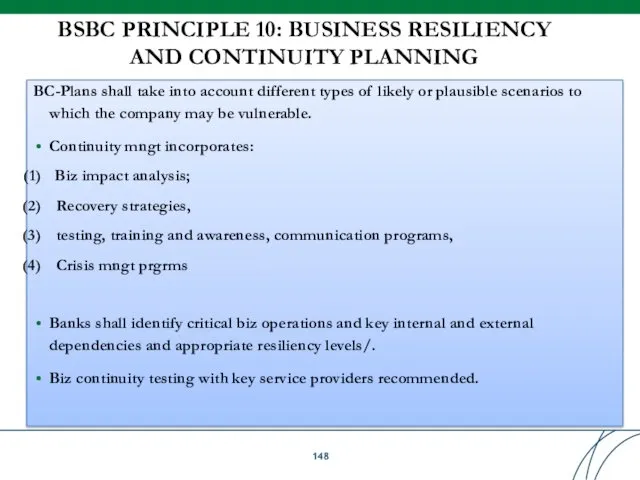
BC-Plans shall take into account
BSBC PRINCIPLE 10: BUSINESS RESILIENCY
AND CONTINUITY PLANNING
BC-Plans shall take into account
BUSINESS CONTINUITY PLANNING
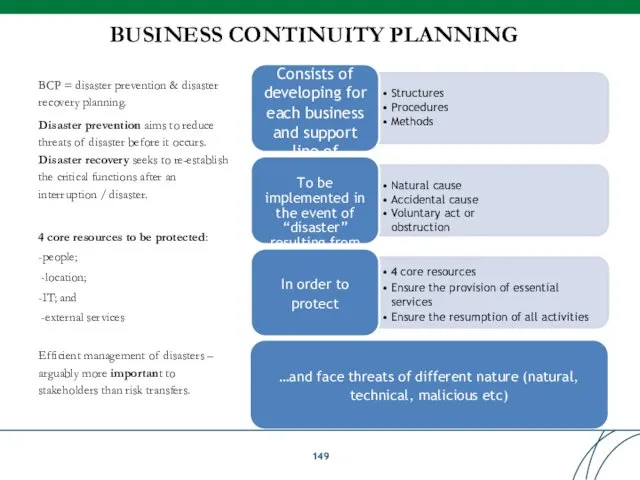
BCP = disaster prevention & disaster recovery planning.
Disaster prevention
BUSINESS CONTINUITY PLANNING
BCP = disaster prevention & disaster recovery planning.
Disaster prevention
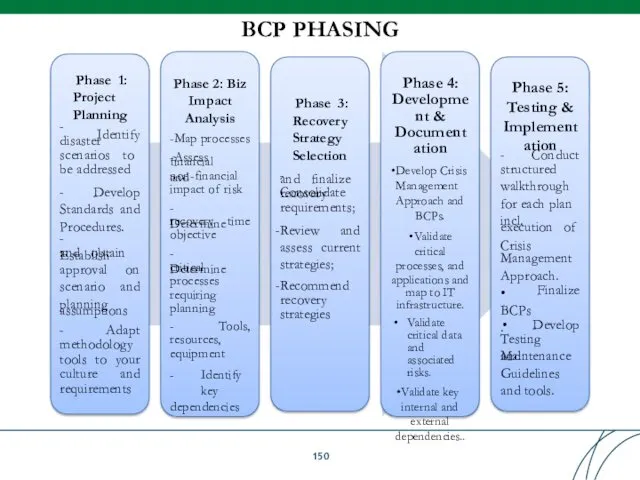
BCP PHASING
-
Phase 1: Project Planning
Identify
disaster
scenarios to
be addressed
- Develop Standards and Procedures.
- Establish
and obtain
approval on
BCP PHASING
-
Phase 1: Project Planning
Identify
disaster
scenarios to
be addressed
- Develop Standards and Procedures.
- Establish
and obtain
approval on
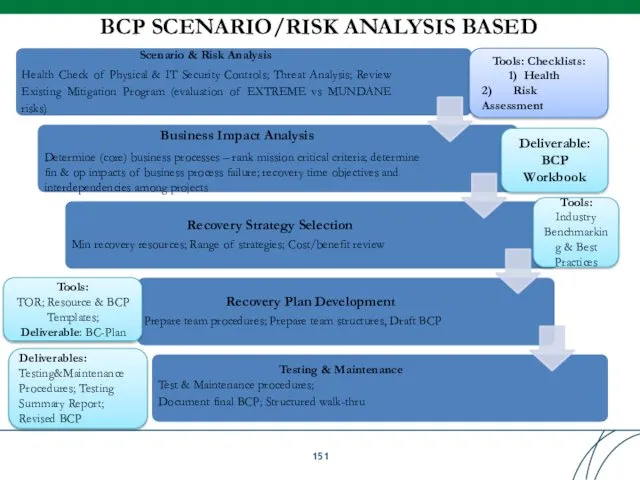
BCP SCENARIO/RISK ANALYSIS BASED
Scenario & Risk Analysis
Health Check of Physical &
BCP SCENARIO/RISK ANALYSIS BASED
Scenario & Risk Analysis
Health Check of Physical &
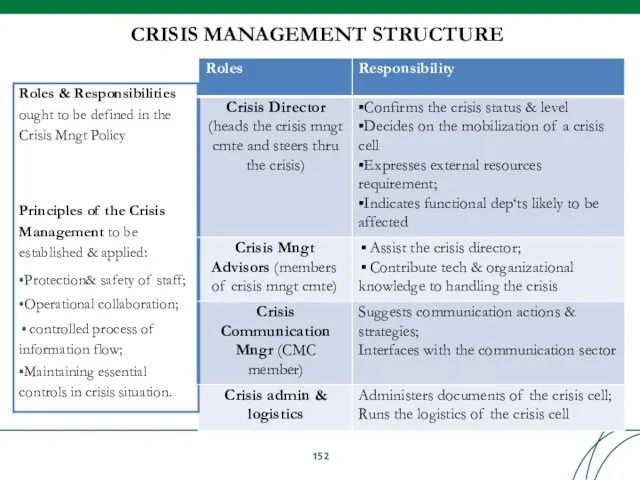
CRISIS MANAGEMENT STRUCTURE
CRISIS MANAGEMENT STRUCTURE
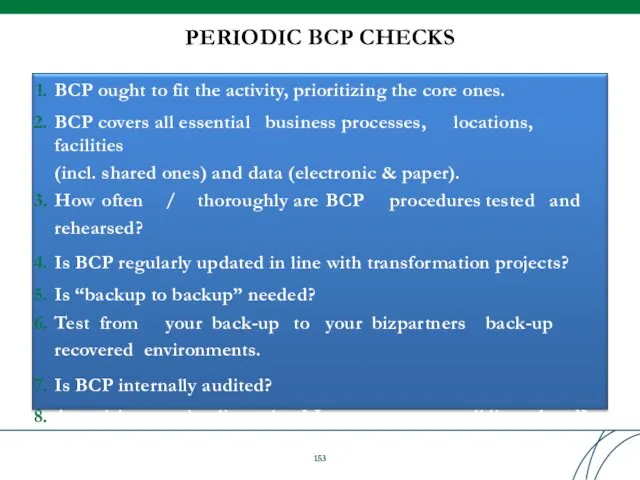
PERIODIC BCP CHECKS
BCP ought to fit the activity, prioritizing the core
PERIODIC BCP CHECKS
BCP ought to fit the activity, prioritizing the core
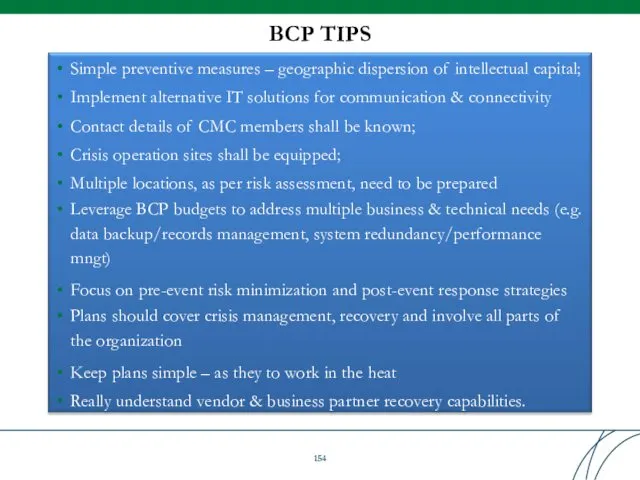
BCP TIPS
Simple preventive measures – geographic dispersion of intellectual capital;
Implement alternative
BCP TIPS
Simple preventive measures – geographic dispersion of intellectual capital;
Implement alternative
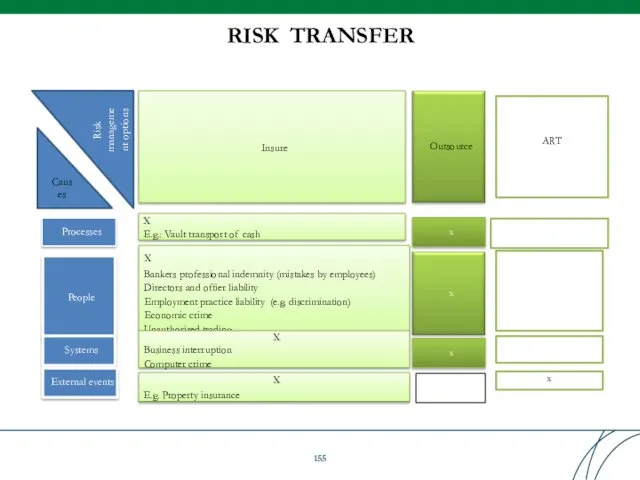
Processes
People
Systems
External events
Insure
X
E.g.: Vault transport of cash
X
Bankers professional indemnity (mistakes by employees)
Processes
People
Systems
External events
Insure
X
E.g.: Vault transport of cash
X
Bankers professional indemnity (mistakes by employees)
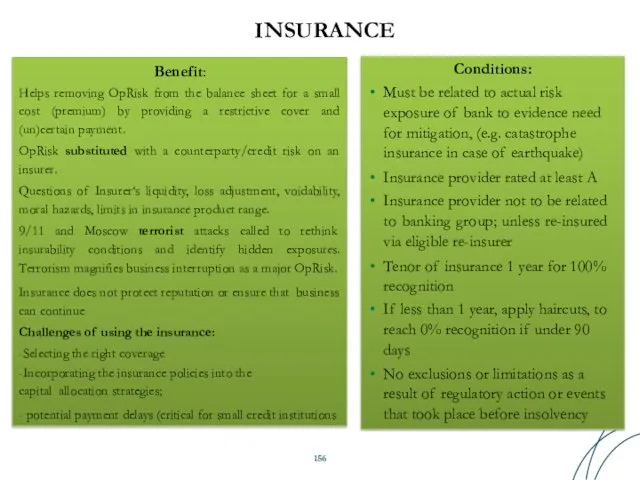
INSURANCE
Conditions:
Must be related to actual risk exposure of bank to evidence
INSURANCE
Conditions:
Must be related to actual risk exposure of bank to evidence
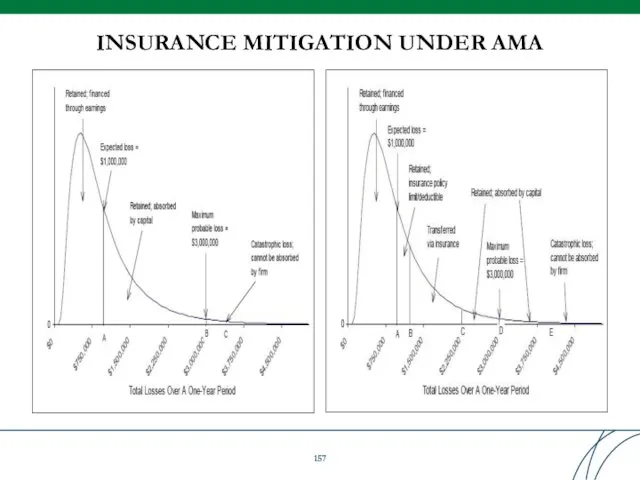
INSURANCE MITIGATION UNDER AMA
INSURANCE MITIGATION UNDER AMA
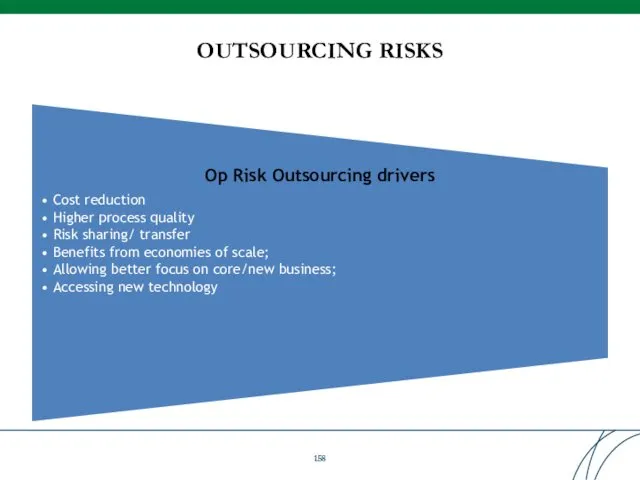
OUTSOURCING RISKS
Op Risk Outsourcing drivers
Cost reduction
Higher process quality
Risk sharing/ transfer
Benefits from
OUTSOURCING RISKS
Op Risk Outsourcing drivers
Cost reduction
Higher process quality
Risk sharing/ transfer
Benefits from
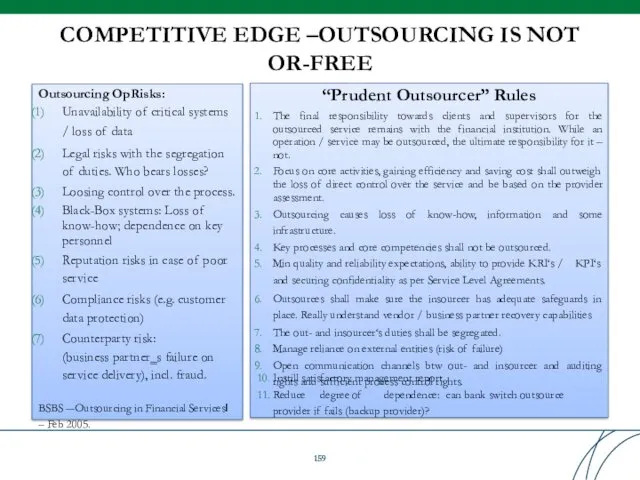
COMPETITIVE EDGE –OUTSOURCING IS NOT
OR-FREE
“Prudent Outsourcer” Rules
The final responsibility towards clients
COMPETITIVE EDGE –OUTSOURCING IS NOT
OR-FREE
“Prudent Outsourcer” Rules
The final responsibility towards clients
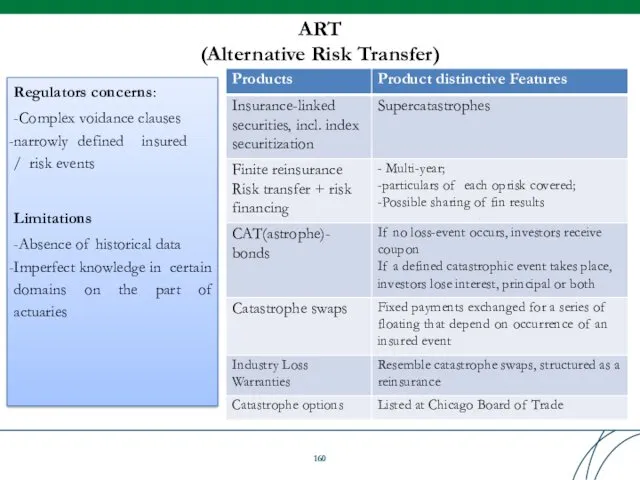
ART
(Alternative Risk Transfer)
Regulators concerns:
-Complex voidance clauses
narrowly defined insured / risk events
Limitations
-Absence of historical data
Imperfect
ART
(Alternative Risk Transfer)
Regulators concerns:
-Complex voidance clauses
narrowly defined insured / risk events
Limitations
-Absence of historical data
Imperfect
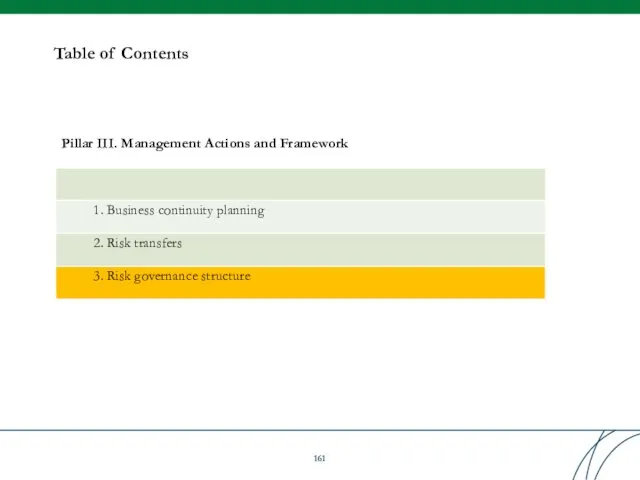
Table of Contents
Table of Contents
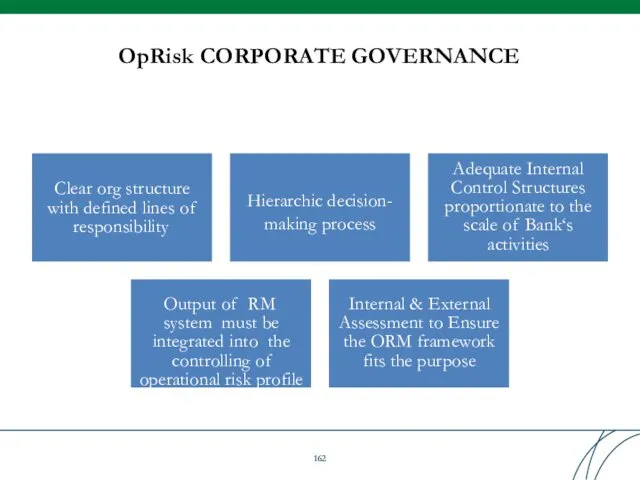
OpRisk CORPORATE GOVERNANCE
Clear org structure with defined lines of responsibility
Hierarchic decision-
OpRisk CORPORATE GOVERNANCE
Clear org structure with defined lines of responsibility
Hierarchic decision-
RISK GOVERNANCE: 3 (4) LINES OF DEFENSE
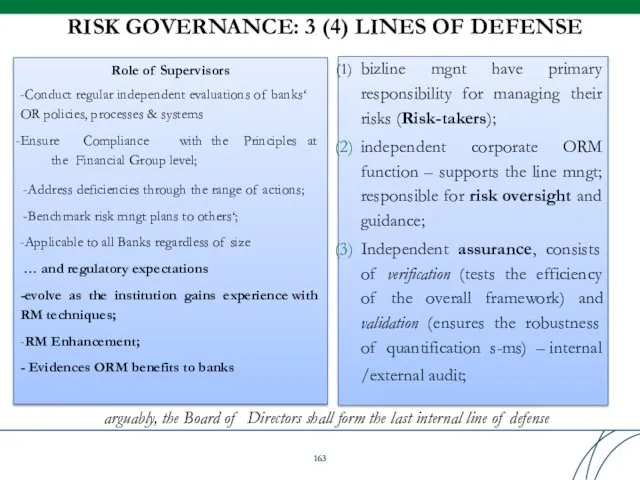
Role of Supervisors
-Conduct regular independent
RISK GOVERNANCE: 3 (4) LINES OF DEFENSE
Role of Supervisors
-Conduct regular independent
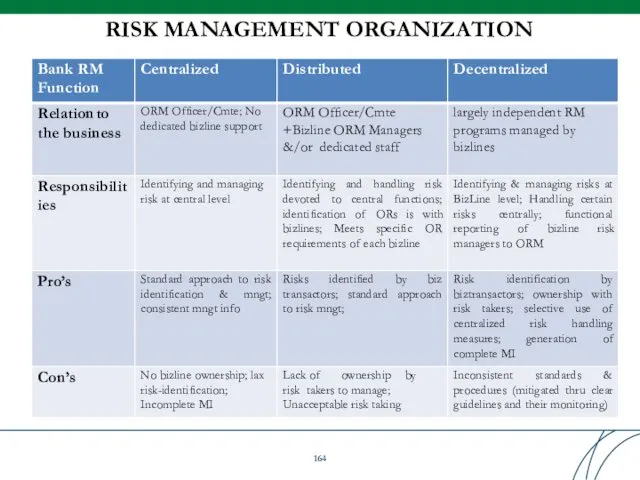
RISK MANAGEMENT ORGANIZATION
RISK MANAGEMENT ORGANIZATION
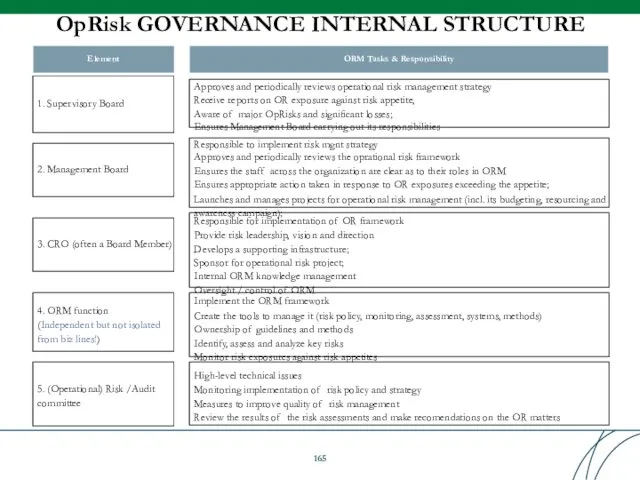
OpRisk GOVERNANCE INTERNAL STRUCTURE
1. Supervisory Board
Responsible to implement risk mgnt strategy
Approves
OpRisk GOVERNANCE INTERNAL STRUCTURE
1. Supervisory Board
Responsible to implement risk mgnt strategy
Approves
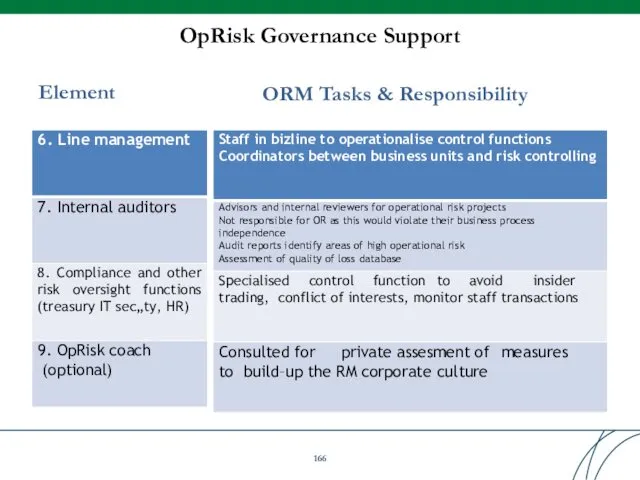
OpRisk Governance Support
Element
ORM Tasks & Responsibility
OpRisk Governance Support
Element
ORM Tasks & Responsibility
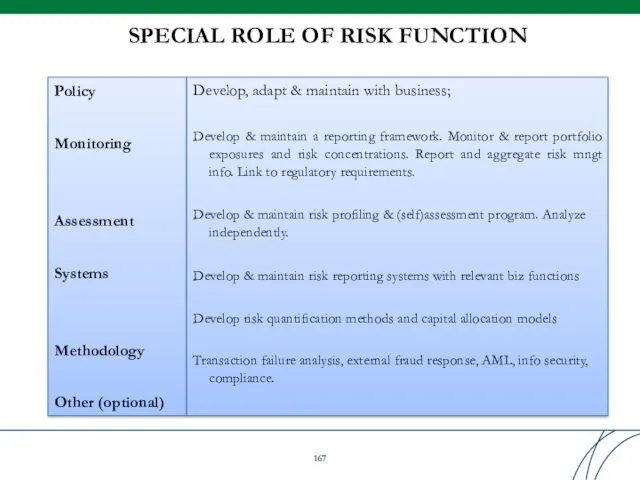
SPECIAL ROLE OF RISK FUNCTION
Policy
Monitoring
Assessment
Systems
Methodology
Other (optional)
Develop, adapt & maintain with business;
Develop
SPECIAL ROLE OF RISK FUNCTION
Policy
Monitoring
Assessment
Systems
Methodology
Other (optional)
Develop, adapt & maintain with business;
Develop
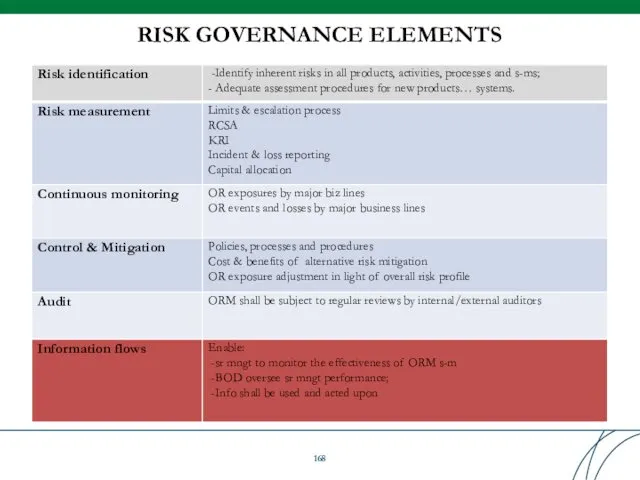
RISK GOVERNANCE ELEMENTS
RISK GOVERNANCE ELEMENTS
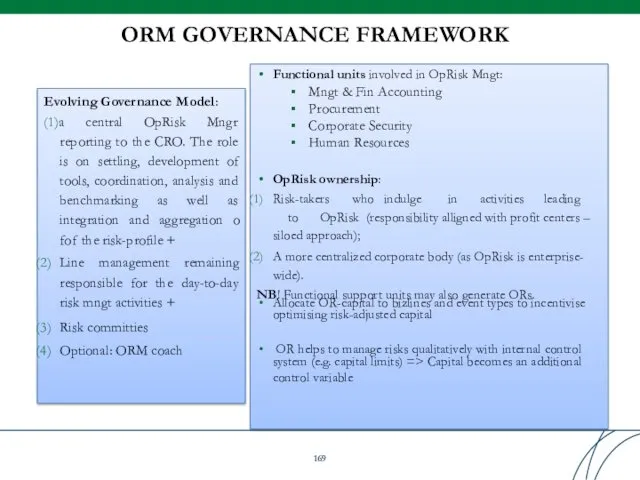
ORM GOVERNANCE FRAMEWORK
Evolving Governance Model:
(1)a central OpRisk Mngr reporting to the
ORM GOVERNANCE FRAMEWORK
Evolving Governance Model:
(1)a central OpRisk Mngr reporting to the
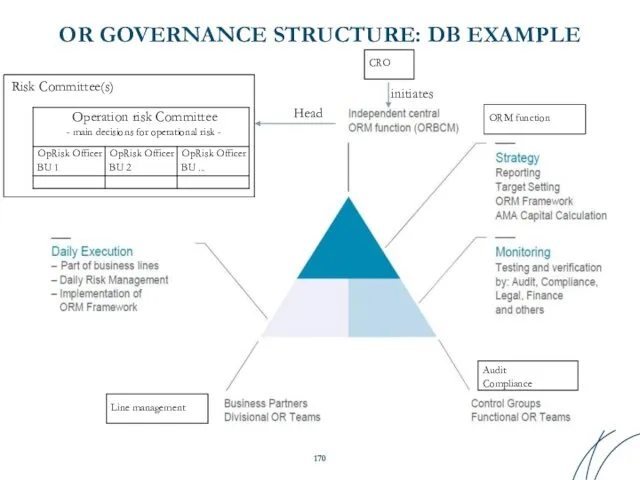
OR GOVERNANCE STRUCTURE: DB EXAMPLE
Head
Risk Committee(s)
initiates
Line management
ORM function
Audit Compliance
CRO
OR GOVERNANCE STRUCTURE: DB EXAMPLE
Head
Risk Committee(s)
initiates
Line management
ORM function
Audit Compliance
CRO
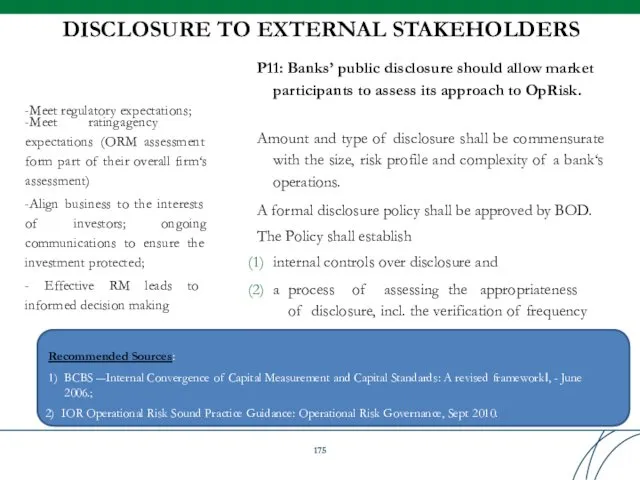
DISCLOSURE TO EXTERNAL STAKEHOLDERS
-Meet rating agency expectations (ORM assessment form part of their
DISCLOSURE TO EXTERNAL STAKEHOLDERS
-Meet rating agency expectations (ORM assessment form part of their
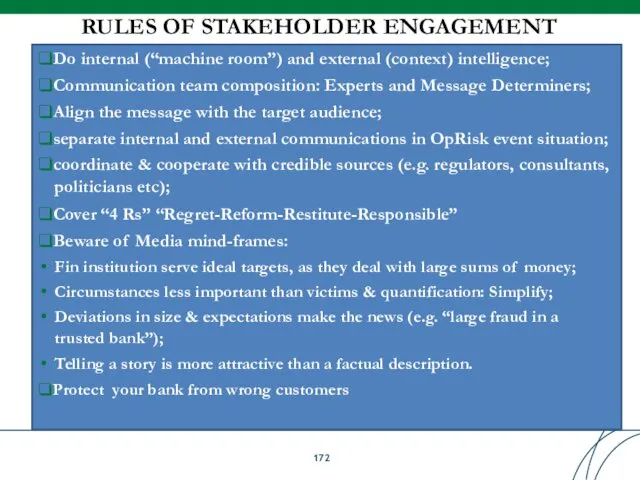
RULES OF STAKEHOLDER ENGAGEMENT
❑Do internal (“machine room”) and external (context) intelligence;
❑Communication
RULES OF STAKEHOLDER ENGAGEMENT
❑Do internal (“machine room”) and external (context) intelligence;
❑Communication
- Who are your stakeholders?
-What’s your Symbol (Brand, Reputation)?
- Is it
- Who are your stakeholders?
-What’s your Symbol (Brand, Reputation)?
- Is it
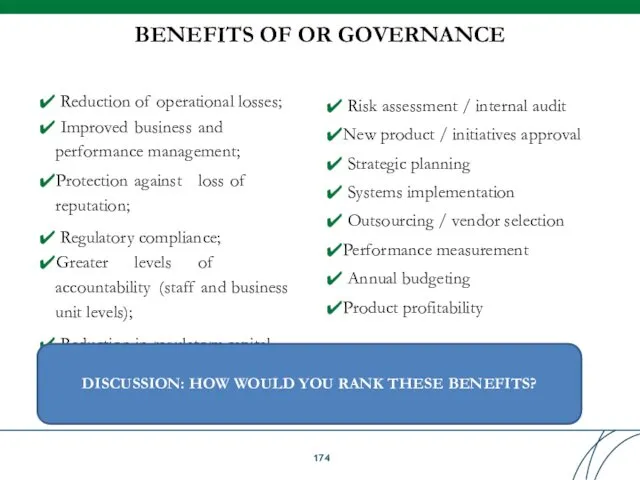
BENEFITS OF OR GOVERNANCE
✔ Reduction of operational losses;
✔ Improved business and performance management;
✔Protection against loss of
BENEFITS OF OR GOVERNANCE
✔ Reduction of operational losses;
✔ Improved business and performance management;
✔Protection against loss of
ORM IS SIMPLY GOOD CORPORATE
GOVERNANCE
Good ORM
Fewer Surprises
Increased
shareholder value
ORM IS SIMPLY GOOD CORPORATE
GOVERNANCE
Good ORM
Fewer Surprises
Increased
shareholder value
Table of Contents
Table of Contents
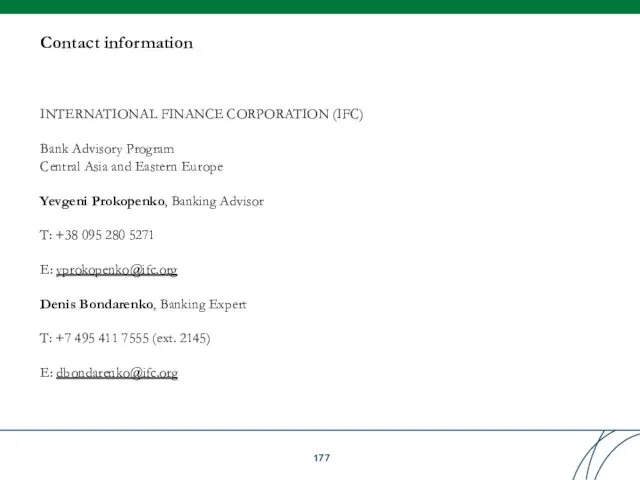
Contact information
INTERNATIONAL FINANCE CORPORATION (IFC)
Bank Advisory Program
Central Asia and Eastern Europe
Yevgeni
Contact information
INTERNATIONAL FINANCE CORPORATION (IFC)
Bank Advisory Program
Central Asia and Eastern Europe
Yevgeni
 Стратегический менеджмент в образовании: формирование стратегического плана школы
 Трудовые ресурсы предприятия. (Тема 8)
 Менеджмент качества образования в высшей школе
 Методы и формы управления в гостиничном бизнесе
 Мировые управленческие концепции. Американская, европейская, японская и российская модели менеджмента
 How managers can make a decision in an uncertainty environment?
 Time management. How to do everything
 Система внутреннего контроля современного предприятия
 Оценка использования трудовых ресурсов и обоснование путей их улучшения ОАО Витебские ковры
 Основы управления качеством и оценки соответствия
 Организационный план. Персонал
 Анализ кадровой политики ОАО РУСАЛ-ИркАЗ
 Совершенствование процесса адаптации персонала на предприятии на примере строительной организации ООО Застройщик
 Обще́ственное пита́ние
 Теория поведения человека в организации
 Практическое задание по менеджменту
 Вероятностные модели управления запасами
 Етапи процесу прийняття рішення
 Изменения в организации и расходование ресурсов
 Проект тайный ангел
 Экспертные методы оценки рисков
 Стратегический менеджмент
 Школа менеджеров
 Реинжиниринг бизнес-процессов. Основные концепции улучшения бизнес-процессов. (Тема 1)
 Понятие стратегического менеджмента
 Управление научными исследованиями и разработками. Разработки новых продуктов и технологий
 Оценка персонала компании
 Види туроперейтингу