- Survey. Factors that affecton shopping centers selection

Содержание
- 2. Y=SS0+ SS1X1+ SS2X2+ SS3X3+ SS4X4+ SS5X5+ SS6X6+ SS7X7+ SS8X8+ SS9X9 THERE ARE: Y-your favorite shopping center
- 3. REGRESSION Source | SS df MS Number of obs = 51 -------------+------------------------------ F( 3, 47) =
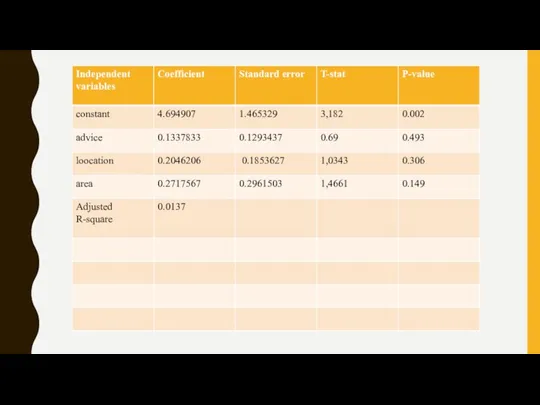
- 4. Y= 4.694907 +0.204*X2+0,133*X5+0,271*X8 When all the independent variables are equal to zero, the intercept of the
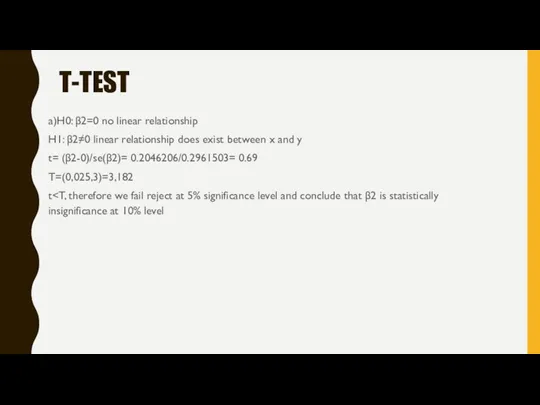
- 5. T-TEST a)H0: β2=0 no linear relationship H1: β2≠0 linear relationship does exist between x and y
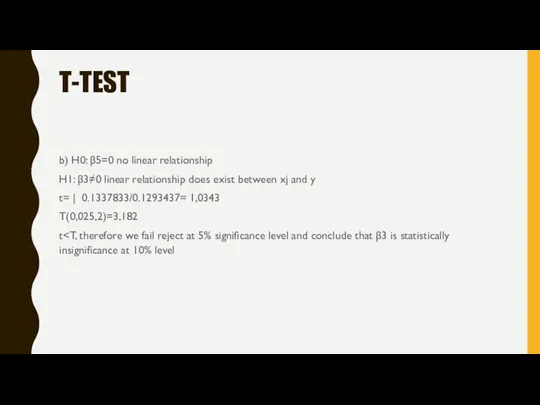
- 6. T-TEST b) H0: β5=0 no linear relationship H1: β3≠0 linear relationship does exist between xj and
- 7. T-TEST c) H0: β8=0 no linear relationship H1: β6≠0 linear relationship does exist between x and
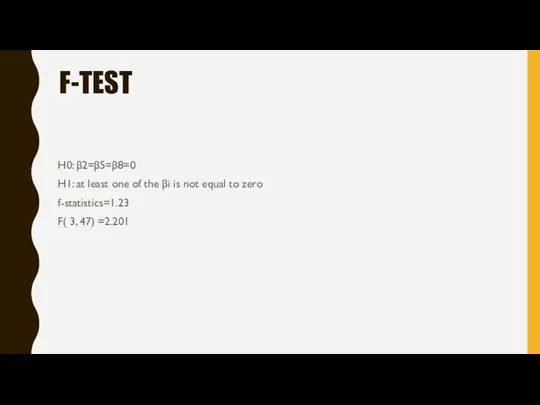
- 8. F-TEST H0: β2=β5=β8=0 H1: at least one of the βi is not equal to zero f-statistics=1.23
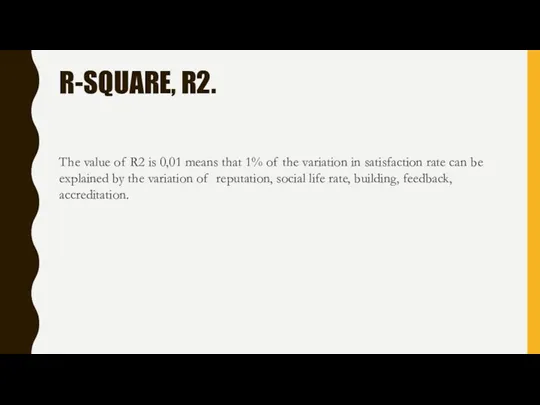
- 9. R-SQUARE, R2. The value of R2 is 0,01 means that 1% of the variation in satisfaction
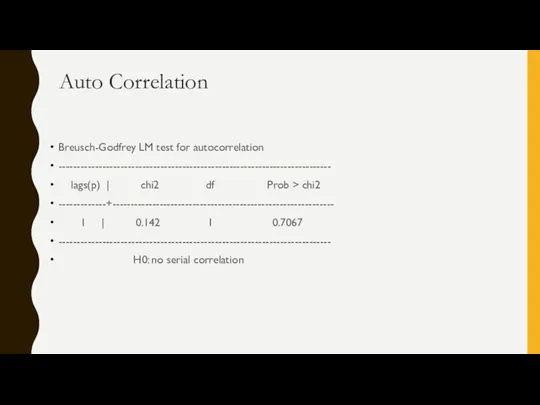
- 10. Auto Correlation Breusch-Godfrey LM test for autocorrelation --------------------------------------------------------------------------- lags(p) | chi2 df Prob > chi2 -------------+-------------------------------------------------------------
- 11. HETROCODECETICITY TEST Breusch-Pagan / Cook-Weisberg test for heteroskedasticity Ho: Constant variance Variables: fitted values of Y
- 12. DURBIN-WATSON TEST Durbin-Watson d-statistic( 4, 51) = 1.857508 0-----------------dl(1.206)---------------------du(1.537)------------4-du(2.463)--------------4-dl(2.79)--------------4 P ? Nope ? Negative No autocorrelation
- 13. Normality test Jarque-Bera normality test: 3.129 Chi(2) 0.2092
- 14. MULTICOLENARITY TEST Variable | VIF 1/VIF -------------+---------------------- X5 | 1.07 0.937834 X2 | 1.04 0.957690 X8
- 15. RAMSEY TEST Ramsey RESET test using powers of the fitted values of Y Ho: model has
- 17. HISTOGRAM
- 19. Скачать презентацию
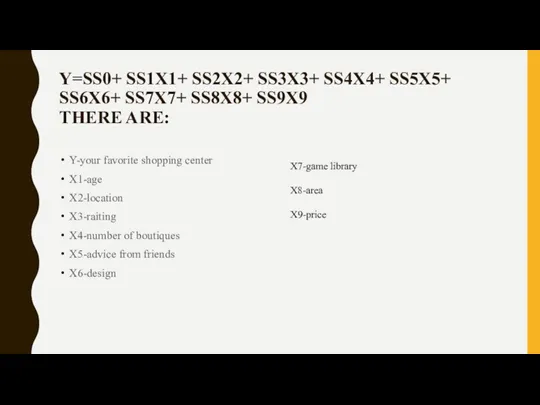
Y=SS0+ SS1X1+ SS2X2+ SS3X3+ SS4X4+ SS5X5+ SS6X6+ SS7X7+ SS8X8+ SS9X9
THERE ARE:
Y-your
Y=SS0+ SS1X1+ SS2X2+ SS3X3+ SS4X4+ SS5X5+ SS6X6+ SS7X7+ SS8X8+ SS9X9
THERE ARE:
Y-your
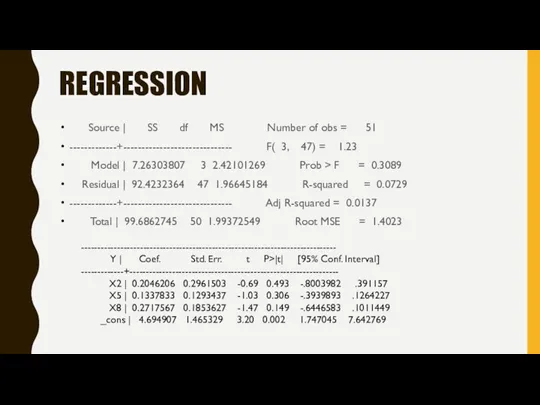
REGRESSION
Source | SS df MS Number of obs = 51
-------------+------------------------------
REGRESSION
Source | SS df MS Number of obs = 51
-------------+------------------------------
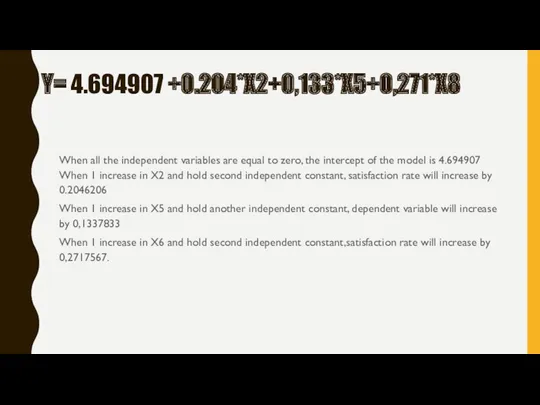
Y= 4.694907 +0.204*X2+0,133*X5+0,271*X8
When all the independent variables are equal to zero,
Y= 4.694907 +0.204*X2+0,133*X5+0,271*X8
When all the independent variables are equal to zero,
T-TEST
a)H0: β2=0 no linear relationship
H1: β2≠0 linear relationship does exist between
T-TEST
a)H0: β2=0 no linear relationship
H1: β2≠0 linear relationship does exist between
T-TEST
b) H0: β5=0 no linear relationship
H1: β3≠0 linear relationship does exist
T-TEST
b) H0: β5=0 no linear relationship
H1: β3≠0 linear relationship does exist

T-TEST
c) H0: β8=0 no linear relationship
H1: β6≠0 linear relationship does exist
T-TEST
c) H0: β8=0 no linear relationship
H1: β6≠0 linear relationship does exist
F-TEST
H0: β2=β5=β8=0
H1: at least one of the βi is not
F-TEST
H0: β2=β5=β8=0
H1: at least one of the βi is not
R-SQUARE, R2.
The value of R2 is 0,01 means that 1% of
R-SQUARE, R2.
The value of R2 is 0,01 means that 1% of
Auto Correlation
Breusch-Godfrey LM test for autocorrelation
---------------------------------------------------------------------------
lags(p) | chi2 df Prob
Auto Correlation
Breusch-Godfrey LM test for autocorrelation
---------------------------------------------------------------------------
lags(p) | chi2 df Prob
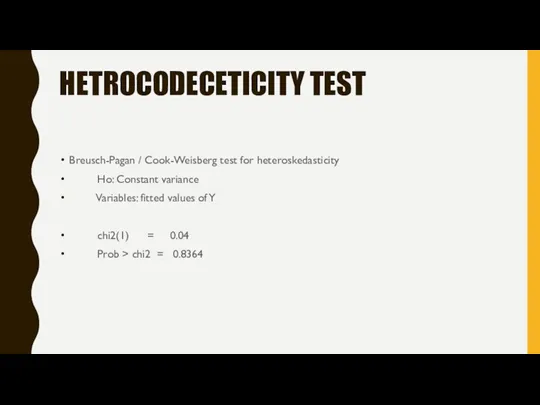
HETROCODECETICITY TEST
Breusch-Pagan / Cook-Weisberg test for heteroskedasticity
Ho: Constant variance
HETROCODECETICITY TEST
Breusch-Pagan / Cook-Weisberg test for heteroskedasticity
Ho: Constant variance
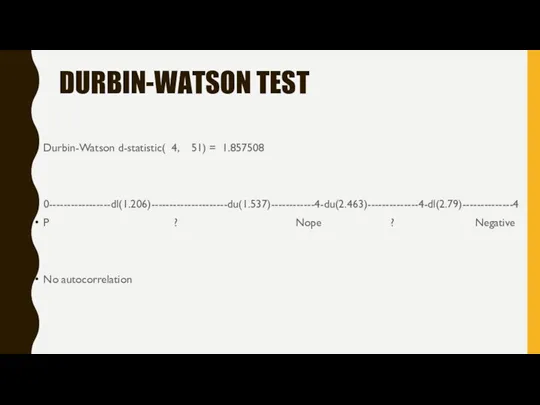
DURBIN-WATSON TEST
Durbin-Watson d-statistic( 4, 51) = 1.857508
0-----------------dl(1.206)---------------------du(1.537)------------4-du(2.463)--------------4-dl(2.79)--------------4
P ? Nope ? Negative
No
DURBIN-WATSON TEST
Durbin-Watson d-statistic( 4, 51) = 1.857508
0-----------------dl(1.206)---------------------du(1.537)------------4-du(2.463)--------------4-dl(2.79)--------------4
P ? Nope ? Negative
No
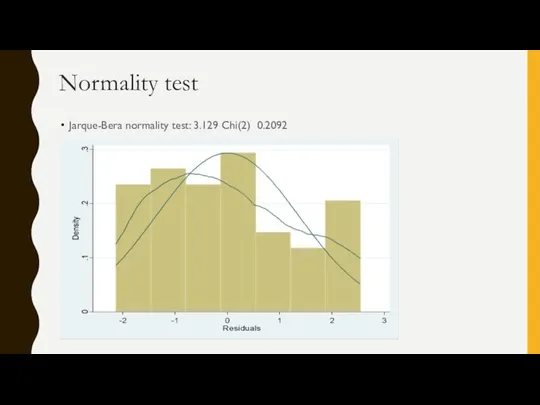
Normality test
Jarque-Bera normality test: 3.129 Chi(2) 0.2092
Normality test
Jarque-Bera normality test: 3.129 Chi(2) 0.2092
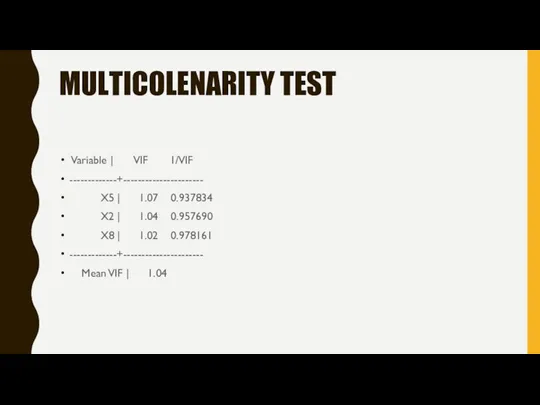
MULTICOLENARITY TEST
Variable | VIF 1/VIF
-------------+----------------------
X5 | 1.07 0.937834
MULTICOLENARITY TEST
Variable | VIF 1/VIF
-------------+----------------------
X5 | 1.07 0.937834
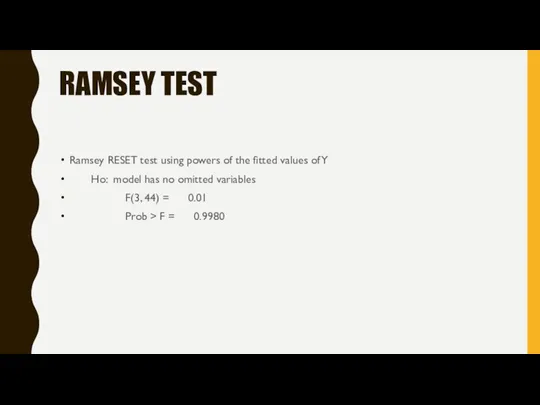
RAMSEY TEST
Ramsey RESET test using powers of the fitted values of
RAMSEY TEST
Ramsey RESET test using powers of the fitted values of
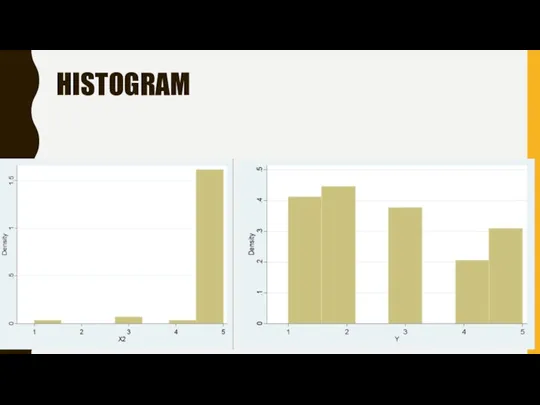
HISTOGRAM
HISTOGRAM
 Умножение чисел на 0 и на 1
 Движение. Урок геометрии. 9 класс
 Паркеты из многоугольников
 Родительское собрание. Математика в школе (5 - 6 классы)
 Решение иррациональных уравнений
 Презентация Название компонентов при вычитании
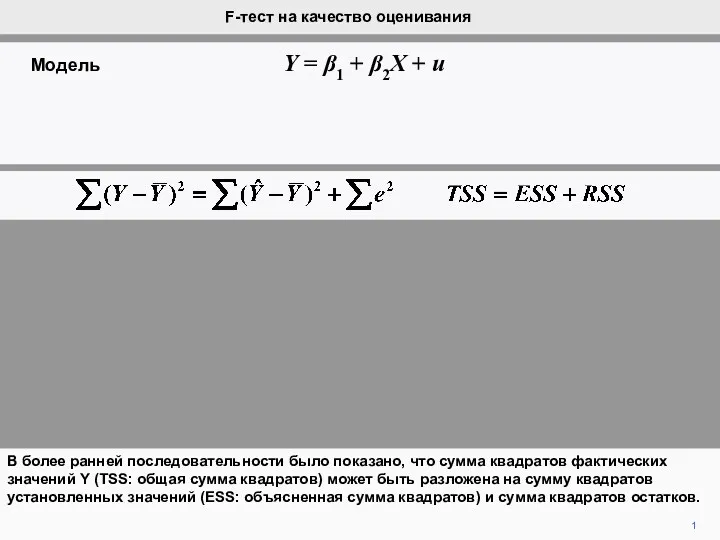 F-тест на качество оценивания
 Градиентные и генетические методы решения оптимизационных задач
 Статистичні помилки. Статистичні гіпотези та їх перевірка. Параметричні і непараметричні критерії перевірки
 Задачи оптимизации производства товаров и услуг
 Показательная функция, ее свойства и график
 Зеркальная симметрия
 Сложение и вычитание алгебраических дробей
 Симметричные фигуры
 Состав чисел 6 и 7
 Десятичные дроби. 5 класс
 Векторы в пространстве
 روش تحقیق پیشرفته .تدوین کننده.دکتر محمد صالحی
 Основные теоремы теории вероятностей
 Обобщающий урок геометрии за курс 8 класса
 Основные математические положения, применяемые для анализа и построения статистической модели
 Разработка контрольно-диагностического материала по разделу математики Натуральные числа 5 класса
 Геометрические фигуры
 Урок - путешествие.
 Арифметична прогресія
 Математика. Поточная практика 7.5. Аналитическая геометрия. Поверхности второго порядка
 Презентация Путешествие в страну вычесляйка 1 класс.
 Отношения. Декартово произведение