- Types of Data – categorical data. Week 2 (1)

Содержание
- 2. NEW IN CLASS? Send me an email to the following address: susanne.saral@okan.edu.tr DR SUSANNE HANSEN SARAL
- 3. Activation of piazza.com account Enter your first and last name Select : Undergraduate Select : Economy
- 4. Where does data come from? Market research Survey (online questionnaires, paper questionnaires, etc.) Interviews Research experiments
- 5. Random Sampling Simple random sampling is a procedure in which: Each member/item in the population is
- 6. Convenience sample A sample where subjects are not chosen strictly by chance. The researchers choses the
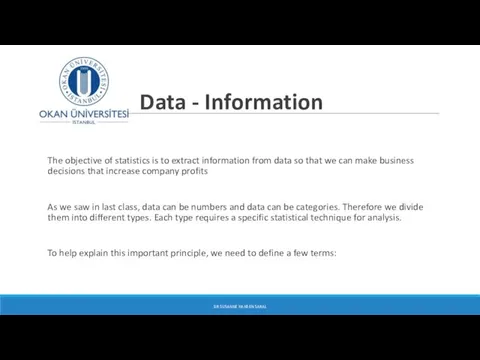
- 7. Data - Information The objective of statistics is to extract information from data so that we
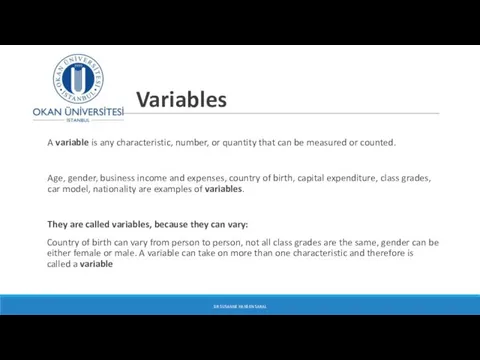
- 8. Variables A variable is any characteristic, number, or quantity that can be measured or counted. Age,
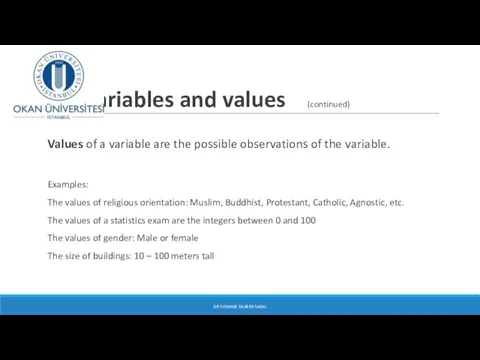
- 9. Variables and values (continued) Values of a variable are the possible observations of the variable. Examples:
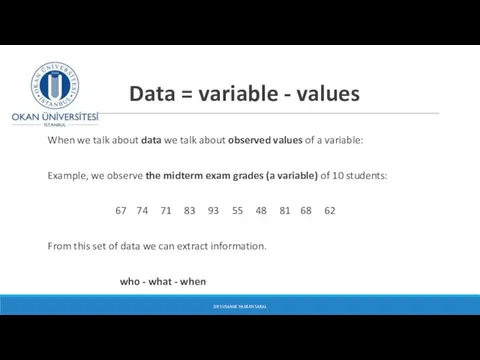
- 10. Data = variable - values When we talk about data we talk about observed values of
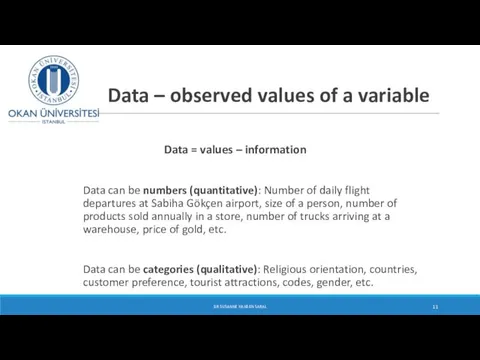
- 11. Data – observed values of a variable Data = values – information Data can be numbers
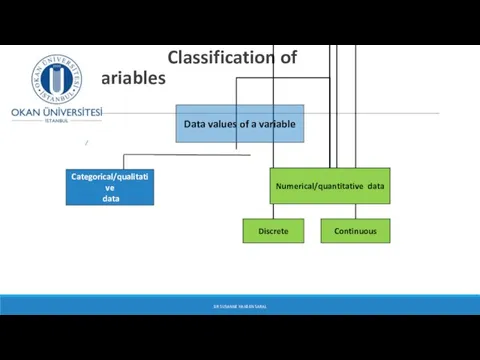
- 12. Classification of variables Knowledge about the type of variable we are working with is necessary, because
- 13. Why classify variables? DR SUSANNE HANSEN SARAL Correctly classifying data is an important first step to
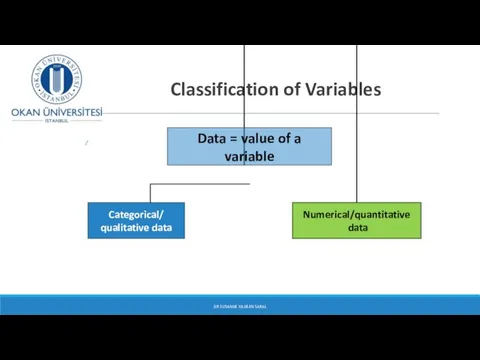
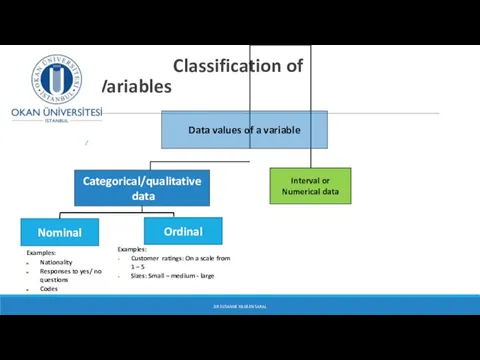
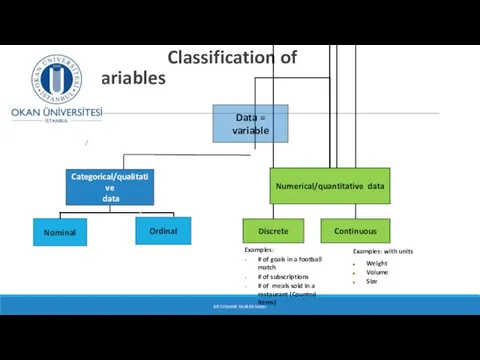
- 14. Classification of Variables DR SUSANNE HANSEN SARAL
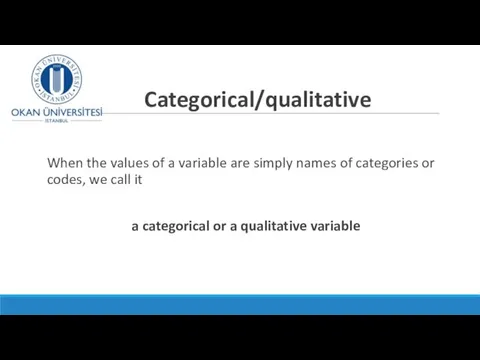
- 15. Categorical/qualitative When the values of a variable are simply names of categories or codes, we call
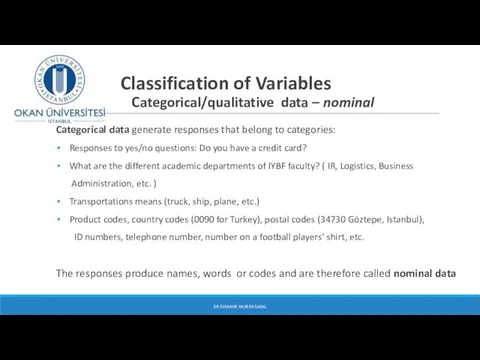
- 16. Classification of Variables Categorical/qualitative data – nominal Categorical data generate responses that belong to categories: Responses
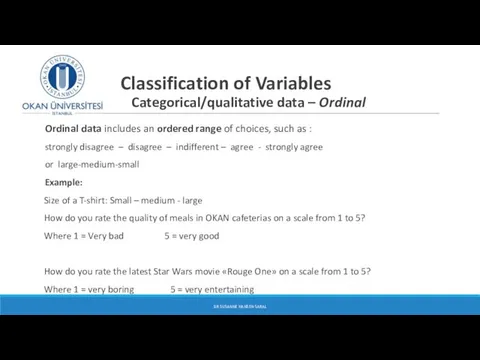
- 17. Classification of Variables Categorical/qualitative data – Ordinal Ordinal data includes an ordered range of choices, such
- 18. Classification of Variables DR SUSANNE HANSEN SARAL Examples: Nationality Responses to yes/ no questions Codes Nominal
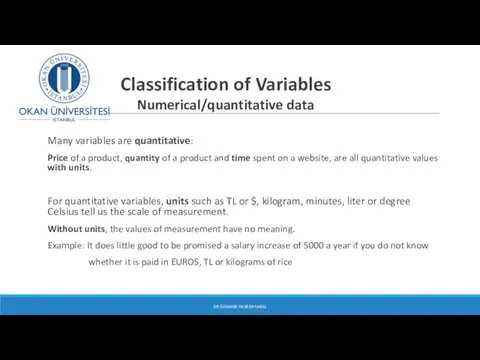
- 19. Classification of Variables Numerical/quantitative data Many variables are quantitative: Price of a product, quantity of a
- 20. Classification of Variables DR SUSANNE HANSEN SARAL
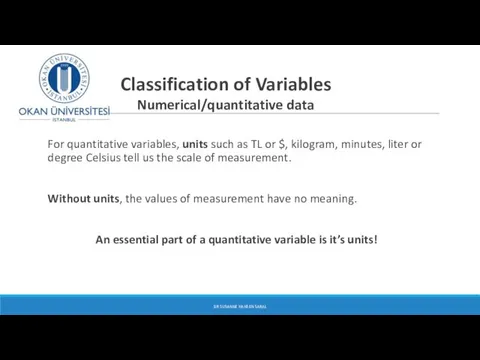
- 21. Classification of Variables Numerical/quantitative data For quantitative variables, units such as TL or $, kilogram, minutes,
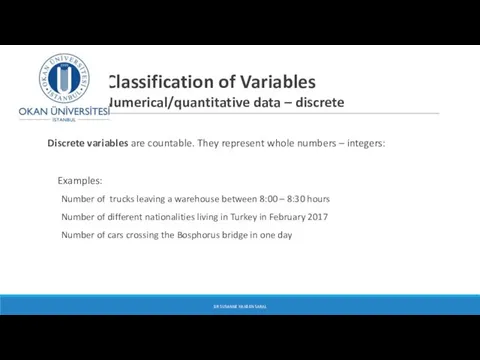
- 22. Classification of Variables Numerical/quantitative data – discrete Discrete variables are countable. They represent whole numbers –
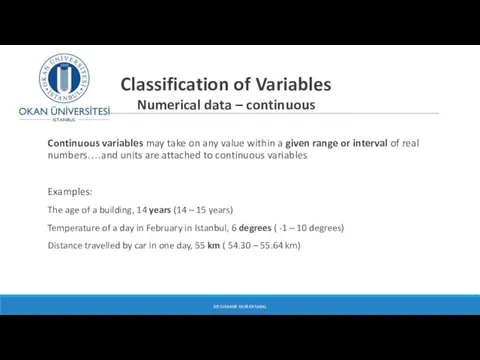
- 23. Classification of Variables Numerical data – continuous Continuous variables may take on any value within a
- 24. For each of the following, identify the type of variable (categorical or numerical) the responses represent:
- 25. Classification of Variables DR SUSANNE HANSEN SARAL Examples: # of goals in a football match #
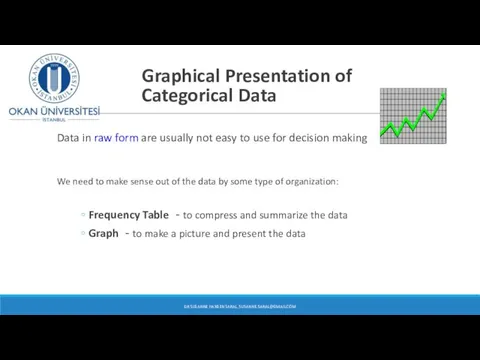
- 26. Graphical Presentation of Categorical Data Data in raw form are usually not easy to use for
- 27. Raw data – data that is not yet organized Example: Football World cup champions (1930 –
- 28. Tables and Graphs for Categorical Variables DR SUSANNE HANSEN SARAL, SUSANNE.SARAL@GMAIL.COM Categorical Data Graphing Data Pie
- 29. Organizing categorical data Categorical data produce values that are names, words or codes, but not real
- 30. The Frequency and relative frequency - Distribution Table Summarizing categorical data A frequency table organizes data
- 31. (Variables are categorical) The Frequency and relative frequency - Distribution Table DR SUSANNE HANSEN SARAL, SUSANNE.SARAL@GMAIL.COM
- 33. Скачать презентацию

NEW IN CLASS?
Send me an email to the following address:
NEW IN CLASS?
Send me an email to the following address:
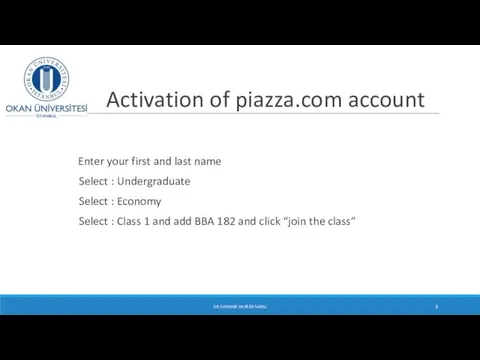
Activation of piazza.com account
Enter your first and last name
Select
Activation of piazza.com account
Enter your first and last name
Select
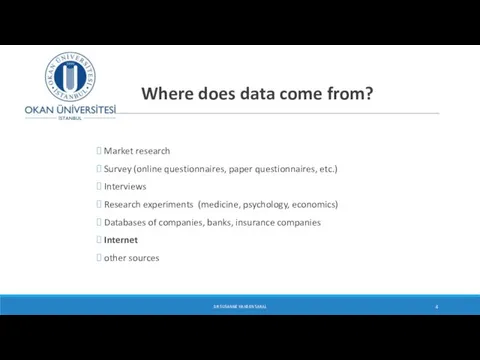
Where does data come from?
Market research
Survey (online questionnaires,
Where does data come from?
Market research
Survey (online questionnaires,
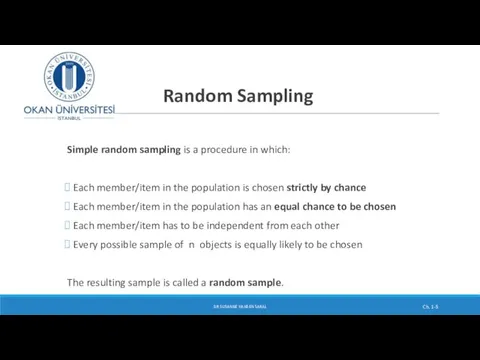
Random Sampling
Simple random sampling is a procedure in which:
Each member/item
Random Sampling
Simple random sampling is a procedure in which:
Each member/item
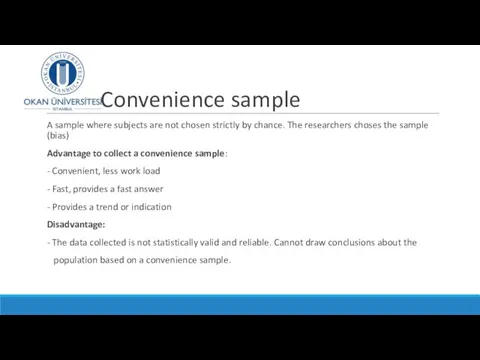
Convenience sample
A sample where subjects are not chosen strictly by chance.
Convenience sample
A sample where subjects are not chosen strictly by chance.
Data - Information
The objective of statistics is to extract information
Data - Information
The objective of statistics is to extract information
Variables
A variable is any characteristic, number, or quantity that can be measured or
Variables
A variable is any characteristic, number, or quantity that can be measured or
Variables and values (continued)
Values of a variable are the possible observations
Variables and values (continued)
Values of a variable are the possible observations
Data = variable - values
When we talk about data we
Data = variable - values
When we talk about data we
Data – observed values of a variable
Data =
Data – observed values of a variable
Data =
Classification of variables
Knowledge about the type of variable we are
Classification of variables
Knowledge about the type of variable we are
Why classify variables?
DR SUSANNE HANSEN SARAL
Correctly classifying data is an important
Why classify variables?
DR SUSANNE HANSEN SARAL
Correctly classifying data is an important
Classification of Variables
DR SUSANNE HANSEN SARAL
Classification of Variables
DR SUSANNE HANSEN SARAL
Categorical/qualitative
When the values of a variable are simply names
Categorical/qualitative
When the values of a variable are simply names
Classification of Variables
Categorical/qualitative data – nominal
Categorical data generate responses
Classification of Variables
Categorical/qualitative data – nominal
Categorical data generate responses
Classification of Variables
Categorical/qualitative data – Ordinal
Ordinal data includes an ordered
Classification of Variables
Categorical/qualitative data – Ordinal
Ordinal data includes an ordered
Classification of Variables
DR SUSANNE HANSEN SARAL
Examples:
Nationality
Responses to yes/ no questions
Codes
Nominal
Ordinal
Examples:
Customer
Classification of Variables
DR SUSANNE HANSEN SARAL
Examples:
Nationality
Responses to yes/ no questions
Codes
Nominal
Ordinal
Examples:
Customer
Classification of Variables
Numerical/quantitative data
Many variables are quantitative:
Price of a
Classification of Variables
Numerical/quantitative data
Many variables are quantitative:
Price of a
Classification of Variables
DR SUSANNE HANSEN SARAL
Classification of Variables
DR SUSANNE HANSEN SARAL
Classification of Variables
Numerical/quantitative data
For quantitative variables, units such as
Classification of Variables
Numerical/quantitative data
For quantitative variables, units such as
Classification of Variables
Numerical/quantitative data – discrete
Discrete variables are countable.
Classification of Variables
Numerical/quantitative data – discrete
Discrete variables are countable.
Classification of Variables
Numerical data – continuous
Continuous variables may take on
Classification of Variables
Numerical data – continuous
Continuous variables may take on
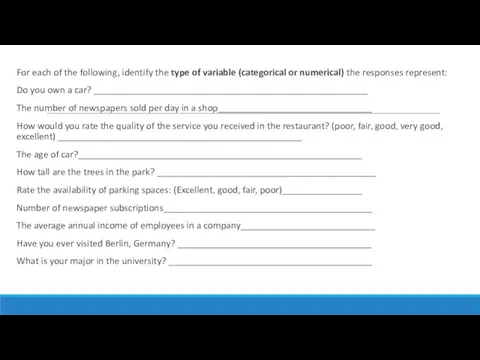
For each of the following, identify the type of variable (categorical
For each of the following, identify the type of variable (categorical
Classification of Variables
DR SUSANNE HANSEN SARAL
Examples:
# of goals in a
Classification of Variables
DR SUSANNE HANSEN SARAL
Examples:
# of goals in a
Graphical Presentation of Categorical Data
Data in raw form are usually
Graphical Presentation of Categorical Data
Data in raw form are usually
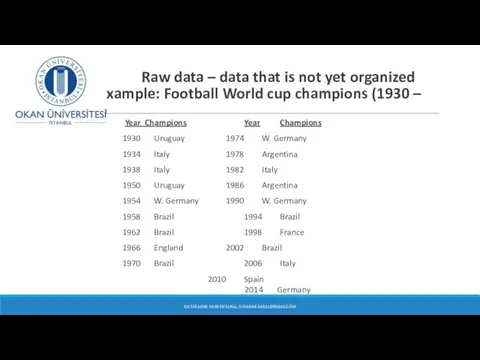
Raw data – data that is not yet organized Example:
Raw data – data that is not yet organized Example:
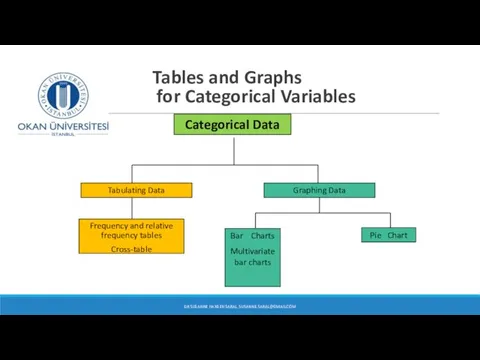
Tables and Graphs for Categorical Variables
DR SUSANNE HANSEN SARAL, SUSANNE.SARAL@GMAIL.COM
Categorical
Tables and Graphs for Categorical Variables
DR SUSANNE HANSEN SARAL, SUSANNE.SARAL@GMAIL.COM
Categorical
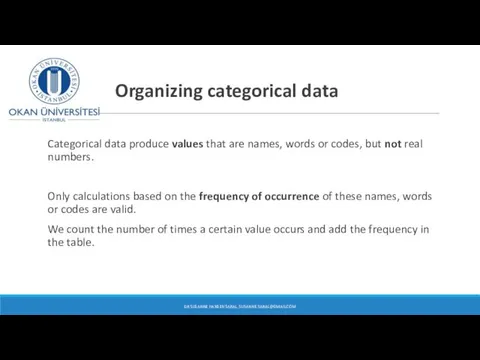
Organizing categorical data
Categorical data produce values that are names,
Organizing categorical data
Categorical data produce values that are names,
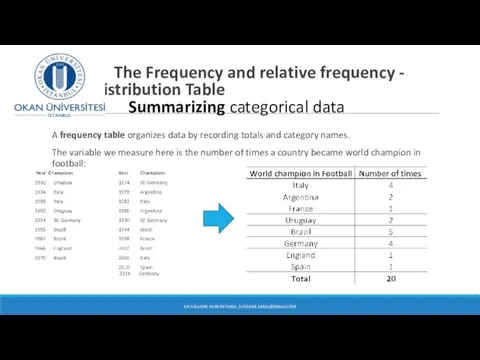
The Frequency and relative frequency - Distribution Table
Summarizing categorical data
The Frequency and relative frequency - Distribution Table Summarizing categorical data
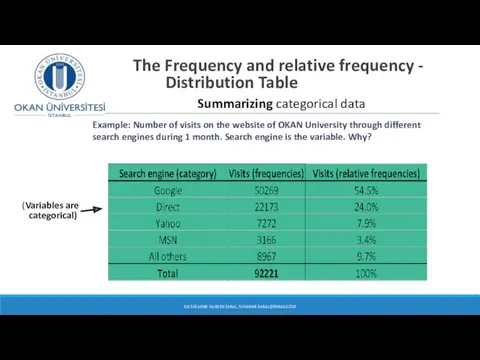
(Variables are
categorical)
The Frequency and relative frequency - Distribution Table
DR
(Variables are
categorical)
The Frequency and relative frequency - Distribution Table
DR
 Язык геометрических рисунков
 Сложение однозначных чисел с переходом через десяток вида + 5
 Повторение материала за 7 класс
 Задачи на совместную работу 5 класс
 МПМ-матрица посадочных лист
 Устный счёт
 Случаи сложения вида +4
 Математические основы построения экспертной модели при расплывчатости границ между смежными рангами пожара
 Разработка и анализ алгоритмов
 Формула разности квадратов
 Поворот и параллельный перенос
 Сложение рациональных чисел
 Презентация к уроку математики в 1 классе по теме:Прибавить и вычесть 1. УМК ШР
 Отношения между множествами
 Статистическая обработка данных
 Извлечение квадратного корня (примеры)
 Бөлшек-рационал теңдеулерді шешу
 Решение задач
 Фронтальная работа на уроках математики.
 Презентация по математике Умножение в Простоквашино
 Высшая математика. Учебно-методическое пособие для подготовки к компьютерному тестированию. 2 семестр
 1нче сыйныфта 1санын алу темасына дәрескә презентация
 Параллельные прямые
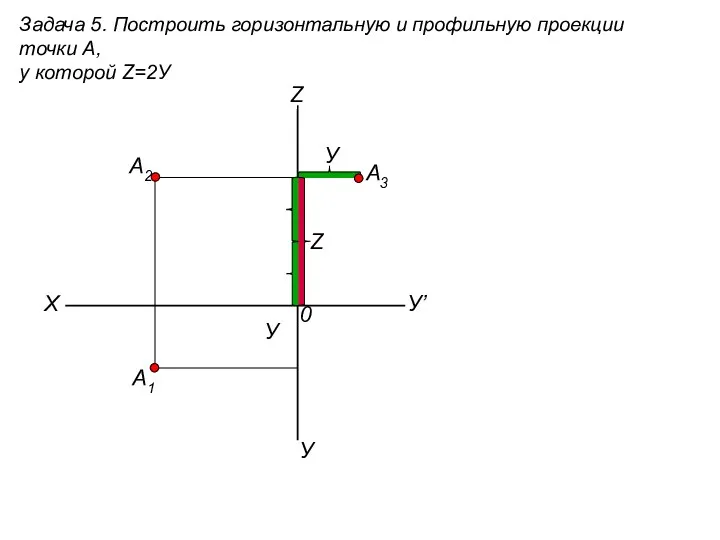 Построить горизонтальную и профильную проекции точки А. (Задача 5)
 Понятие множества. Операции над множествами
 Упрощение выражений. Урок 67
 Физический смысл производной
 Презентация к уроку математики по теме Умножение многозначных чисел на однозначное. 3 класс.