- Research methodology

Содержание
- 2. AGENDA Quantitative research in Management: methodology. Introduction to IBM SPSS – September 6 Data visualization. Descriptive
- 3. DESCRIBING DATA: «FIRST SIGHT ON THE DATA» Graphical description E.g., histograms (to identify outlines – «выбросы»)
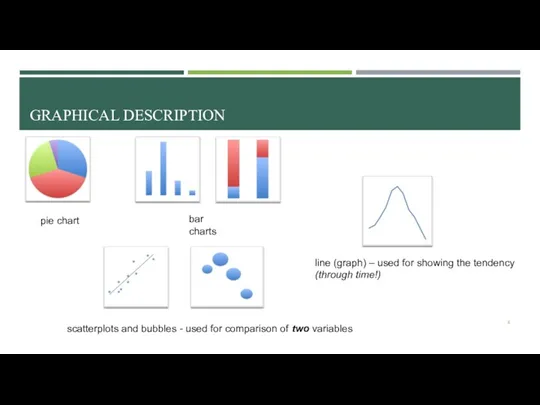
- 4. GRAPHICAL DESCRIPTION pie chart bar charts scatterplots and bubbles - used for comparison of two variables
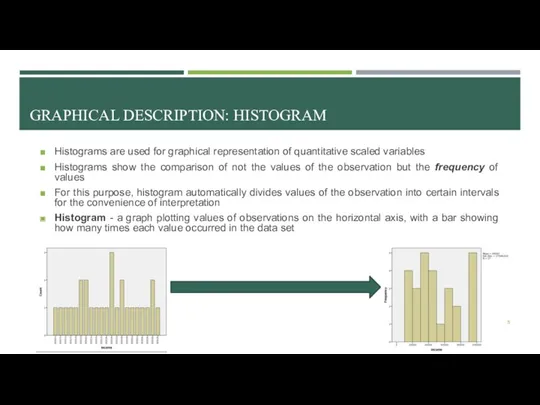
- 5. GRAPHICAL DESCRIPTION: HISTOGRAM Histograms are used for graphical representation of quantitative scaled variables Histograms show the
- 6. THE NORMAL DISTRIBUTION
- 7. GRAPHICAL DESCRIPTION: HISTOGRAMS AND NORMAL DISTRIBUTION The ‘Normal’ distribution Bell («колокол») shaped Symmetrical around the center
- 8. TEST OF NORMALITY: HOW TO TEST IF THE DATA IS NORMALLY DISTRIBUTED? 1st way: To look
- 9. TEST OF NORMALITY: HOW TO TEST IF THE DATA IS NORMALLY DISTRIBUTED? 2nd way: To conduct
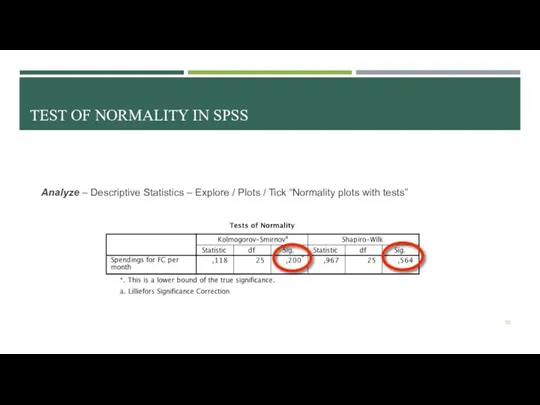
- 10. TEST OF NORMALITY IN SPSS Analyze – Descriptive Statistics – Explore / Plots / Tick “Normality
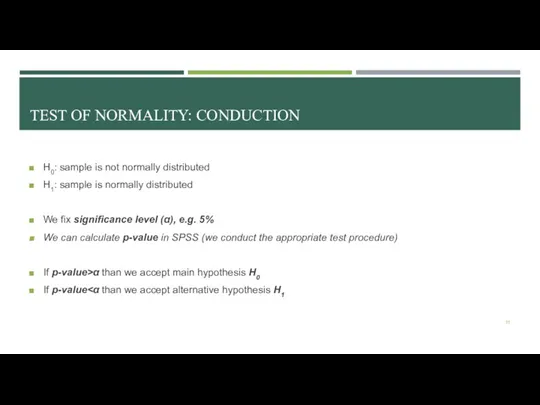
- 11. TEST OF NORMALITY: CONDUCTION H0: sample is not normally distributed H1: sample is normally distributed We
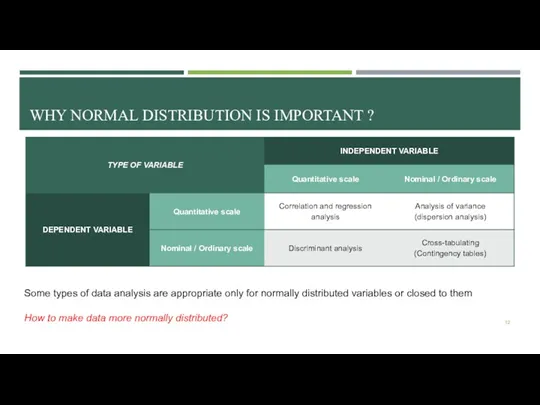
- 12. WHY NORMAL DISTRIBUTION IS IMPORTANT ? Some types of data analysis are appropriate only for normally
- 13. DESCRIBING DATA: «FIRST SIGHT ON THE DATA» Graphical description E.g., histograms (to identify outlines – «выбросы»)
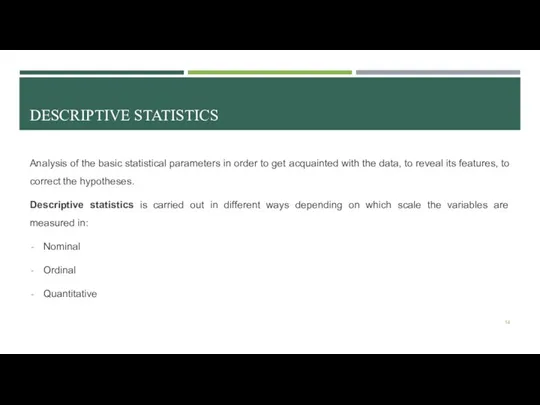
- 14. DESCRIPTIVE STATISTICS Analysis of the basic statistical parameters in order to get acquainted with the data,
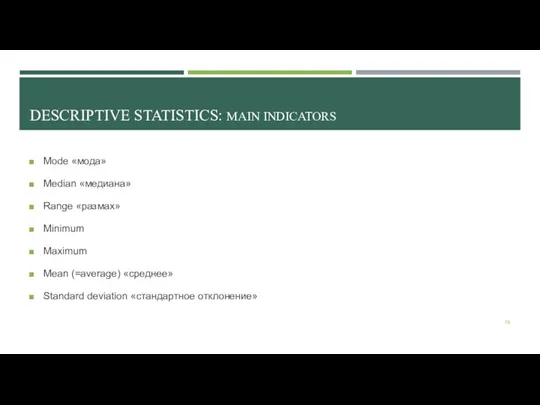
- 15. DESCRIPTIVE STATISTICS: MAIN INDICATORS Mode «мода» Median «медиана» Range «размах» Minimum Maximum Mean (=average) «среднее» Standard
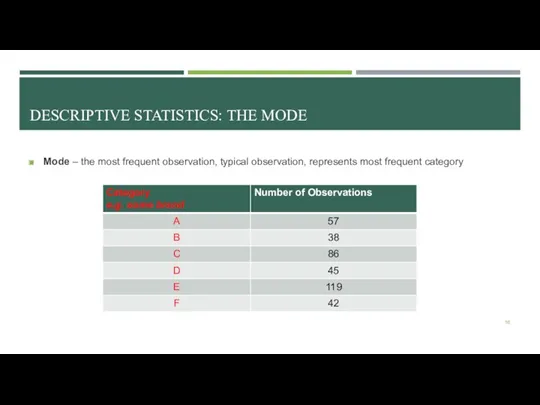
- 16. DESCRIPTIVE STATISTICS: THE MODE Mode – the most frequent observation, typical observation, represents most frequent category
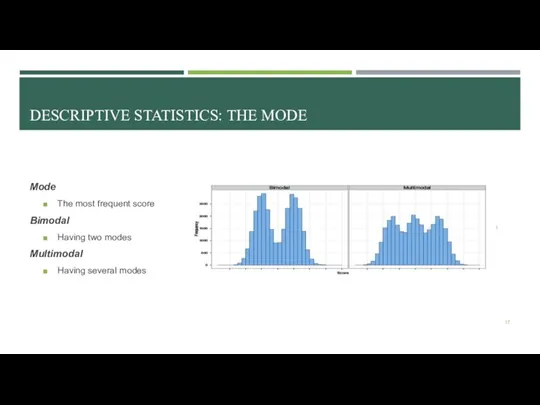
- 17. DESCRIPTIVE STATISTICS: THE MODE Mode The most frequent score Bimodal Having two modes Multimodal Having several
- 18. DESCRIPTIVE STATISTICS: THE MEDIAN Median – the value that is in the middle: half of the
- 19. DESCRIPTIVE STATISTICS: RANGE, MINIMUM, MAXIMUM Range The smallest / lowest score (minimum) subtracted from the largest
- 20. DESCRIPTIVE STATISTICS: THE MEAN Mean The sum of scores divided by number of scores
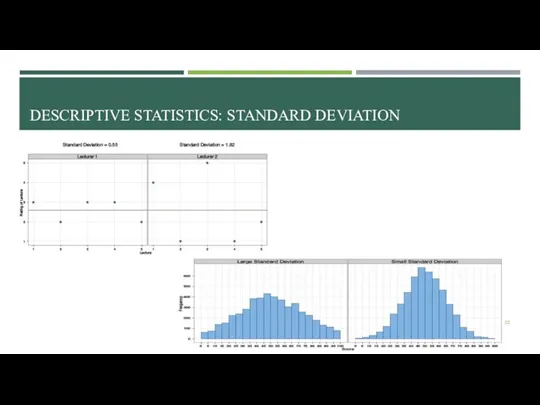
- 21. DESCRIPTIVE STATISTICS: STANDARD DEVIATION Standard deviation the most common indicator of the dispersion of values of
- 22. DESCRIPTIVE STATISTICS: STANDARD DEVIATION
- 23. STANDARD DEVIATION AND NORMAL DISTRIBUTION SD (standard deviation) ≤ 1/3 * Mean
- 24. DESCRIPTIVE STATISTICS IN SPSS Analyze – Descriptive statistics – Frequencies OR Analyze – Descriptive statistics –
- 25. DESCRIPTIVE STATISTICS FOR VARIABLES IN DIFFERENT SCALES Nominal – mode Ordinal – mode + median, mean,
- 26. CROSS-TABULATING (CONTINGENCY TABLES)
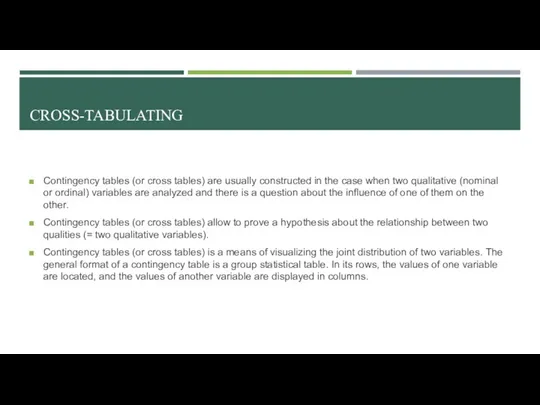
- 27. CROSS-TABULATING Contingency tables (or cross tables) are usually constructed in the case when two qualitative (nominal
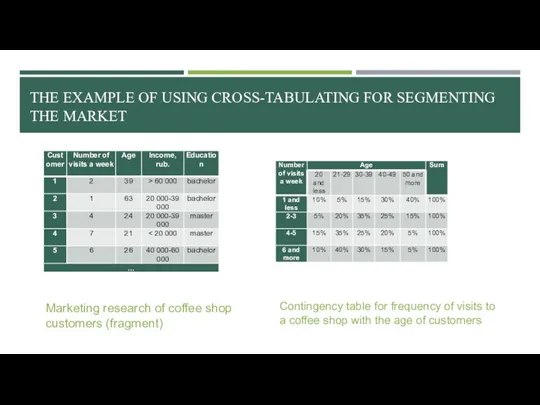
- 28. THE EXAMPLE OF USING CROSS-TABULATING FOR SEGMENTING THE MARKET Marketing research of coffee shop customers (fragment)
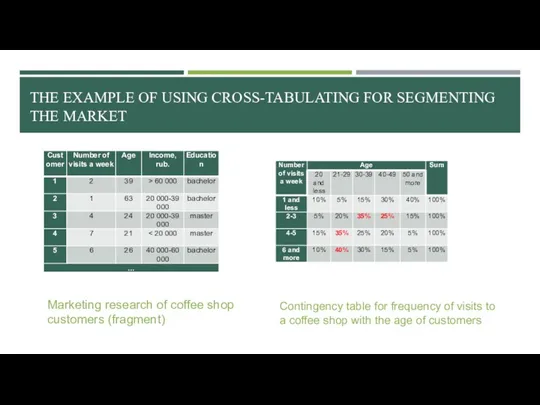
- 29. THE EXAMPLE OF USING CROSS-TABULATING FOR SEGMENTING THE MARKET Marketing research of coffee shop customers (fragment)
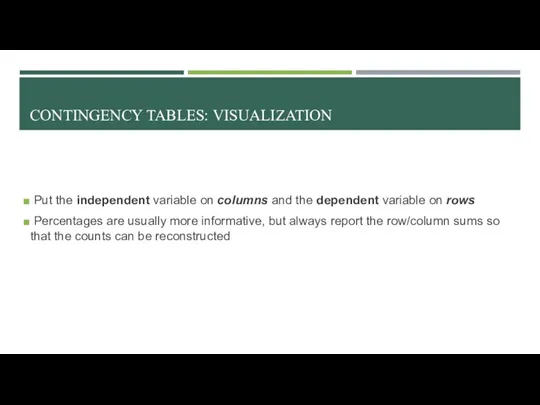
- 30. CONTINGENCY TABLES: VISUALIZATION Put the independent variable on columns and the dependent variable on rows Percentages
- 31. Pearson Chi-Square test is a nonparametric method that allows to check the presence or absence of
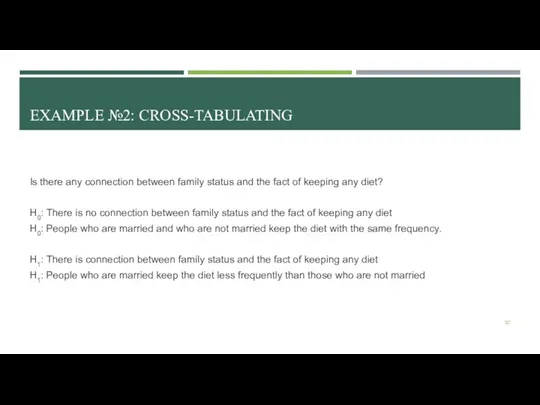
- 32. EXAMPLE №2: CROSS-TABULATING Is there any connection between family status and the fact of keeping any
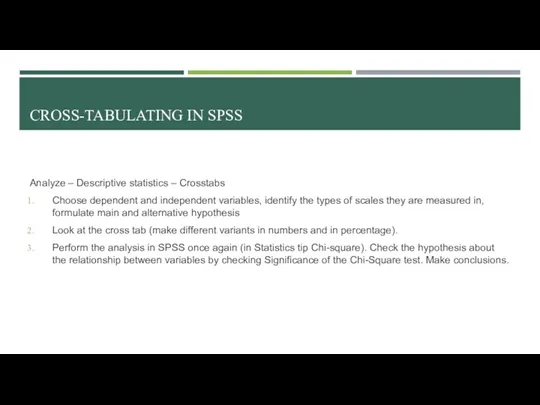
- 33. CROSS-TABULATING IN SPSS Analyze – Descriptive statistics – Crosstabs Choose dependent and independent variables, identify the
- 34. WHAT TO DO WITH THE QUANTITATIVE DATA?..
- 36. Скачать презентацию
AGENDA
Quantitative research in Management: methodology. Introduction to IBM SPSS – September
AGENDA
Quantitative research in Management: methodology. Introduction to IBM SPSS – September
DESCRIBING DATA: «FIRST SIGHT ON THE DATA»
Graphical description
E.g., histograms (to identify
DESCRIBING DATA: «FIRST SIGHT ON THE DATA»
Graphical description
E.g., histograms (to identify
GRAPHICAL DESCRIPTION
pie chart
bar charts
scatterplots and bubbles - used for comparison of
GRAPHICAL DESCRIPTION
pie chart
bar charts
scatterplots and bubbles - used for comparison of
GRAPHICAL DESCRIPTION: HISTOGRAM
Histograms are used for graphical representation of quantitative scaled
GRAPHICAL DESCRIPTION: HISTOGRAM
Histograms are used for graphical representation of quantitative scaled
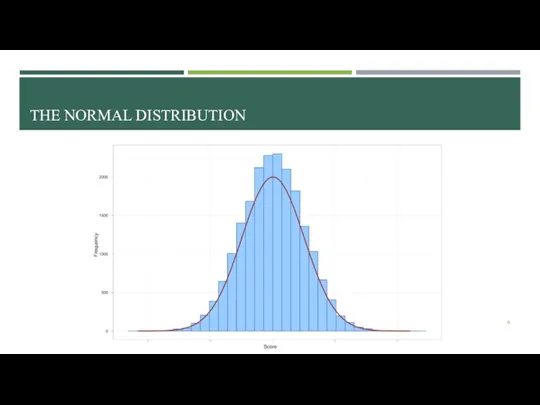
THE NORMAL DISTRIBUTION
THE NORMAL DISTRIBUTION
GRAPHICAL DESCRIPTION: HISTOGRAMS AND NORMAL DISTRIBUTION
The ‘Normal’ distribution
Bell («колокол») shaped
Symmetrical around
GRAPHICAL DESCRIPTION: HISTOGRAMS AND NORMAL DISTRIBUTION
The ‘Normal’ distribution
Bell («колокол») shaped
Symmetrical around
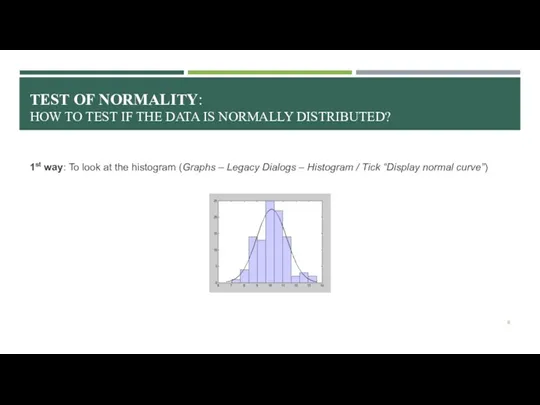
TEST OF NORMALITY:
HOW TO TEST IF THE DATA IS NORMALLY
TEST OF NORMALITY: HOW TO TEST IF THE DATA IS NORMALLY
TEST OF NORMALITY:
HOW TO TEST IF THE DATA IS NORMALLY
TEST OF NORMALITY: HOW TO TEST IF THE DATA IS NORMALLY
TEST OF NORMALITY IN SPSS
Analyze – Descriptive Statistics – Explore /
TEST OF NORMALITY IN SPSS
Analyze – Descriptive Statistics – Explore /
TEST OF NORMALITY: CONDUCTION
H0: sample is not normally distributed
H1: sample is
TEST OF NORMALITY: CONDUCTION
H0: sample is not normally distributed
H1: sample is
WHY NORMAL DISTRIBUTION IS IMPORTANT ?
Some types of data analysis are
WHY NORMAL DISTRIBUTION IS IMPORTANT ?
Some types of data analysis are
DESCRIBING DATA: «FIRST SIGHT ON THE DATA»
Graphical description
E.g., histograms (to identify
DESCRIBING DATA: «FIRST SIGHT ON THE DATA»
Graphical description
E.g., histograms (to identify
DESCRIPTIVE STATISTICS
Analysis of the basic statistical parameters in order to get
DESCRIPTIVE STATISTICS
Analysis of the basic statistical parameters in order to get
DESCRIPTIVE STATISTICS: MAIN INDICATORS
Mode «мода»
Median «медиана»
Range «размах»
Minimum
Maximum
Mean (=average) «среднее»
Standard deviation «стандартное
DESCRIPTIVE STATISTICS: MAIN INDICATORS
Mode «мода»
Median «медиана»
Range «размах»
Minimum
Maximum
Mean (=average) «среднее»
Standard deviation «стандартное
DESCRIPTIVE STATISTICS: THE MODE
Mode – the most frequent observation, typical observation,
DESCRIPTIVE STATISTICS: THE MODE
Mode – the most frequent observation, typical observation,
DESCRIPTIVE STATISTICS: THE MODE
Mode
The most frequent score
Bimodal
Having two modes
Multimodal
Having several modes
DESCRIPTIVE STATISTICS: THE MODE
Mode
The most frequent score
Bimodal
Having two modes
Multimodal
Having several modes
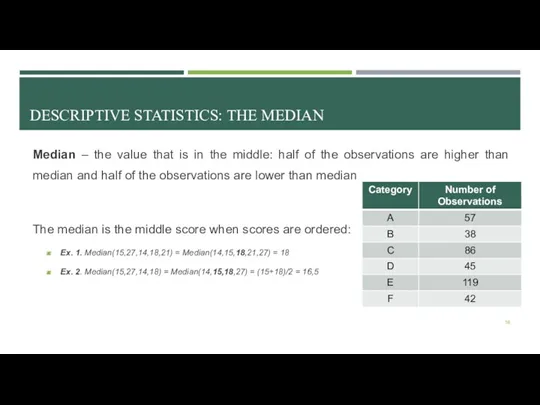
DESCRIPTIVE STATISTICS: THE MEDIAN
Median – the value that is in the
DESCRIPTIVE STATISTICS: THE MEDIAN
Median – the value that is in the
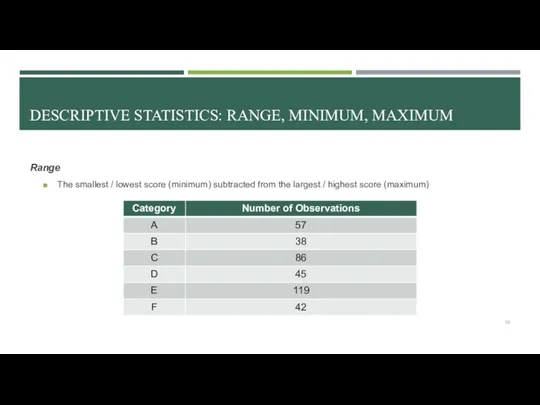
DESCRIPTIVE STATISTICS: RANGE, MINIMUM, MAXIMUM
Range
The smallest / lowest score (minimum) subtracted
DESCRIPTIVE STATISTICS: RANGE, MINIMUM, MAXIMUM
Range
The smallest / lowest score (minimum) subtracted
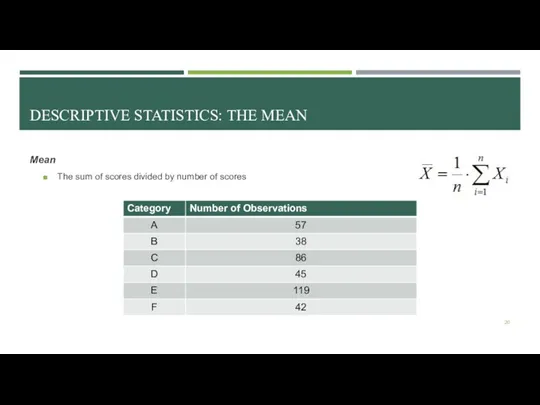
DESCRIPTIVE STATISTICS: THE MEAN
Mean
The sum of scores divided by number of
DESCRIPTIVE STATISTICS: THE MEAN
Mean
The sum of scores divided by number of
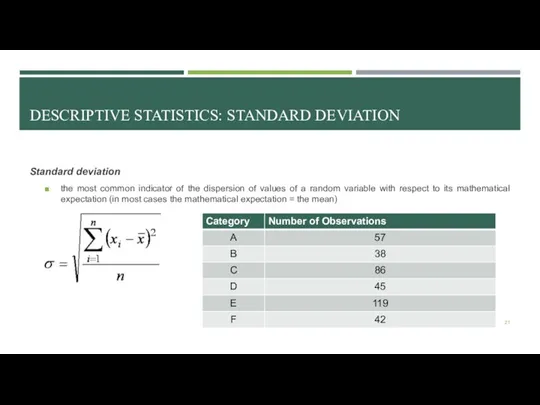
DESCRIPTIVE STATISTICS: STANDARD DEVIATION
Standard deviation
the most common indicator of the
DESCRIPTIVE STATISTICS: STANDARD DEVIATION
Standard deviation
the most common indicator of the
DESCRIPTIVE STATISTICS: STANDARD DEVIATION
DESCRIPTIVE STATISTICS: STANDARD DEVIATION
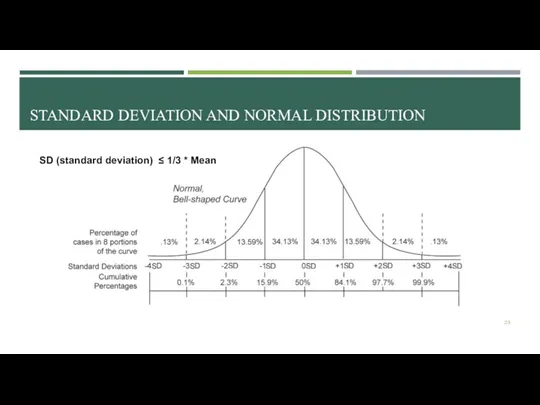
STANDARD DEVIATION AND NORMAL DISTRIBUTION
SD (standard deviation) ≤ 1/3 * Mean
STANDARD DEVIATION AND NORMAL DISTRIBUTION
SD (standard deviation) ≤ 1/3 * Mean
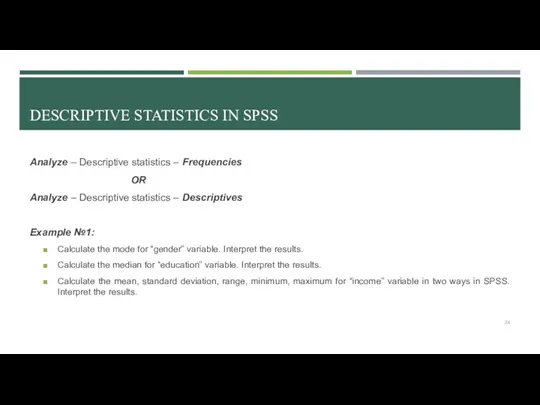
DESCRIPTIVE STATISTICS IN SPSS
Analyze – Descriptive statistics – Frequencies
OR
Analyze – Descriptive
DESCRIPTIVE STATISTICS IN SPSS
Analyze – Descriptive statistics – Frequencies
OR
Analyze – Descriptive
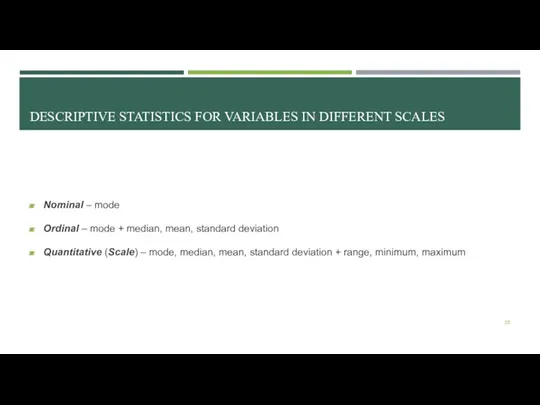
DESCRIPTIVE STATISTICS FOR VARIABLES IN DIFFERENT SCALES
Nominal – mode
Ordinal –
DESCRIPTIVE STATISTICS FOR VARIABLES IN DIFFERENT SCALES
Nominal – mode
Ordinal –
CROSS-TABULATING
(CONTINGENCY TABLES)
CROSS-TABULATING
(CONTINGENCY TABLES)
CROSS-TABULATING
Contingency tables (or cross tables) are usually constructed in the case
CROSS-TABULATING
Contingency tables (or cross tables) are usually constructed in the case
THE EXAMPLE OF USING CROSS-TABULATING FOR SEGMENTING THE MARKET
Marketing research of
THE EXAMPLE OF USING CROSS-TABULATING FOR SEGMENTING THE MARKET
Marketing research of
THE EXAMPLE OF USING CROSS-TABULATING FOR SEGMENTING THE MARKET
Marketing research of
THE EXAMPLE OF USING CROSS-TABULATING FOR SEGMENTING THE MARKET
Marketing research of
CONTINGENCY TABLES: VISUALIZATION
Put the independent variable on columns and the
CONTINGENCY TABLES: VISUALIZATION
Put the independent variable on columns and the
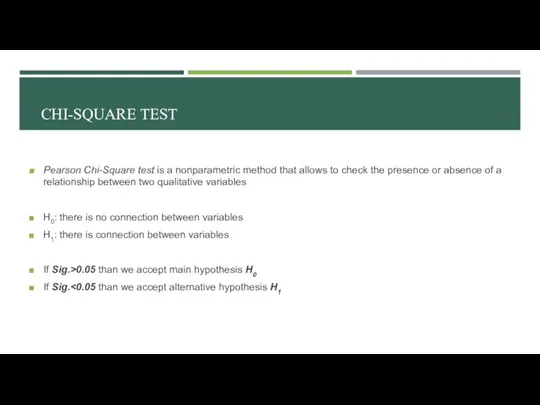
Pearson Chi-Square test is a nonparametric method that allows to check
Pearson Chi-Square test is a nonparametric method that allows to check
EXAMPLE №2: CROSS-TABULATING
Is there any connection between family status and the
EXAMPLE №2: CROSS-TABULATING
Is there any connection between family status and the
CROSS-TABULATING IN SPSS
Analyze – Descriptive statistics – Crosstabs
Choose dependent and independent
CROSS-TABULATING IN SPSS
Analyze – Descriptive statistics – Crosstabs
Choose dependent and independent
WHAT TO DO WITH THE QUANTITATIVE DATA?..
WHAT TO DO WITH THE QUANTITATIVE DATA?..
 Комиссарские мероприятия на целине и в подготовительный период
 Бренд-менеджмент (управление торговой маркой). Кобрендинг
 Менеджмент. Поняття та сутність
 Определение системы. Классы систем
 Общая характеристика направления Менеджмент. Тема 1
 Анализ элементов корпоративной культуры в отеле Чеховъ г. Екатеринбург
 Международные речные перевозки грузов
 Кадры организации
 Курт Левин. Модели управления изменениями
 Координация и контроль как функции управления
 Эффективность управления организацией
 Международные стандарты серии ИСО 9000 по управлению качеством и обеспечению качества
 Организация туристской индустрии
 Мотивация трудовой деятельности
 Лидерство в системе менеджмента
 Work Systems Design
 Стратегия голубого океана (Blue ocean strategy – BOS)
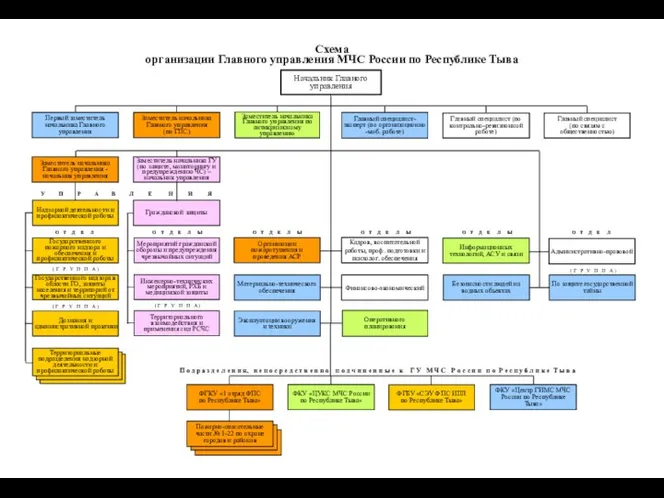 Схема организации Главного управления МЧС России по Республике Тыва
 Топтың түрлері. (эталон, негізгі, қосалқы топтар). Топтық шешімдер қабылдау
 Упаковка и тара. Маркировка грузов
 Портрет менеджера. Основные качества менеджера
 Формы деловых коммуникаций
 Приглашение на первую встречу. Рекрутирование
 Модели принятия решений
 Классификация предприятий по типу инновационного поведения
 Формирование базисных стратегий продукта
 Прийняття управлінських рішень
 Особенности оформления основных видов управленческих документов