- A short report giving key information about charts, maps or diagrams

Содержание
- 2. LINE GRAPH
- 3. PIE CHART
- 4. PROCESS DIAGRAM
- 5. MAPS
- 6. TABLE
- 7. YOU SHOULD: WRITE MORE THAN 150 WORDS SPEND 20 MINUTES 1/3 OF YOUR MARKS DESCRIBE VISUAL
- 8. HOW AM I GOING TO BE SCORED? TASK ACHIEVEMENT HOW WELL YOU ANSWERED THE QUESTION To
- 9. COHERENCE AND COHESION HOW YOU ORGANIZE YOUR ANSWER AND LINK YOUR IDEAS TOGETHER Paraphrase effectively Respond
- 10. LEXICAL RESOURCE HOW ADVANCED YOUR VOCABULARY IS AND HOW WELL YOU CAN USE IT Use a
- 11. GRAMMATICAL RANGE AND ACCURACY THE ABILITY TO USE A RANGE OF SENTENCE TYPES WITHOUT MAKING TOO
- 12. QUESTIONS TO ASK YOURSELF WHAT IS THE KEY DATA? (Axes/ columns and rows) WHAT ARE THE
- 13. STRUCTURE INTRODUCTION (1 SENTENCE) OVERVIEW (2 SENTENCES) DETAIL PARAGRAPH 1 DETAIL PARAGRAPH 2
- 14. STRUCTURE INTRODUCTION PARAPHRASE YOUR QUESTION (REWRITE THE QUESTION IN YOUR OWN WORDS) SHOWS ILLUSTRATES GIVES INFORMATION
- 15. OVERVIEW PRESENT A CLEAR OVERVIEW OF MAIN TRENDS, DIFFERENCES OR STAGES It should not contain a
- 16. Identify the main general trends in this graph. What could you briefly say about each country?
- 17. PLANNING NOTES G1: UK + G G2: F OVERVIEW UK + G = STEADY, CONSISTENT INCREASE
- 18. OVERVIEW EXAMPLE Overall, the recycling rates of the UK and Germany rose steadily and consistently over
- 19. Possible adjectives gradual sharp dramatic slight steady significant considerable rapid Possible nouns: decline decrease drop fall
- 22. Скачать презентацию
LINE GRAPH
LINE GRAPH
PIE CHART
PIE CHART
PROCESS DIAGRAM
PROCESS DIAGRAM
MAPS
MAPS
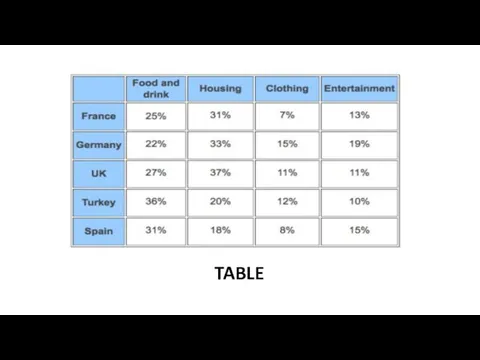
TABLE
TABLE
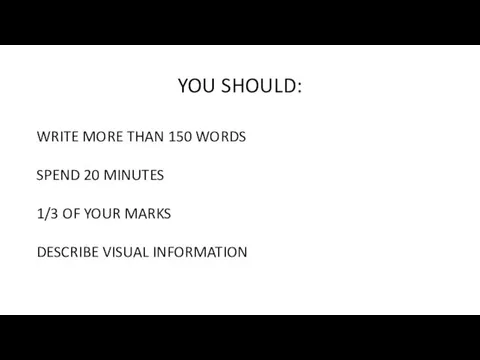
YOU SHOULD:
WRITE MORE THAN 150 WORDS
SPEND 20 MINUTES
1/3 OF YOUR MARKS
DESCRIBE
YOU SHOULD:
WRITE MORE THAN 150 WORDS
SPEND 20 MINUTES
1/3 OF YOUR MARKS
DESCRIBE

HOW AM I GOING TO BE SCORED?
TASK ACHIEVEMENT
HOW WELL YOU ANSWERED
HOW AM I GOING TO BE SCORED?
TASK ACHIEVEMENT
HOW WELL YOU ANSWERED
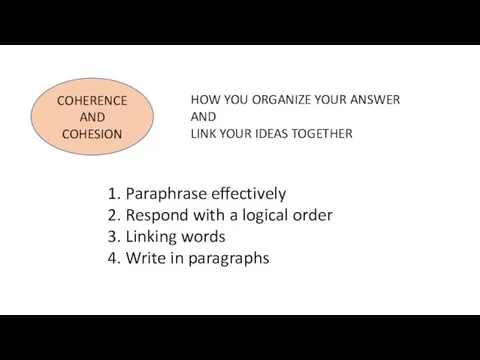
COHERENCE AND COHESION
HOW YOU ORGANIZE YOUR ANSWER
AND
LINK YOUR IDEAS
COHERENCE AND COHESION
HOW YOU ORGANIZE YOUR ANSWER
AND
LINK YOUR IDEAS
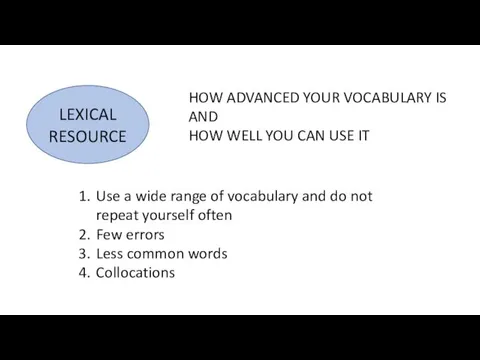
LEXICAL RESOURCE
HOW ADVANCED YOUR VOCABULARY IS
AND
HOW WELL YOU CAN
LEXICAL RESOURCE
HOW ADVANCED YOUR VOCABULARY IS
AND
HOW WELL YOU CAN
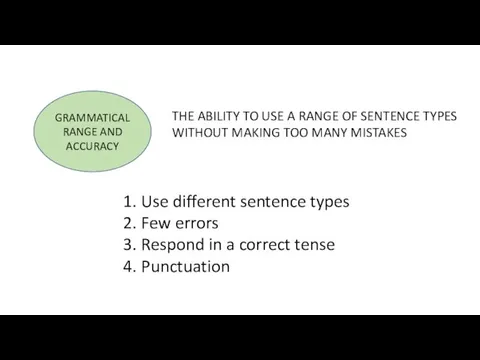
GRAMMATICAL RANGE AND ACCURACY
THE ABILITY TO USE A RANGE OF SENTENCE
GRAMMATICAL RANGE AND ACCURACY
THE ABILITY TO USE A RANGE OF SENTENCE

QUESTIONS TO ASK YOURSELF
WHAT IS THE KEY DATA?
(Axes/ columns and
QUESTIONS TO ASK YOURSELF
WHAT IS THE KEY DATA?
(Axes/ columns and
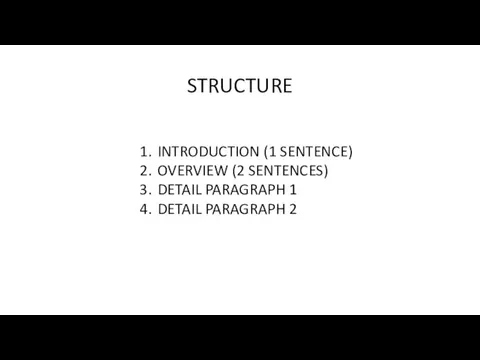
STRUCTURE
INTRODUCTION (1 SENTENCE)
OVERVIEW (2 SENTENCES)
DETAIL PARAGRAPH 1
DETAIL PARAGRAPH 2
STRUCTURE
INTRODUCTION (1 SENTENCE)
OVERVIEW (2 SENTENCES)
DETAIL PARAGRAPH 1
DETAIL PARAGRAPH 2

STRUCTURE
INTRODUCTION
PARAPHRASE YOUR QUESTION (REWRITE THE QUESTION IN YOUR OWN WORDS)
STRUCTURE
INTRODUCTION
PARAPHRASE YOUR QUESTION (REWRITE THE QUESTION IN YOUR OWN WORDS)
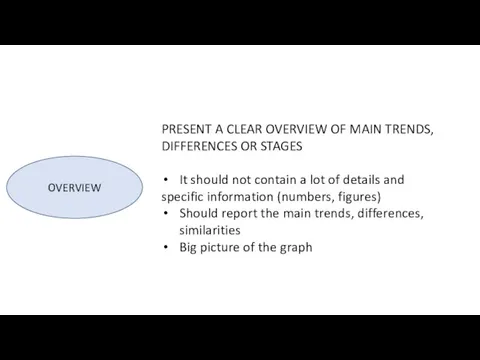
OVERVIEW
PRESENT A CLEAR OVERVIEW OF MAIN TRENDS,
DIFFERENCES OR STAGES
It
OVERVIEW
PRESENT A CLEAR OVERVIEW OF MAIN TRENDS,
DIFFERENCES OR STAGES
It
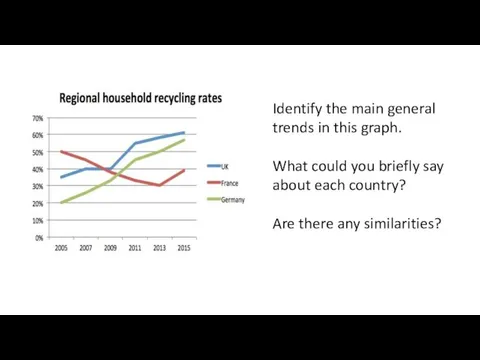
Identify the main general trends in this graph.
What could you
Identify the main general trends in this graph.
What could you
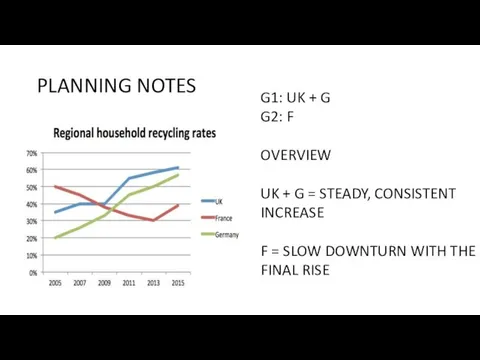
PLANNING NOTES
G1: UK + G
G2: F
OVERVIEW
UK + G = STEADY, CONSISTENT
PLANNING NOTES
G1: UK + G
G2: F
OVERVIEW
UK + G = STEADY, CONSISTENT
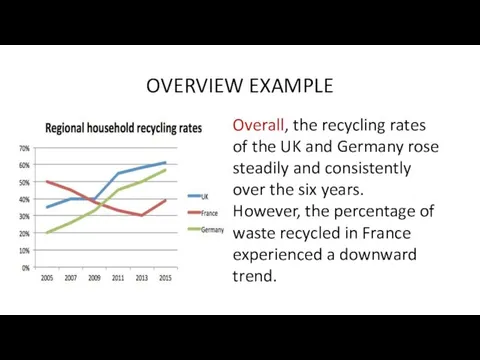
OVERVIEW EXAMPLE
Overall, the recycling rates of the UK and Germany
OVERVIEW EXAMPLE
Overall, the recycling rates of the UK and Germany
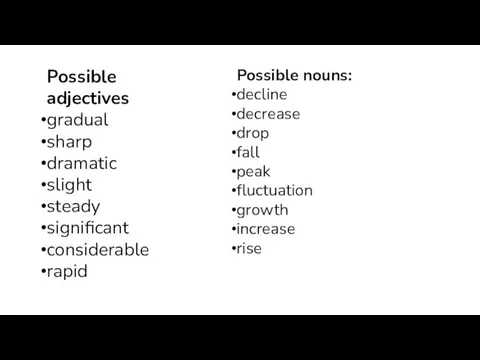
Possible adjectives
gradual
sharp
dramatic
slight
steady
significant
considerable
rapid
Possible nouns:
decline
decrease
drop
fall
peak
fluctuation
growth
increase
rise
Possible adjectives
gradual
sharp
dramatic
slight
steady
significant
considerable
rapid
Possible nouns:
decline
decrease
drop
fall
peak
fluctuation
growth
increase
rise

 Русско-японская война 1904-1905 года
 Амфотерные оксиды и гидроксиды
 тест Мир звезд
 Царство растения
 Пассажирские перевозки. Организация перевозок пассажиров на пригородных автобусных маршрутах. Тема 6. Лекция 1
 Тренажёр-тест по английскому языку
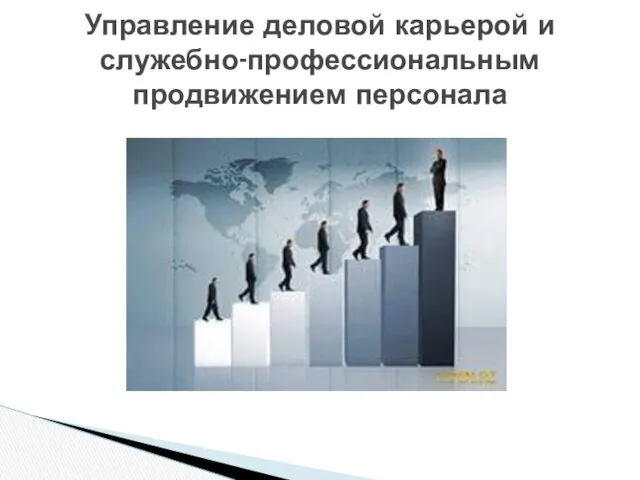 Управление деловой карьерой и служебно-профессиональным продвижением персонала
 Основные аспекты экскурсионной деятельности в школьном музее
 Дифференциальная диагностика менингиального синдрома
 С днем медика
 Георг Симон Ом
 Анализ мониторинга интегративных качеств дошкольников
 Lecture 2. Employment Procedure. Employment Contract. Categories of employees
 Solution methods for bilevel optimization
 Стандартизация. Нормативно-правовая база стандартизации
 Строение атома
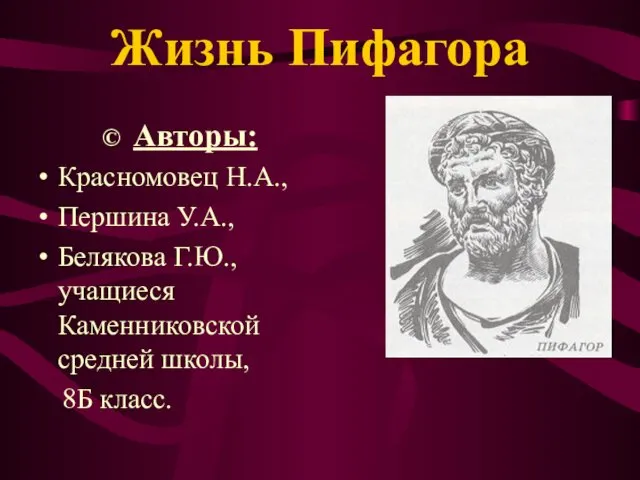 Жизнь Пифагора
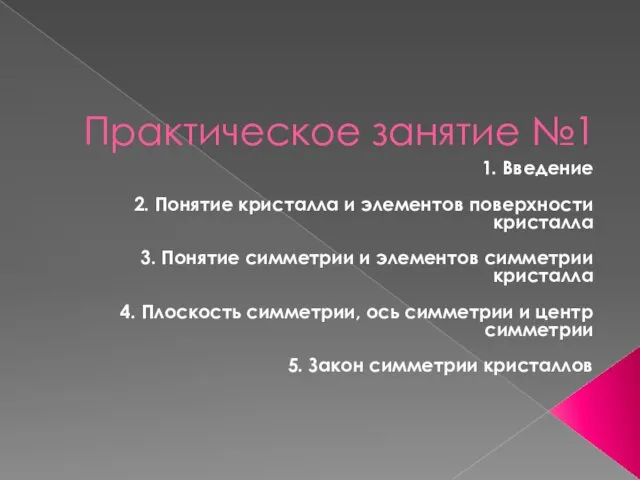 Введение. Кристаллография
 Расчет оборудования для подготовки формовочных материалов и приготовления смесей
 Основные этапы работы над сочинением на ЕГЭ по русскому языку
 Мечети мира
 С днём матери
 Почему у кошек бывают разные глаза
 В царстве грибов
 Санкт-Петербург – вторая столица России
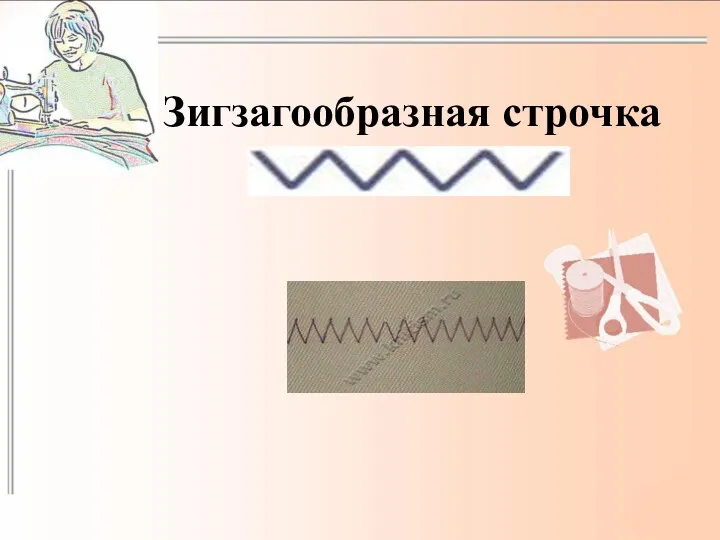 Зигзагообразная строчка
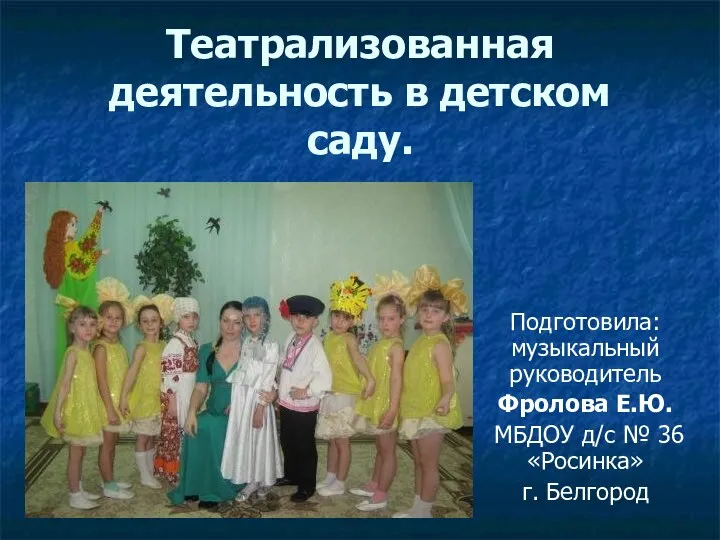 Презентация Театрализованная деятельность в детском саду в подготовительной группе
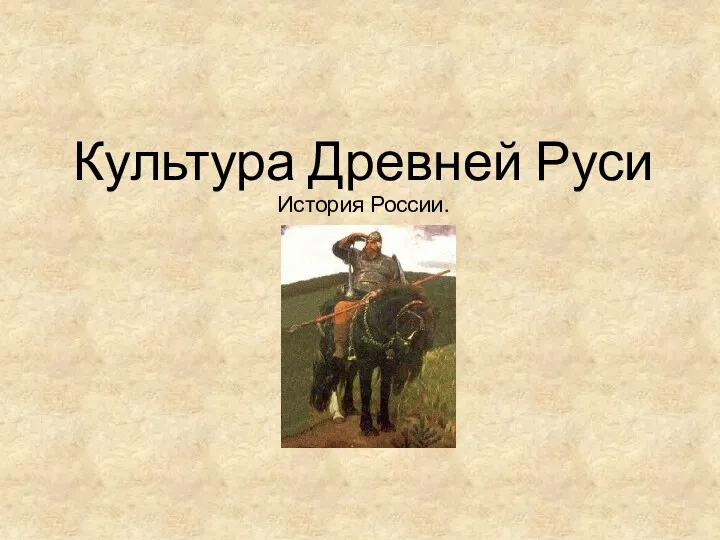 Культура Древней Руси. История России