- Introduction to backtesting: case of naïve 1/N strategy. Seminar 3

Содержание
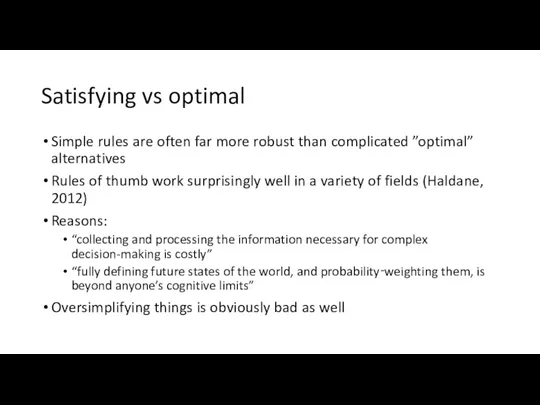
- 2. Satisfying vs optimal Simple rules are often far more robust than complicated ”optimal” alternatives Rules of
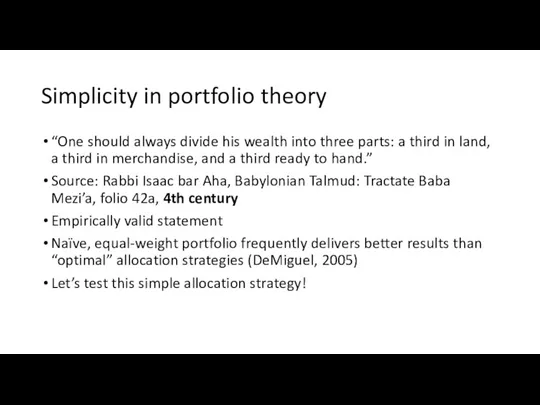
- 3. Simplicity in portfolio theory “One should always divide his wealth into three parts: a third in
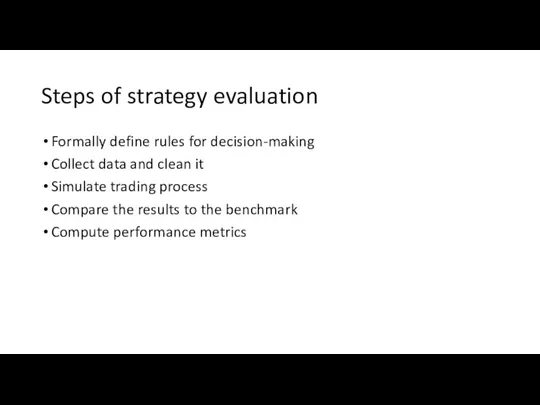
- 4. Steps of strategy evaluation Formally define rules for decision-making Collect data and clean it Simulate trading
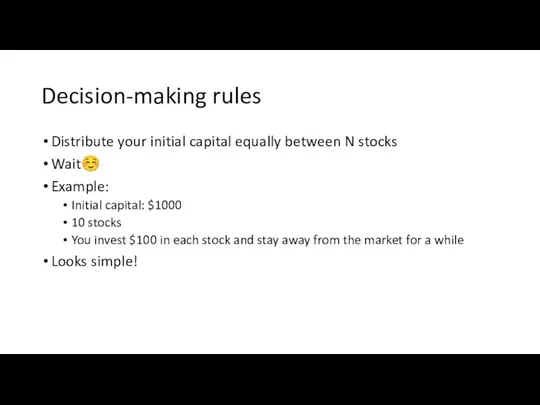
- 5. Decision-making rules Distribute your initial capital equally between N stocks Wait☺ Example: Initial capital: $1000 10
- 6. Not so simple in fact How to choose N stocks (assets) to invest in? Infinite possible
- 7. Universe of securities We will look at largest US companies by market capitalization Capitalization = Number
- 8. Data collection We need daily close prices for all Russell 1000 components Yahoo! Finance is one
- 9. Simulate trading process
- 10. Compare result with the benchmark
- 11. Rebalancing Values of the allocations change in time Eventually the portfolio becomes imbalanced Periodic rebalancing is
- 13. Скачать презентацию
Satisfying vs optimal
Simple rules are often far more robust than complicated
Satisfying vs optimal
Simple rules are often far more robust than complicated
Simplicity in portfolio theory
“One should always divide his wealth into three
Simplicity in portfolio theory
“One should always divide his wealth into three
Steps of strategy evaluation
Formally define rules for decision-making
Collect data and clean
Steps of strategy evaluation
Formally define rules for decision-making
Collect data and clean
Decision-making rules
Distribute your initial capital equally between N stocks
Wait☺
Example:
Initial capital: $1000
10
Decision-making rules
Distribute your initial capital equally between N stocks
Wait☺
Example:
Initial capital: $1000
10
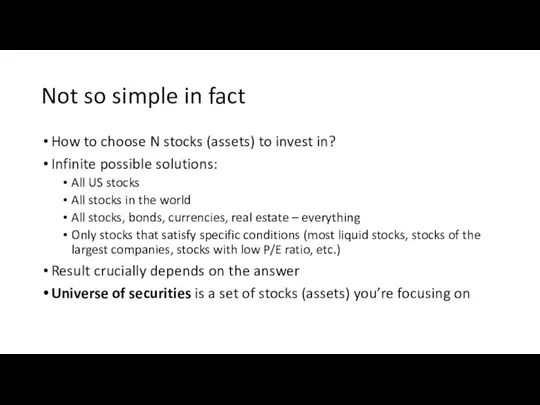
Not so simple in fact
How to choose N stocks (assets) to
Not so simple in fact
How to choose N stocks (assets) to
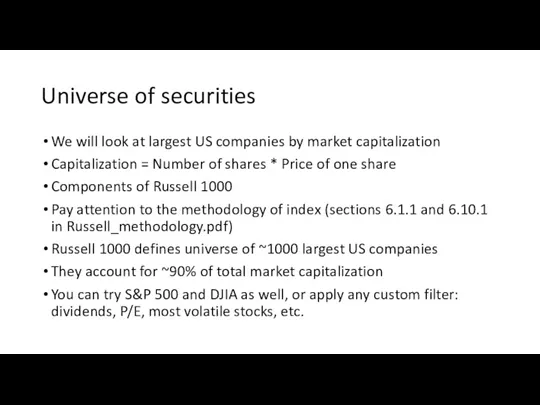
Universe of securities
We will look at largest US companies by market
Universe of securities
We will look at largest US companies by market
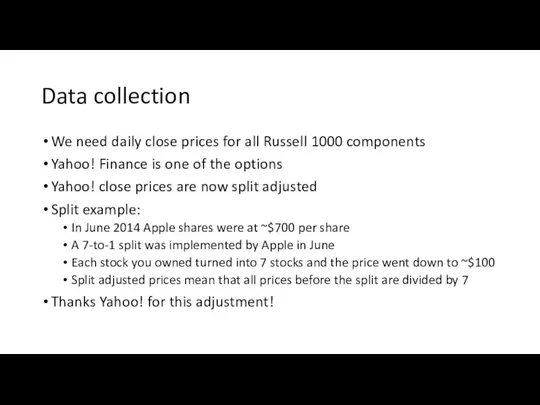
Data collection
We need daily close prices for all Russell 1000 components
Yahoo!
Data collection
We need daily close prices for all Russell 1000 components
Yahoo!
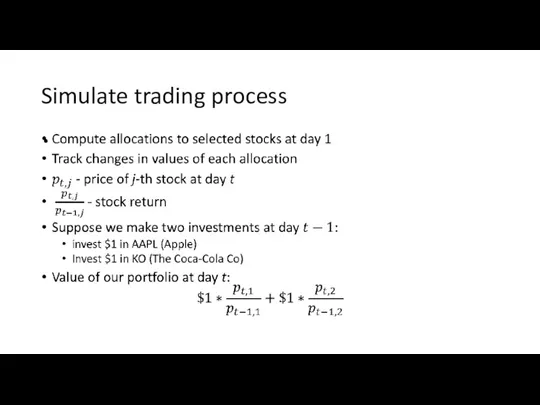
Simulate trading process
Simulate trading process
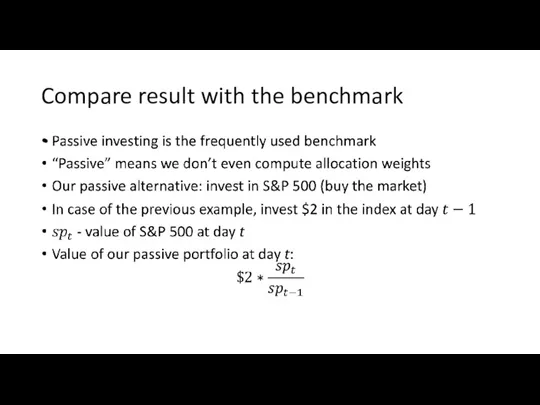
Compare result with the benchmark
Compare result with the benchmark
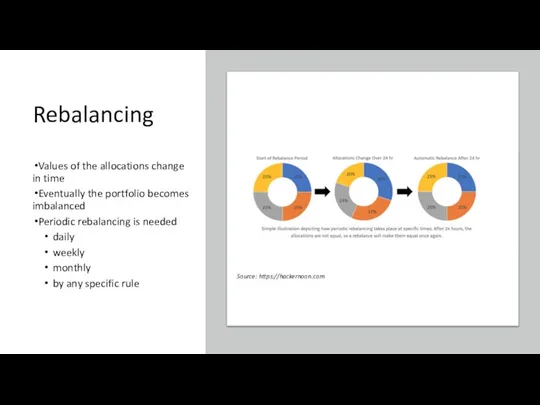
Rebalancing
Values of the allocations change in time
Eventually the portfolio becomes imbalanced
Periodic
Rebalancing
Values of the allocations change in time
Eventually the portfolio becomes imbalanced
Periodic
 ПрезентацияМужские архетипы
 презентация к уроку Основания 8 класс
 Разделы науки о языке
 Новое царство
 Растения в интерьере жилого дома
 Р. Сеф Весёлые стихи, 3класс
 презентация группового занятия по патриотическому воспитанию
 Программа кормления животных ветеринарных врачей на территории дилера ИП Коробов
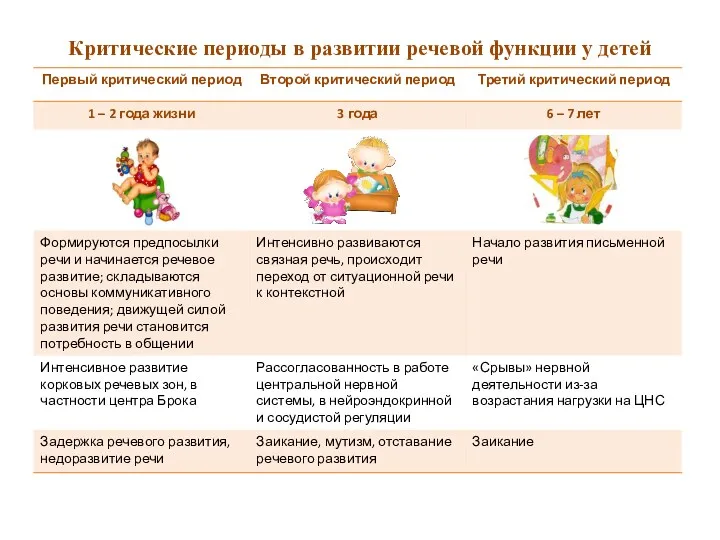 Информация для родителей. Критические периоды в развитии речевой функции у детей.
 Алгоритм сочинения загадок по опорным таблицам
 Презентация по химии для 9 класса по теме: Органические вещества.
 Бойове застосування КЗА 86Ж6. Алгоритми обробки радiолокацiйної iнформацiї, виявлення та захоплення цiлей. (Тема 8.4)
 Презентация к статье Образовательное путешествие. Новые возможности
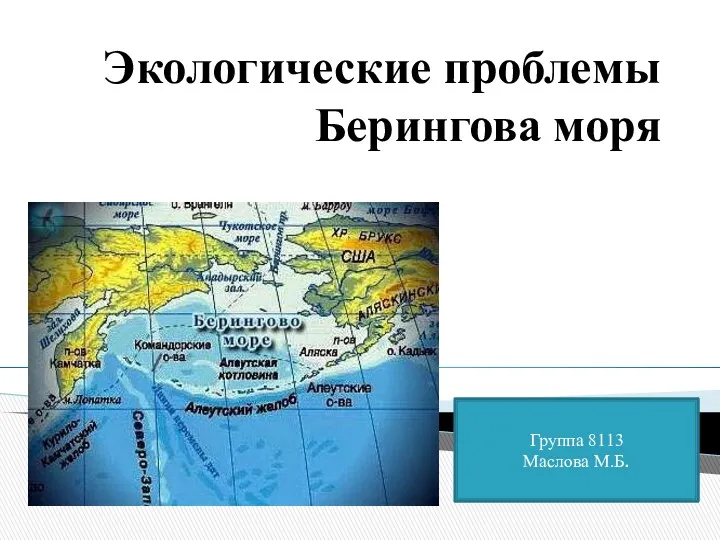 Экологические проблемы Берингова моря
 Портфолио педагога дополнительного образования (Презентация)
 Мастер-класс Народная кукла Кувадка
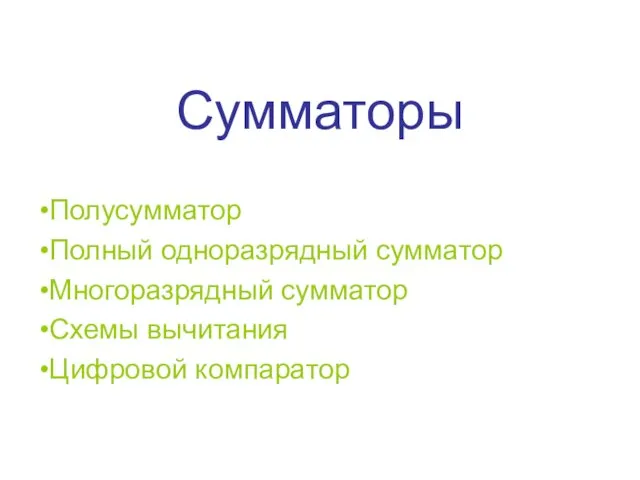 Сумматоры. Виды
 DSM Food Specialties
 Wodospady iguazú - park narodowy Аrgentyny i Вrazylii
 20230916_videoprezentatsiya_k_obobshchayushchemu_uroku_po_prirodovedeniyu_dlya_6_kl
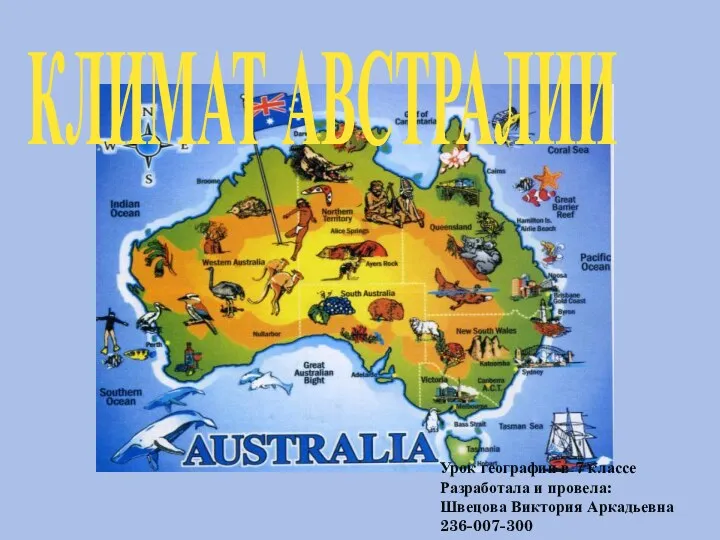 Презентация. Климат Австралии, 7 класс.
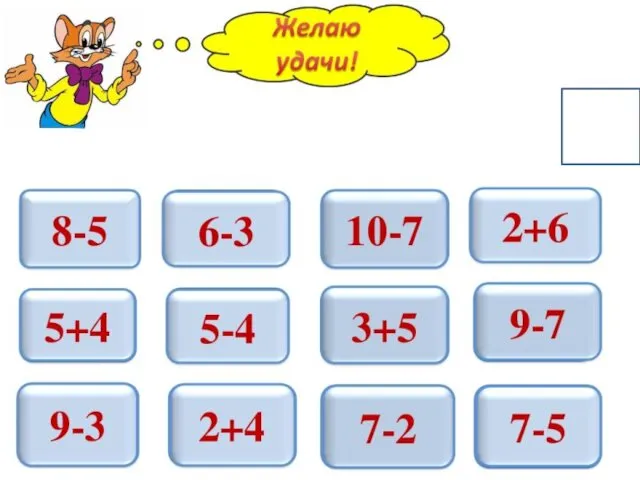 Устный счёт
 Мастер - класс по фелтингу Осенние листья
 Мы - граждане России
 Презентация Весёлый гномик
 Устройство и эксплуатация солнечных батарей
 Поэтапное рисование кошки
 Кузнецкая крепость Диск