- Macroeconomics. GDP. Income. Economic Growth

Содержание
- 2. GDP = is the monetary value of all the finished goods and services produced within a
- 3. Approaches to calculate GDP Expenditure & Income Methods Expenditure Method – count all new goods &
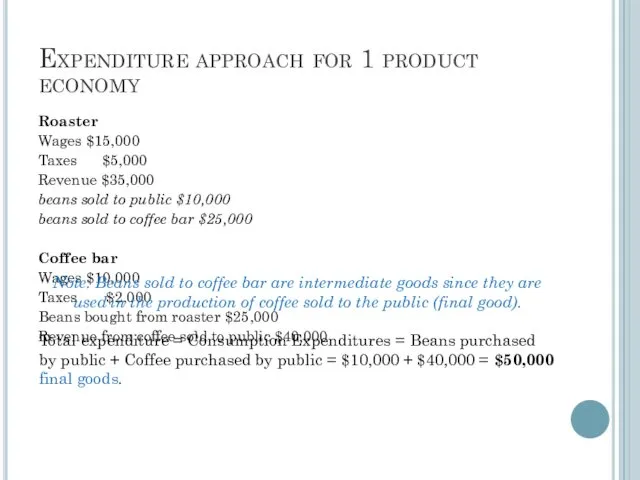
- 12. Expenditure approach for 1 product economy Roaster Wages $15,000 Taxes $5,000 Revenue $35,000 beans sold to
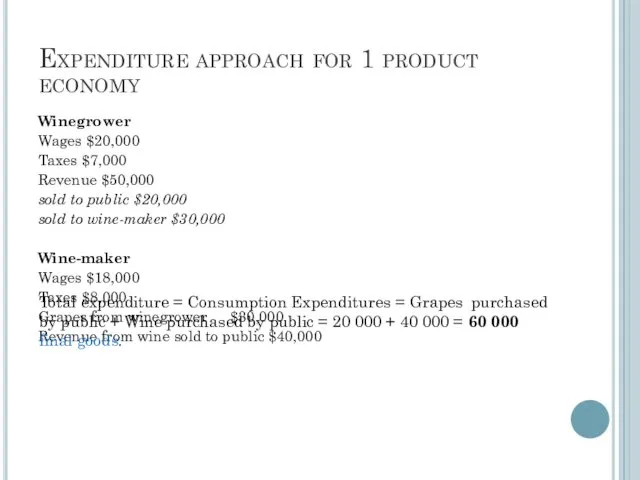
- 13. Expenditure approach for 1 product economy Winegrower Wages $20,000 Taxes $7,000 Revenue $50,000 sold to public
- 14. Product approach GDP is the sum of the value added created in all the sectors of
- 15. Product approach for 1 product economy Roaster Wages $15,000 Taxes $5,000 Revenue $35,000 beans sold to
- 16. Expenditure approach for 1 product economy Winegrower Wages $20,000 Taxes $7,000 Revenue $50,000 sold to public
- 17. Income method Income Method – count all earnings received by those who produce the goods &
- 18. Consumption (C) Investment (I) Government purchases (G) Exports (X) Imports (M) Taxes (T) Saving (S) (I
- 19. Consumption + Investment + Government + Net Export Wages + Profits + Rents + Interest Depreciation
- 20. NFIA = Factor income earned from abroad by residents - Factor income of non-residents in domestic
- 22. Income approach for 1 product economy Roaster Wages $15,000 Taxes $5,000 Revenue $35,000 beans sold to
- 23. Income approach for 1 product economy Winegrower Wages $20,000 Taxes $7,000 Revenue $50,000 sold to public
- 24. GDP – by sum of Spending, Factor Incomes or Output
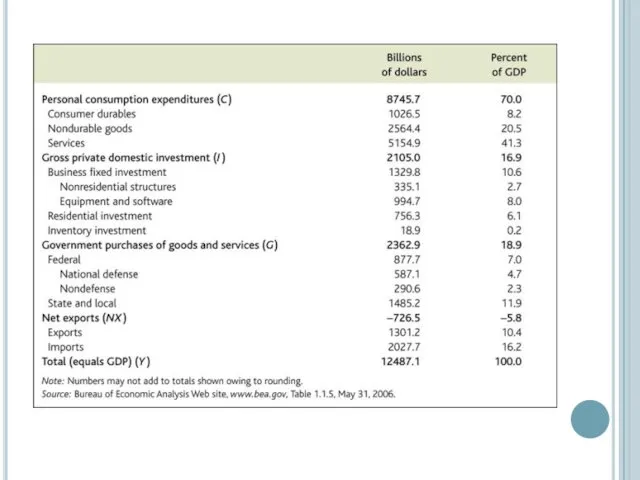
- 25. The first account displays the expenditure and income approaches to measuring GDP. The right-hand side of
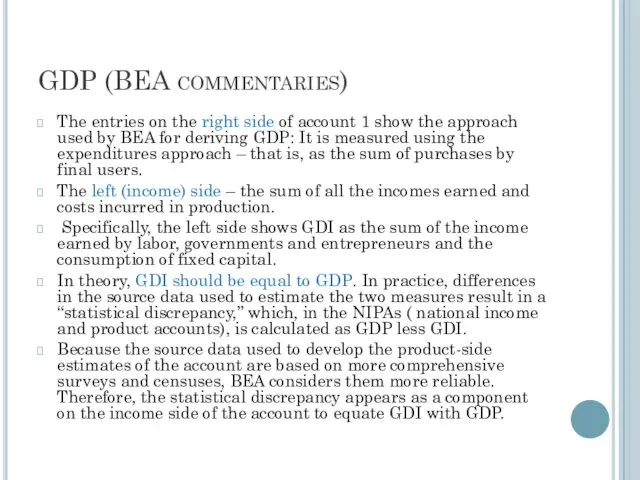
- 26. GDP (BEA commentaries) The entries on the right side of account 1 show the approach used
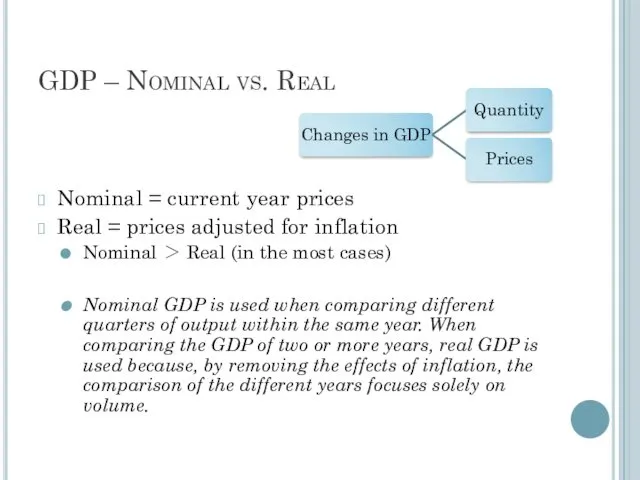
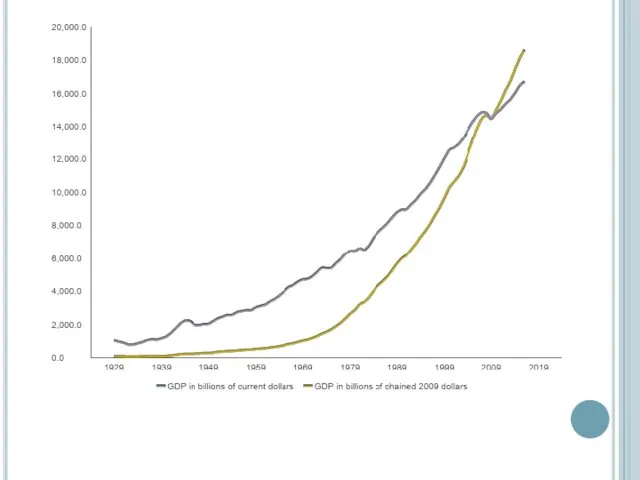
- 28. GDP – Nominal vs. Real Nominal = current year prices Real = prices adjusted for inflation
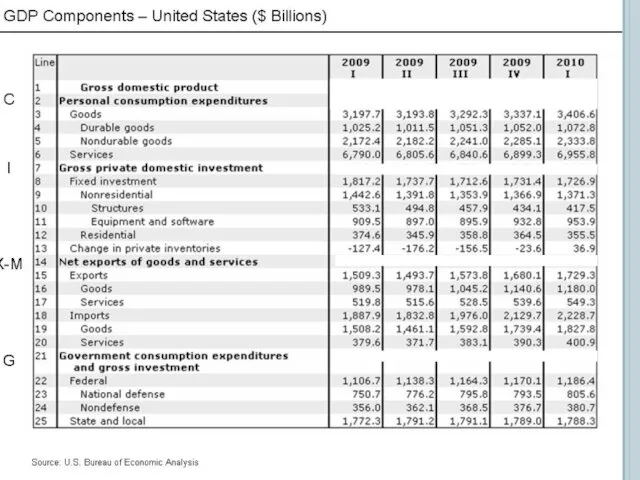
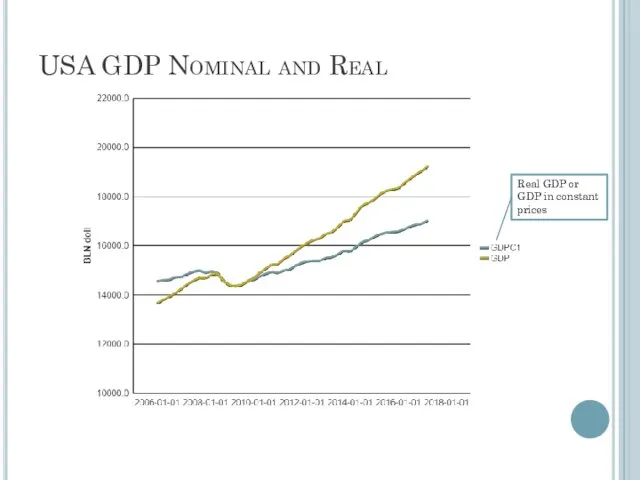
- 29. USA GDP Nominal and Real Real GDP or GDP in constant prices
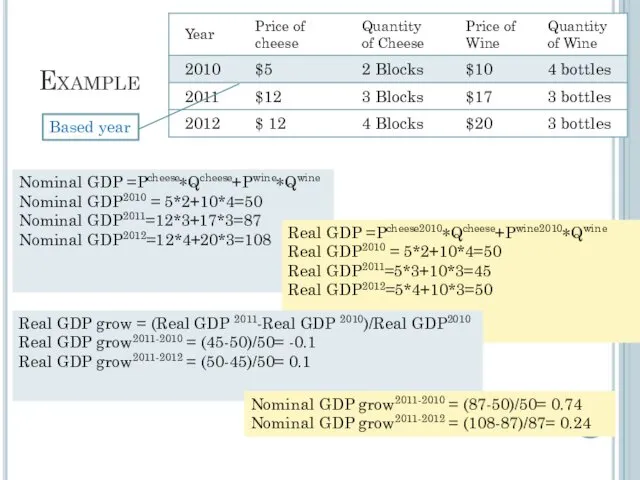
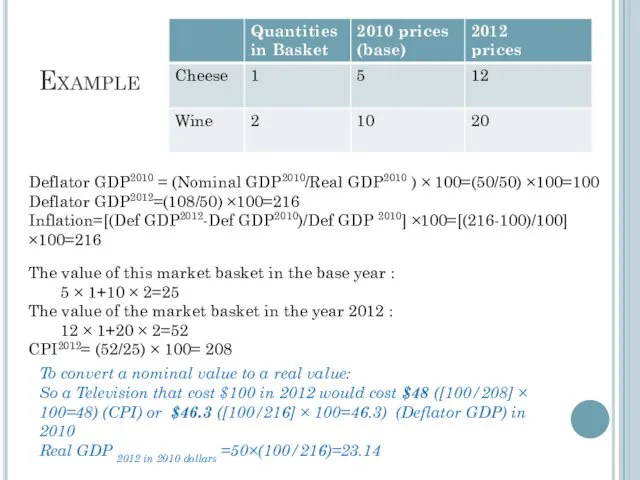
- 31. Example Nominal GDP =Pcheese∗QCheese+Pcheese∗QCheese Nominal GDP =Pcheese∗Qcheese+Pwine∗Qwine Nominal GDP2010 = 5*2+10*4=50 Nominal GDP2011=12*3+17*3=87 Nominal GDP2012=12*4+20*3=108 Real
- 32. where GDPt is the level of activity in the later period; GDP0 is the level of
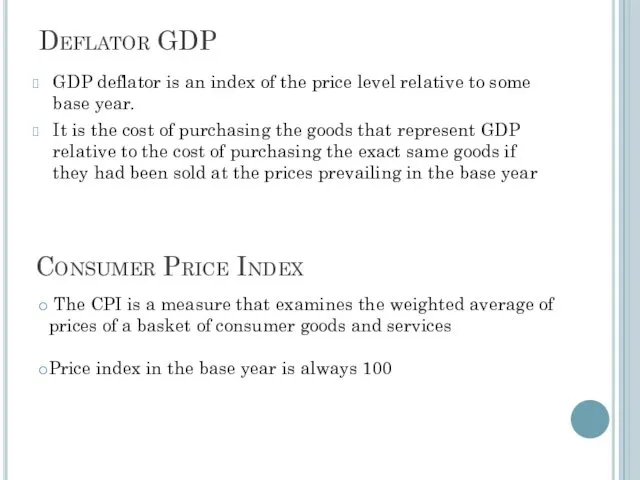
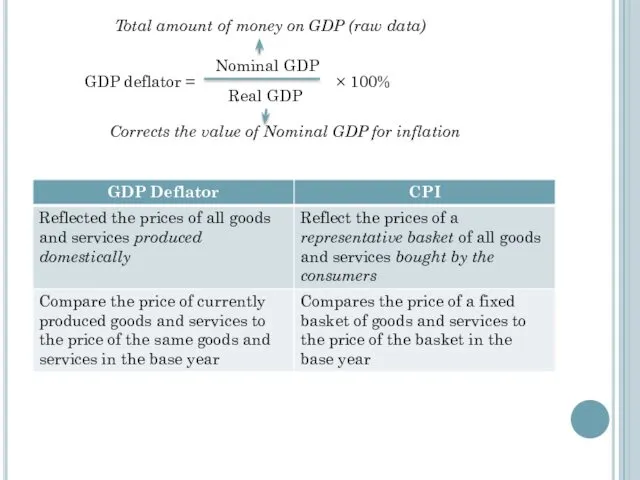
- 33. Deflator GDP GDP deflator is an index of the price level relative to some base year.
- 34. GDP deflator = Nominal GDP Real GDP × 100% Total amount of money on GDP (raw
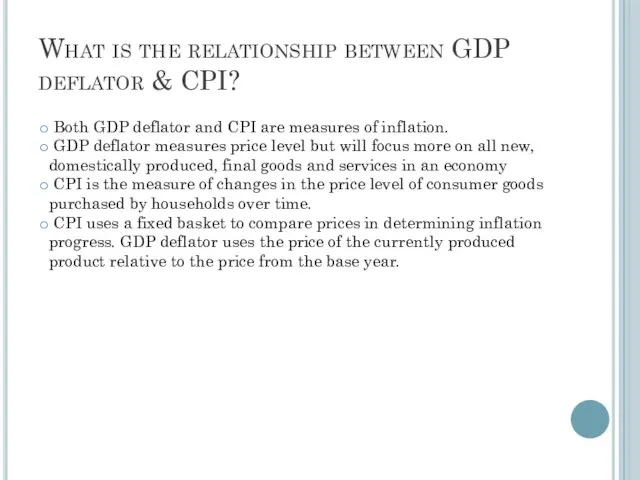
- 35. What is the relationship between GDP deflator & CPI? Both GDP deflator and CPI are measures
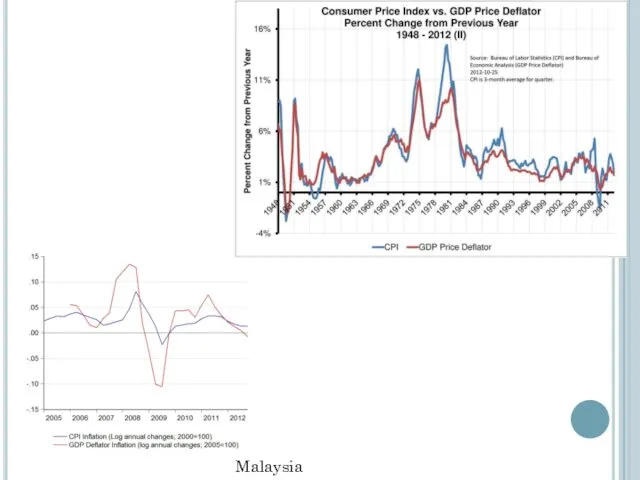
- 36. Malaysia
- 37. Example The value of this market basket in the base year : 5 × 1+10 ×
- 39. Скачать презентацию
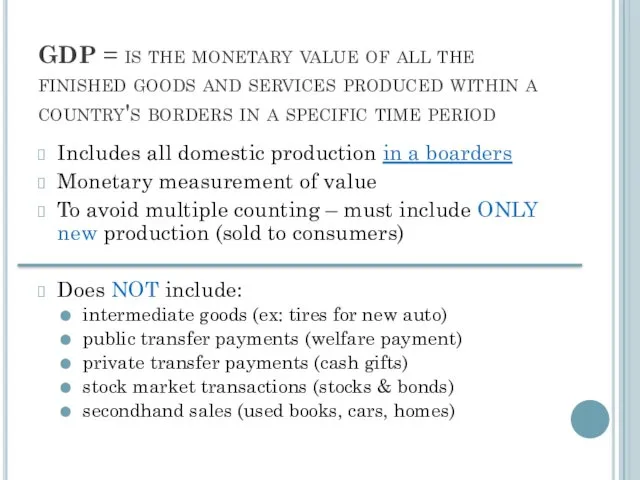
GDP = is the monetary value of all the finished goods
GDP = is the monetary value of all the finished goods
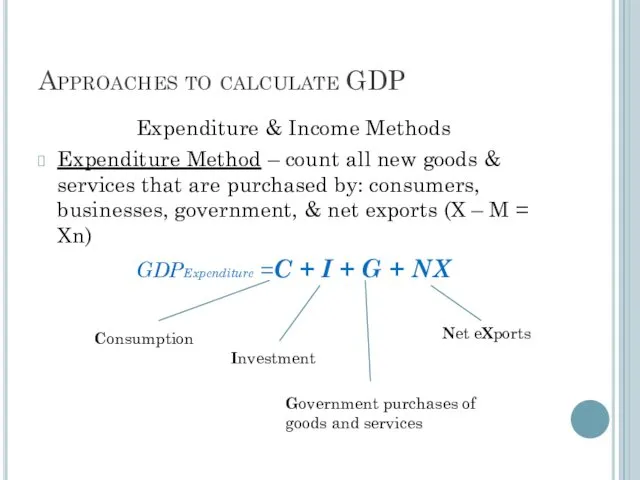
Approaches to calculate GDP
Expenditure & Income Methods
Expenditure Method – count all
Approaches to calculate GDP
Expenditure & Income Methods
Expenditure Method – count all


Expenditure approach for 1 product economy
Roaster
Wages $15,000
Taxes $5,000
Revenue $35,000
beans sold to public
Expenditure approach for 1 product economy
Roaster
Wages $15,000
Taxes $5,000
Revenue $35,000
beans sold to public
Expenditure approach for 1 product economy
Winegrower
Wages $20,000
Taxes $7,000
Revenue $50,000
sold to public
Expenditure approach for 1 product economy
Winegrower
Wages $20,000
Taxes $7,000
Revenue $50,000
sold to public
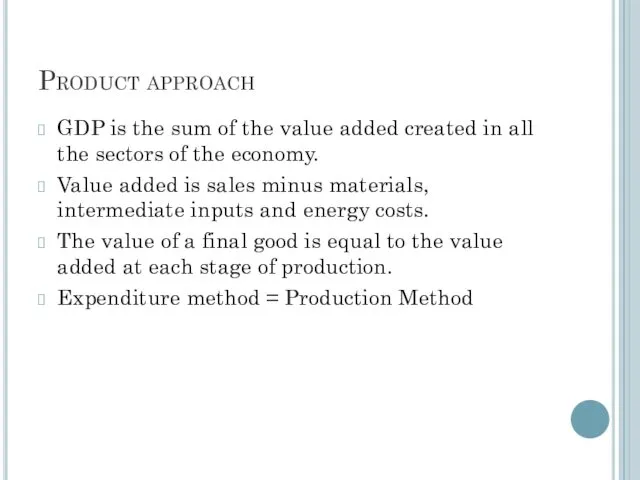
Product approach
GDP is the sum of the value added created in
Product approach
GDP is the sum of the value added created in
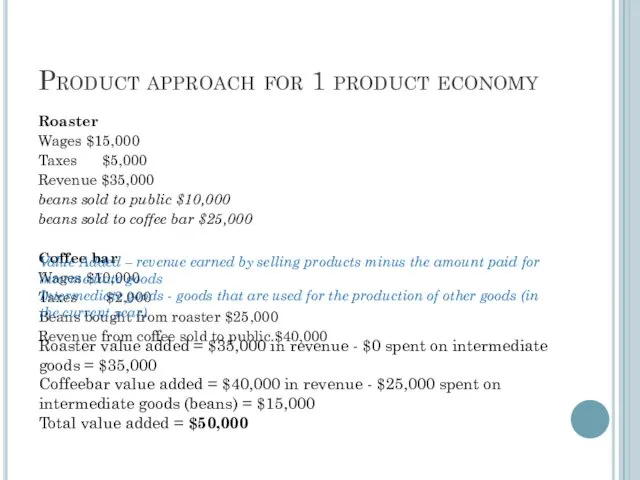
Product approach for 1 product economy
Roaster
Wages $15,000
Taxes $5,000
Revenue $35,000
beans sold to public
Product approach for 1 product economy
Roaster
Wages $15,000
Taxes $5,000
Revenue $35,000
beans sold to public
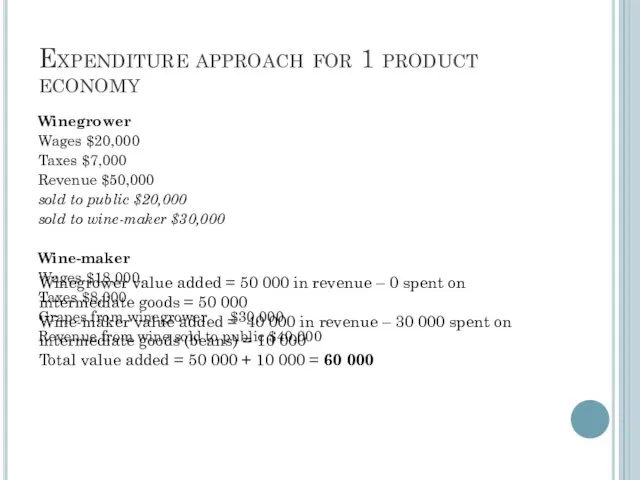
Expenditure approach for 1 product economy
Winegrower
Wages $20,000
Taxes $7,000
Revenue $50,000
sold to public
Expenditure approach for 1 product economy
Winegrower
Wages $20,000
Taxes $7,000
Revenue $50,000
sold to public
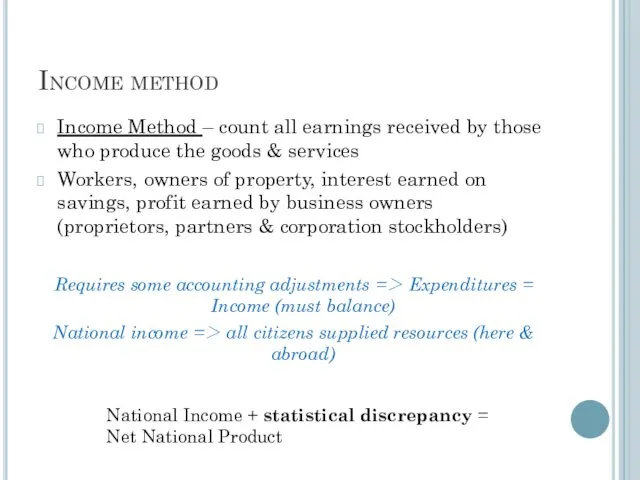
Income method
Income Method – count all earnings received by those who
Income method
Income Method – count all earnings received by those who
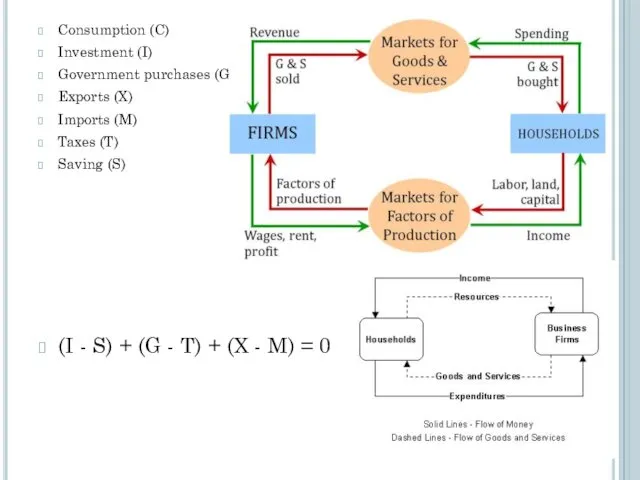
Consumption (C)
Investment (I)
Government purchases (G)
Exports (X)
Imports (M)
Taxes (T)
Saving (S)
(I
Consumption (C)
Investment (I)
Government purchases (G)
Exports (X)
Imports (M)
Taxes (T)
Saving (S)
(I
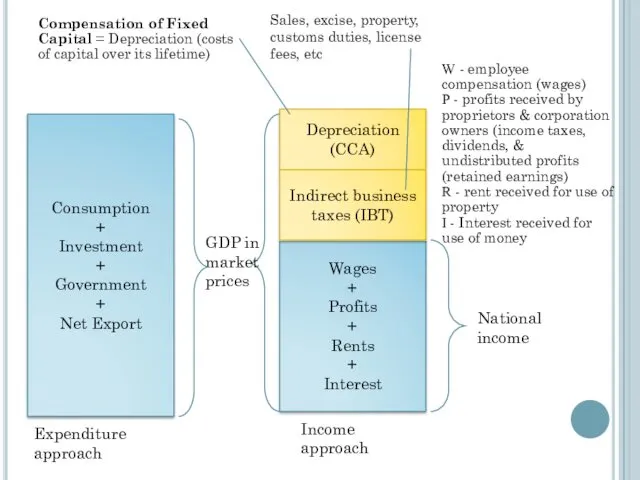
Consumption
+
Investment
+
Government
+
Net Export
Wages
+
Profits
+
Rents
+
Interest
Depreciation (CCA)
Indirect business taxes (IBT)
GDP in market prices
National income
Expenditure approach
Income
Consumption
+
Investment
+
Government
+
Net Export
Wages
+
Profits
+
Rents
+
Interest
Depreciation (CCA)
Indirect business taxes (IBT)
GDP in market prices
National income
Expenditure approach
Income
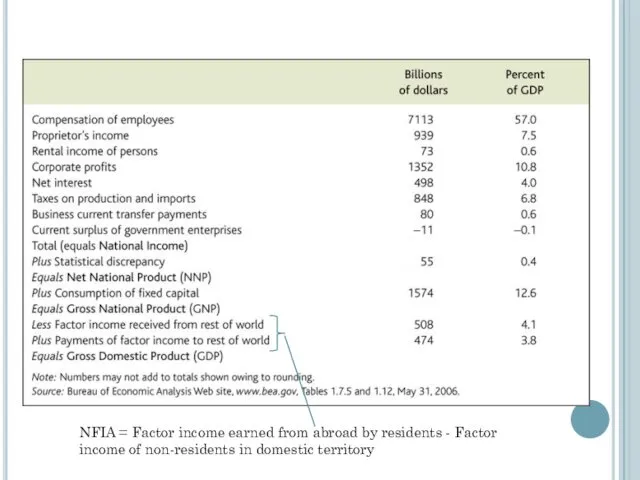
NFIA = Factor income earned from abroad by residents - Factor
NFIA = Factor income earned from abroad by residents - Factor
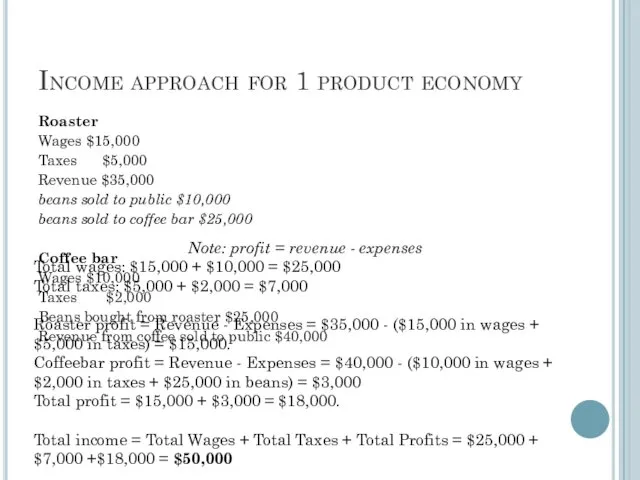
Income approach for 1 product economy
Roaster
Wages $15,000
Taxes $5,000
Revenue $35,000
beans sold to public
Income approach for 1 product economy
Roaster
Wages $15,000
Taxes $5,000
Revenue $35,000
beans sold to public
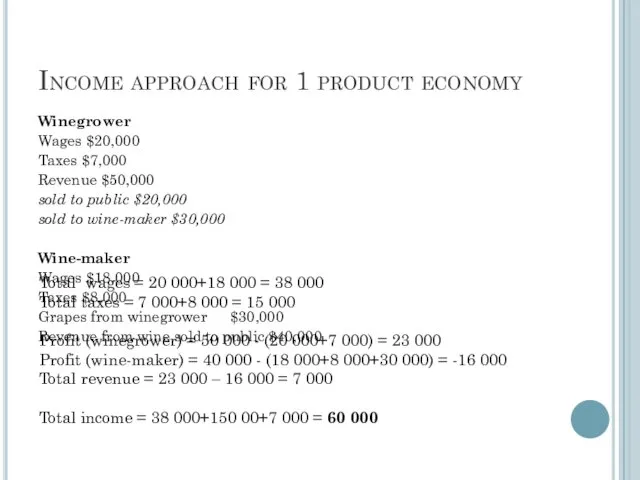
Income approach for 1 product economy
Winegrower
Wages $20,000
Taxes $7,000
Revenue $50,000
sold to public
Income approach for 1 product economy
Winegrower
Wages $20,000
Taxes $7,000
Revenue $50,000
sold to public
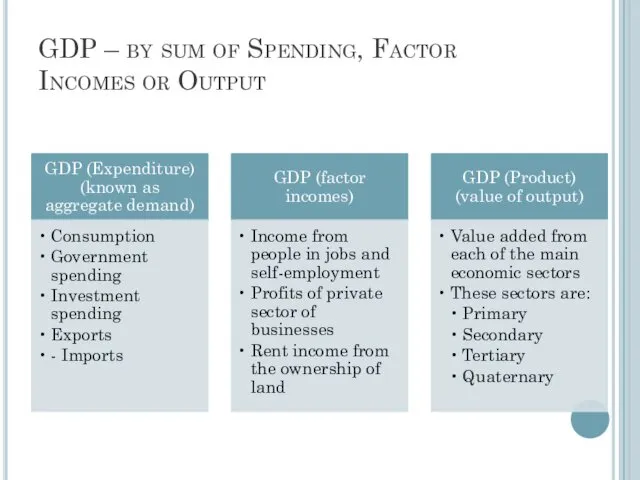
GDP – by sum of Spending, Factor Incomes or Output
GDP – by sum of Spending, Factor Incomes or Output
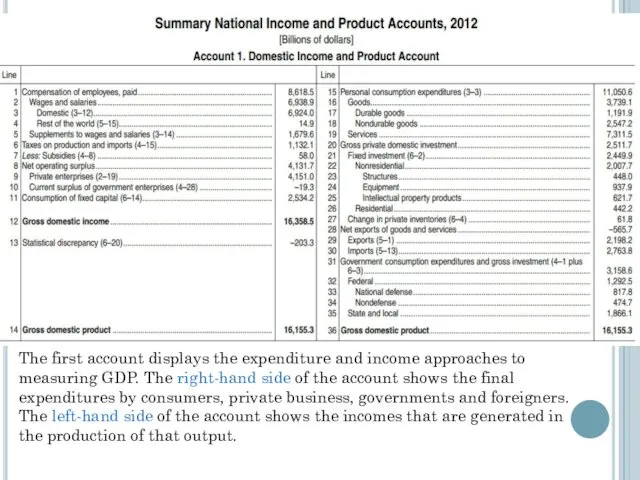
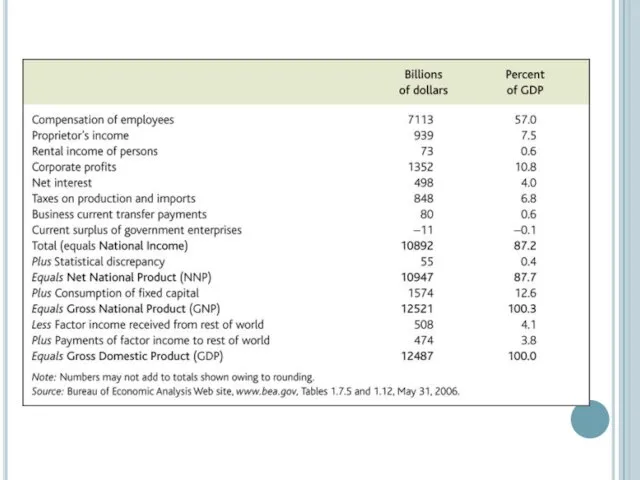
The first account displays the expenditure and income approaches to measuring
The first account displays the expenditure and income approaches to measuring
GDP (BEA commentaries)
The entries on the right side of account 1
GDP (BEA commentaries)
The entries on the right side of account 1
GDP – Nominal vs. Real
Nominal = current year prices
Real = prices
GDP – Nominal vs. Real
Nominal = current year prices
Real = prices
USA GDP Nominal and Real
Real GDP or
GDP in constant prices
USA GDP Nominal and Real
Real GDP or
GDP in constant prices
Example
Nominal GDP =Pcheese∗QCheese+Pcheese∗QCheese
Nominal GDP =Pcheese∗Qcheese+Pwine∗Qwine
Nominal GDP2010 = 5*2+10*4=50
Nominal GDP2011=12*3+17*3=87
Nominal GDP2012=12*4+20*3=108
Real
Example
Nominal GDP =Pcheese∗QCheese+Pcheese∗QCheese
Nominal GDP =Pcheese∗Qcheese+Pwine∗Qwine
Nominal GDP2010 = 5*2+10*4=50
Nominal GDP2011=12*3+17*3=87
Nominal GDP2012=12*4+20*3=108
Real
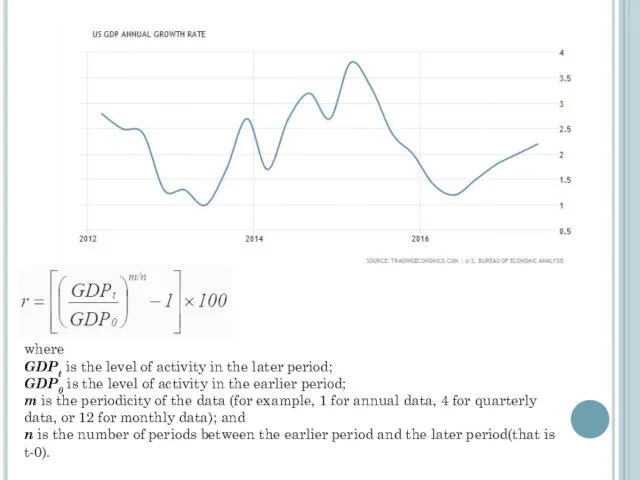
where
GDPt is the level of activity in the later period;
GDP0 is the level
where
GDPt is the level of activity in the later period;
GDP0 is the level
Deflator GDP
GDP deflator is an index of the price level relative
Deflator GDP
GDP deflator is an index of the price level relative
GDP deflator =
Nominal GDP
Real GDP
× 100%
Total amount of money on GDP
GDP deflator =
Nominal GDP
Real GDP
× 100%
Total amount of money on GDP
What is the relationship between GDP deflator & CPI?
Both GDP
What is the relationship between GDP deflator & CPI?
Both GDP
Malaysia
Malaysia
Example
The value of this market basket in the base year :
5
Example
The value of this market basket in the base year :
5
 Решение экономических задач. Семейный бюджет
 Место и роль эконометрики в экономической науке и практике
 Світовий ринок товарів та послуг
 Продовольственная безопасность
 Нетарифные барьеры. Экспортные субсидии. Свободная торговля. Всемирная торговая организация (ВТО). Россия и ВТО
 Организация деятельности центрального банка Российской Федерации в 1945-1990 годы. (Лекция 5)
 Economic growth
 Теория производства
 Медициналық қызметтер нарығындағы бәсекелестің типтері
 Национальная экономика, содержание, структура и измерение параметров
 Результаты и эффективность деятельности предприятия
 Система планирования деятельности предприятия
 Руководство Фраскати
 Промышленная политика Республики Корея
 Глобализация мировой экономики и её последствия
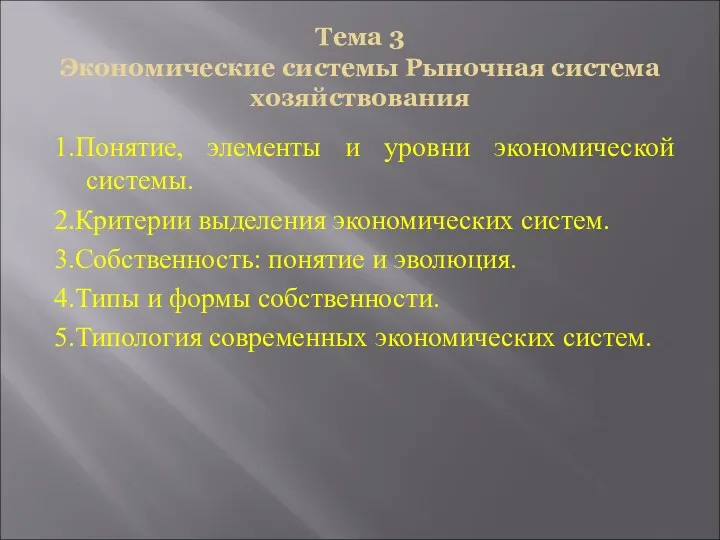 Экономические системы. Рыночная система хозяйствования
 Предпринимательский всеобуч
 Контрольный тест. 7 класс
 Исследовательский проект Разумная экономия энергии
 Государственные расходы и налоги. Деньги и их функции. (Тема 11)
 Экономический анализ как наука
 Экономика общественного сектора
 Бәсеке. Бәсекенің түрлері
 Трудовые ресурсы предприятия: основные понятия, структура, показатели
 Рынки факторов производства и формирование факторных доходов. (Тема 7)
 Налоговая система
 Инвестиционно-инновационная активность (привлекательнось) региона РФ. Астраханская область
 Нарушения макроэкономического равновесия: инфляция и безработица. (Тема 3)