- Measurement of Economic Performance

Содержание
- 2. Gross Domestic Product
- 3. Measuring a Nation’s Income Microeconomics – the study of how individual households and firms make decisions
- 4. Measuring a Nation’s Income Macroeconomics answers questions like the following: Why is average income high in
- 5. The Economy’s Income and Expenditure When judging whether the economy is doing well or poorly, it
- 6. The Measurement of Gross Domestic Product Gross Domestic Product (GDP) – a measure of the income
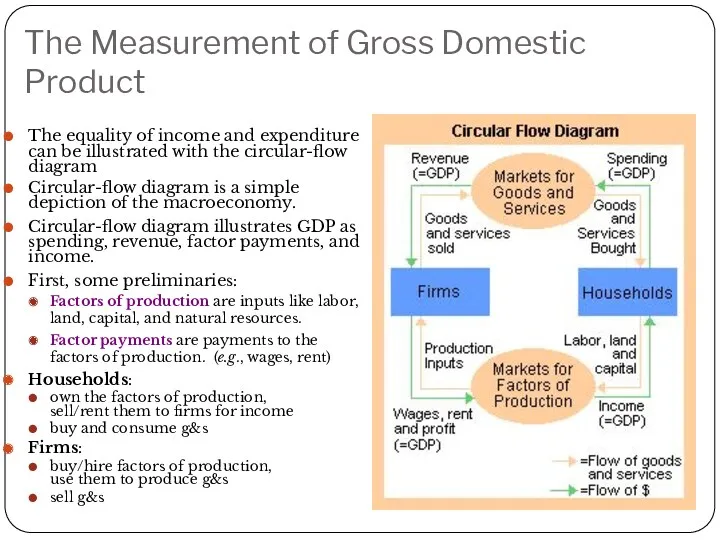
- 7. The Measurement of Gross Domestic Product The equality of income and expenditure can be illustrated with
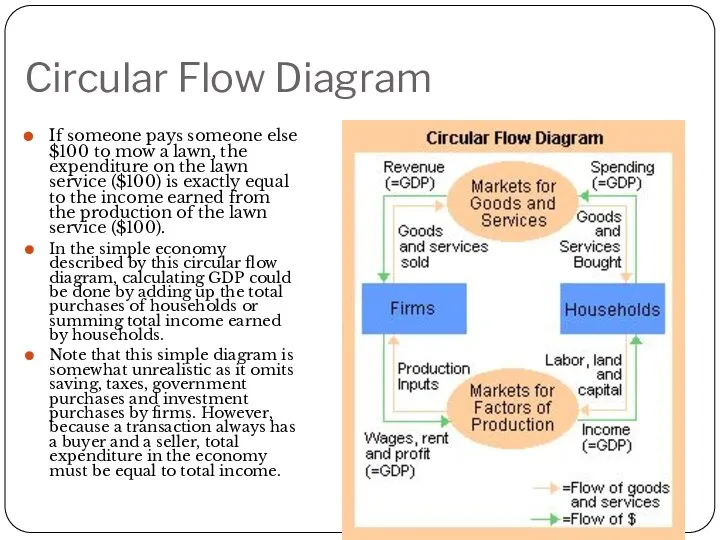
- 8. Circular Flow Diagram If someone pays someone else $100 to mow a lawn, the expenditure on
- 9. Circular Flow - Leakages Leakage is the non-consumption uses of income, including saving, taxes, and imports.
- 10. The Measurement of Gross Domestic Product Definition: GDP is the market value of all final goods
- 11. The Measurement of Gross Domestic Product “Of All Final …” It records only the value of
- 12. The Measurement of Gross Domestic Product “Goods and Services…” It includes both tangible goods (food, clothing,
- 13. The Measurement of Gross Domestic Product “In a Given Period of Time…” It measures the value
- 14. What is not Counted in GDP? GDP includes all items produced in the economy and sold
- 15. The Components of GDP GDP (Y) is the sum of the following: Consumption (C) Investment (I)
- 16. The Components of GDP Consumption (C) The spending by households on goods and services, with the
- 17. The Components of GDP Government Purchases (G) The spending on goods and services by local, state,
- 18. U.S. GDP and Its Components, 2005
- 19. A C T I V E L E A R N I N G 1: GDP
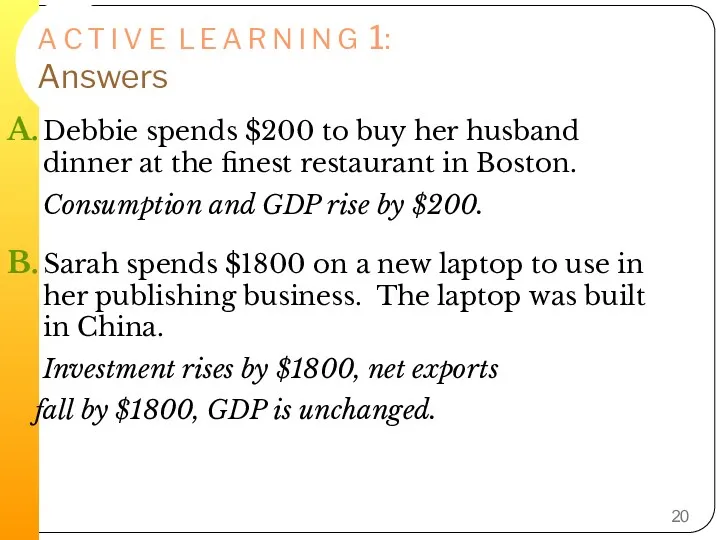
- 20. A C T I V E L E A R N I N G 1: Answers
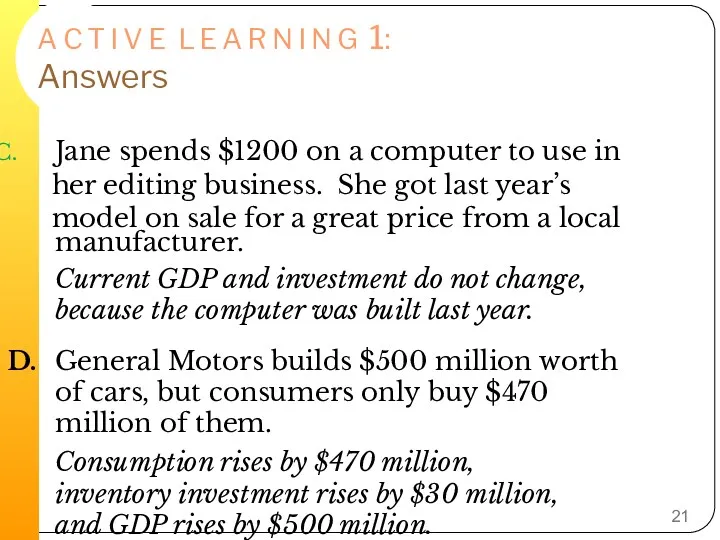
- 21. A C T I V E L E A R N I N G 1: Answers
- 22. Real versus nominal GDP Nominal GDP – values the production of goods and services at current
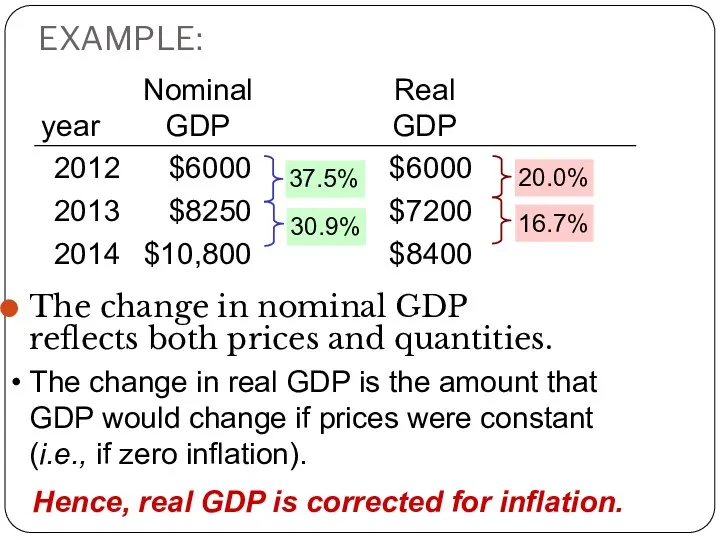
- 23. EXAMPLE: Compute nominal GDP in each year: 2012: $10 x 400 + $2 x 1000 =$6,000
- 24. EXAMPLE: Compute real GDP in each year, using 2012 as the base year: Increase: 2012: $10
- 25. EXAMPLE: In each year, nominal GDP is measured using the (then) current prices. real GDP is
- 26. EXAMPLE: The change in nominal GDP reflects both prices and quantities. The change in real GDP
- 27. Nominal and Real GDP in the U.S., 1965-2005 Real GDP (base year 2000) Nominal GDP
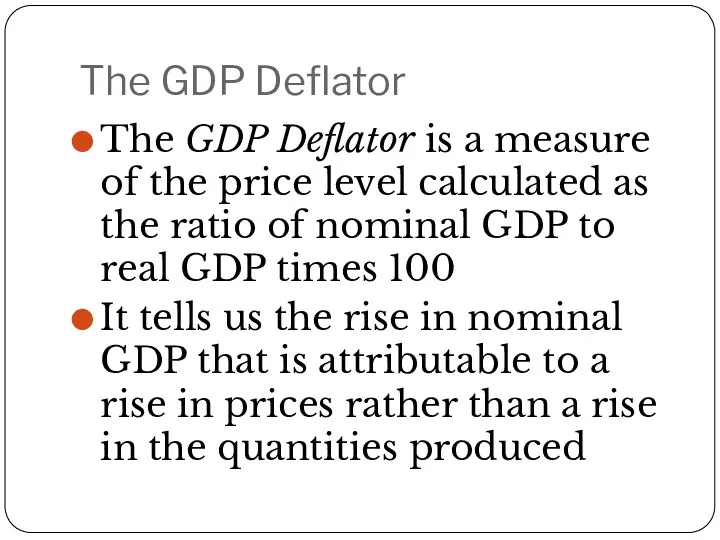
- 28. The GDP Deflator The GDP Deflator is a measure of the price level calculated as the
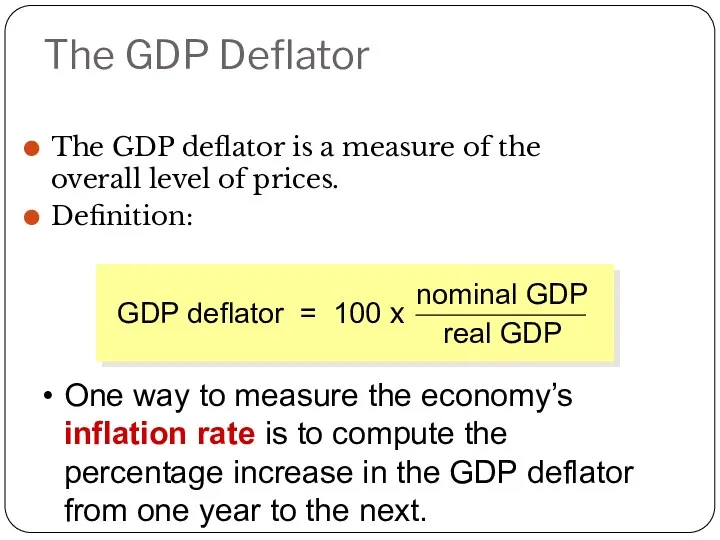
- 29. The GDP Deflator The GDP deflator is a measure of the overall level of prices. Definition:
- 30. EXAMPLE: Compute the GDP deflator in each year:
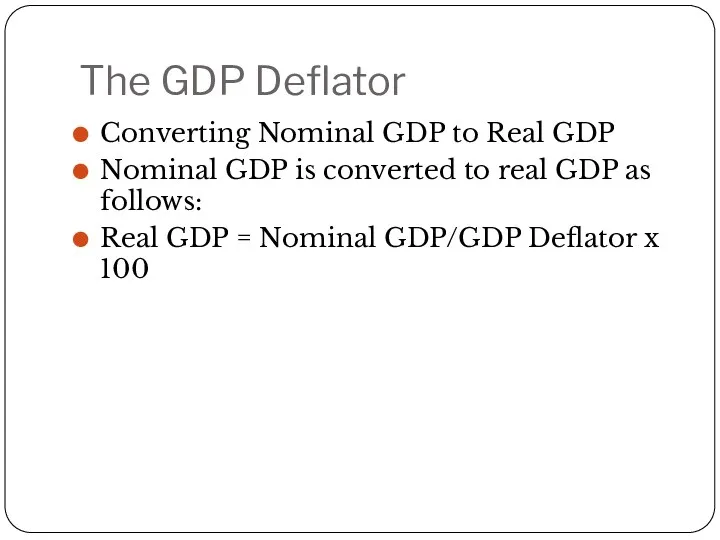
- 31. The GDP Deflator Converting Nominal GDP to Real GDP Nominal GDP is converted to real GDP
- 32. A C T I V E L E A R N I N G 2: Computing
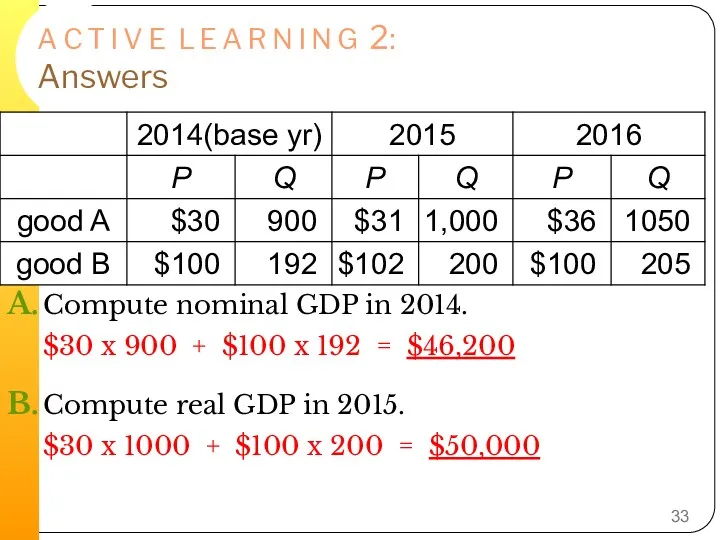
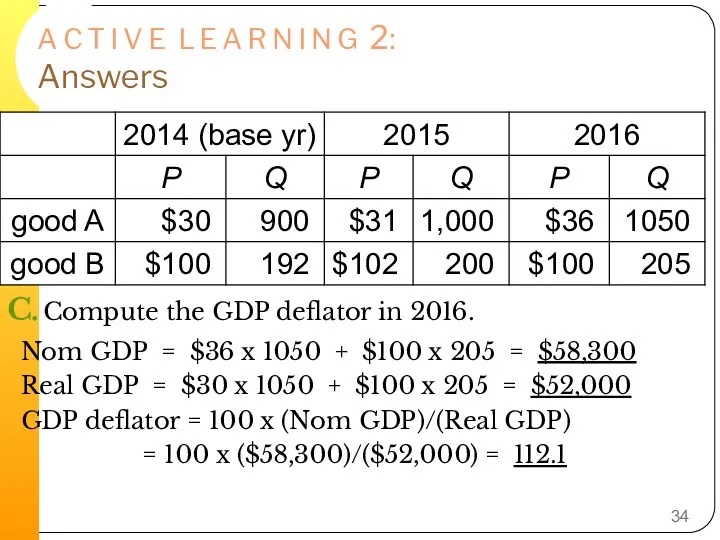
- 33. A C T I V E L E A R N I N G 2: Answers
- 34. A C T I V E L E A R N I N G 2: Answers
- 35. GDP and Economic Well-being GDP is the best single measure of the economic well-being of a
- 36. GDP and Economic Well-Being Some things that contribute to well-being are not included in GDP The
- 37. GDP and Economic Well-Being It does not allow for the health of our children, the quality
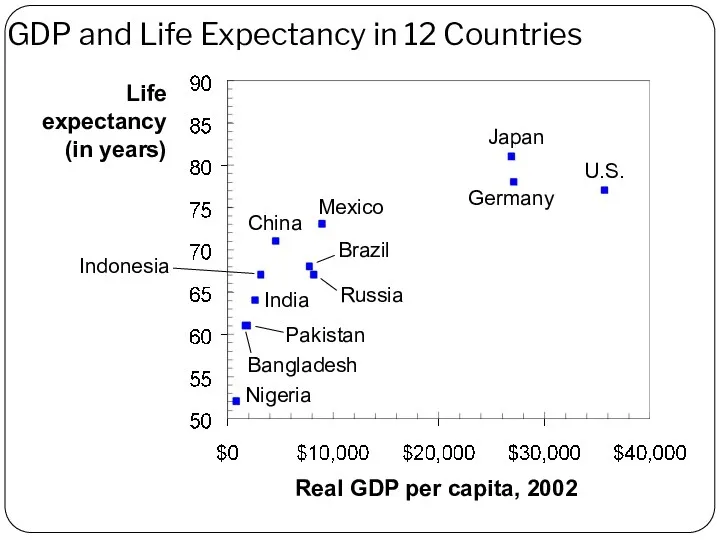
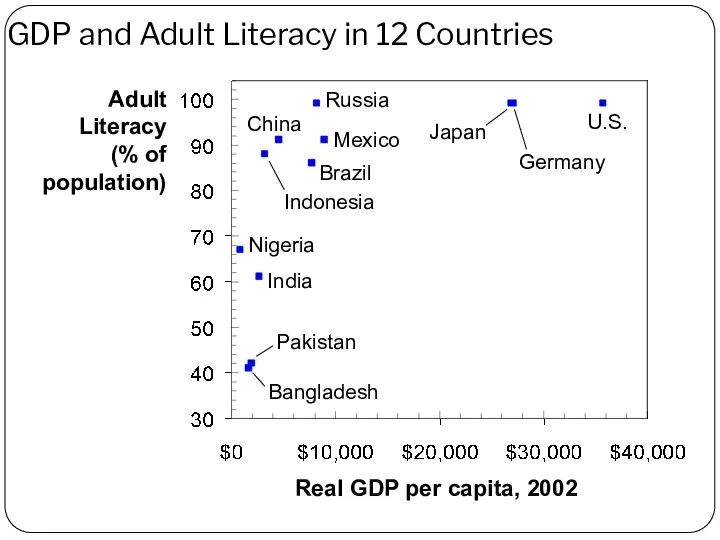
- 38. Then Why Do We Care About GDP? Having a large GDP enables a country to afford
- 39. GDP and Life Expectancy in 12 Countries Life expectancy (in years) Real GDP per capita, 2002
- 40. GDP and Adult Literacy in 12 Countries Adult Literacy (% of population) Real GDP per capita,
- 41. Gross National Product (GNP) GNP is the total income earned by a nation’s permanent residents. Differs
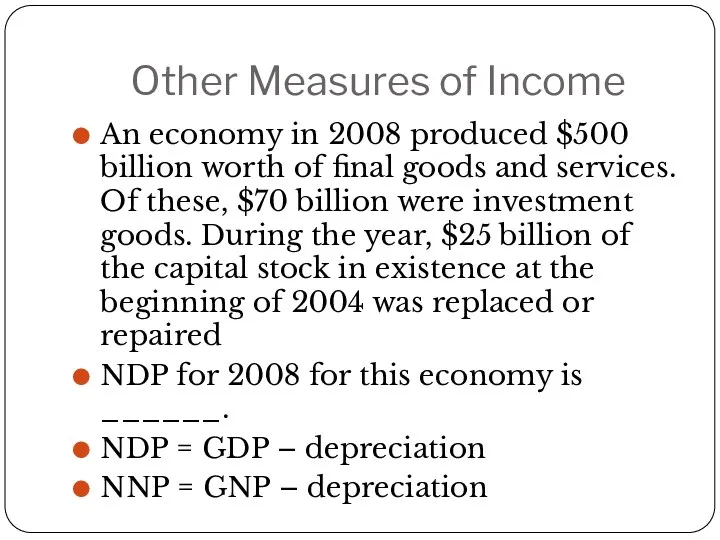
- 42. Other Measures of Income Net national product (NNP) – is the total income earned by a
- 43. Other Measures of Income An economy in 2008 produced $500 billion worth of final goods and
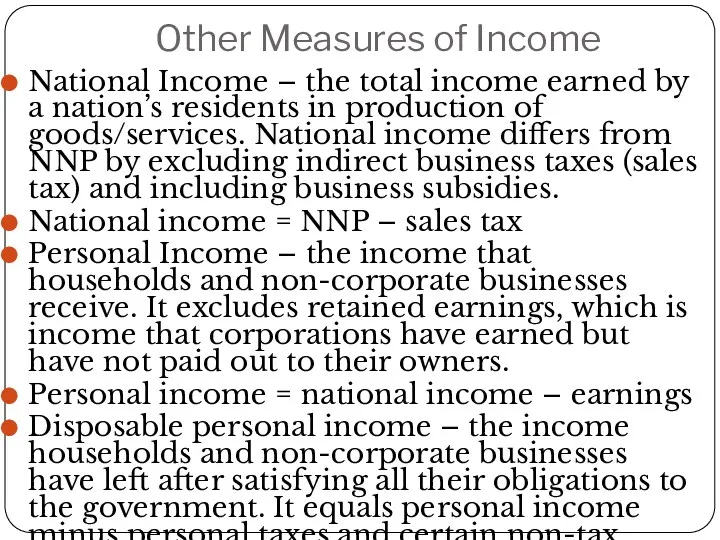
- 44. Other Measures of Income National Income – the total income earned by a nation’s residents in
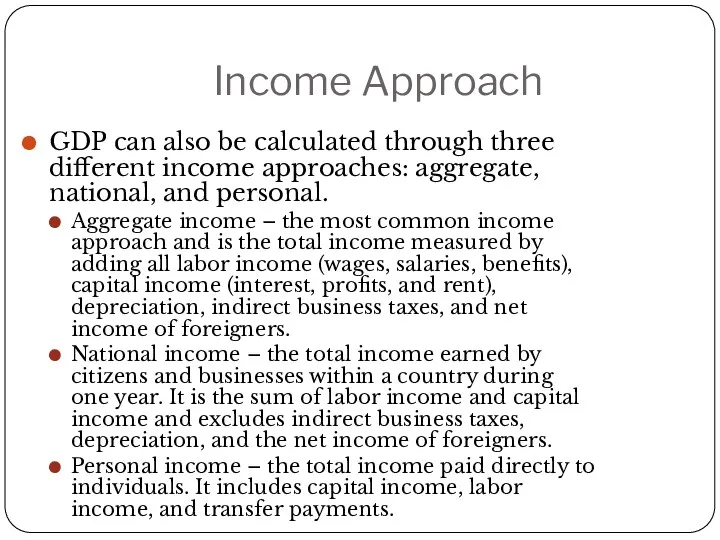
- 45. Income Approach GDP can also be calculated through three different income approaches: aggregate, national, and personal.
- 46. Production Approach The production approach is the total production of all firms or industries in the
- 47. Unemployment and its Natural Rate
- 48. Unemployment can be divided into two categories The economy’s natural rate of unemployment refers to the
- 49. Identify Unemployment How is Unemployment Measured? The Bureau of Labor Statistics (BLS) surveys 60,000 households every
- 50. How is Unemployment Measured? Labor force – the total number of workers, including both the employed
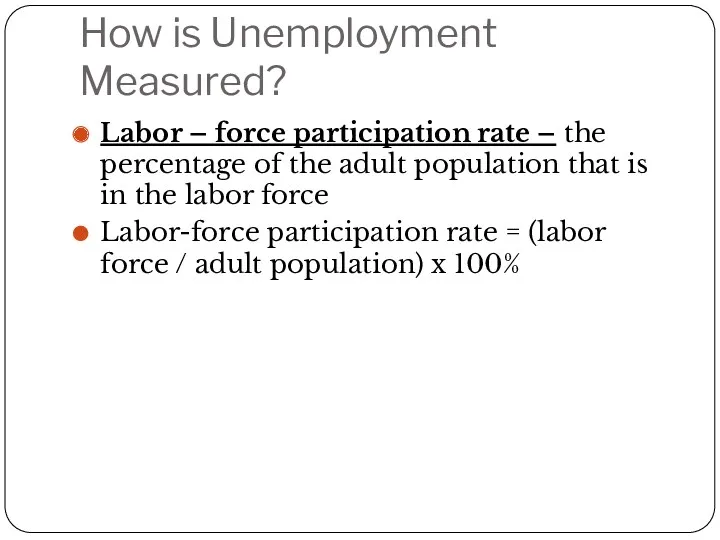
- 51. How is Unemployment Measured? Labor – force participation rate – the percentage of the adult population
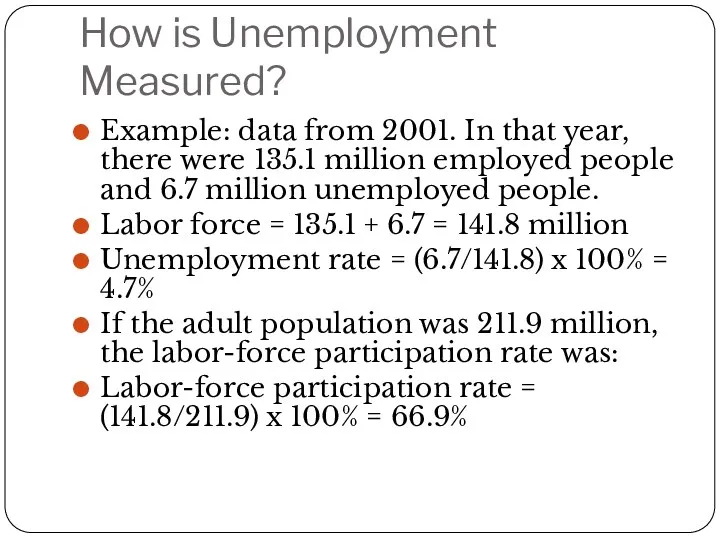
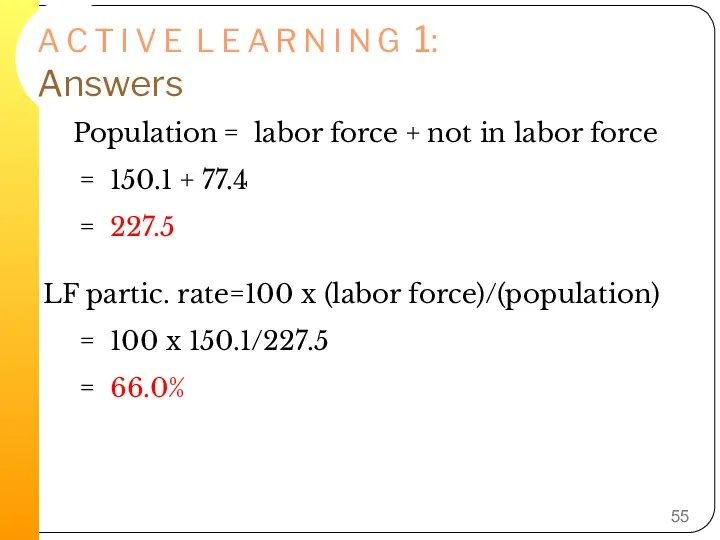
- 52. How is Unemployment Measured? Example: data from 2001. In that year, there were 135.1 million employed
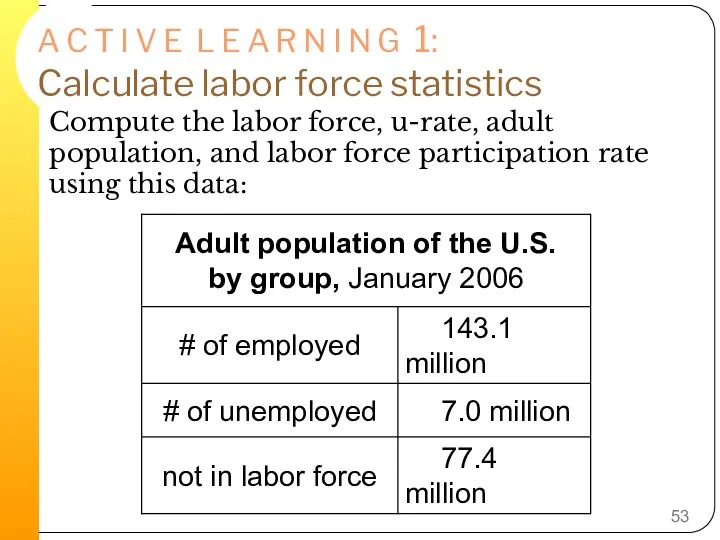
- 53. A C T I V E L E A R N I N G 1: Calculate
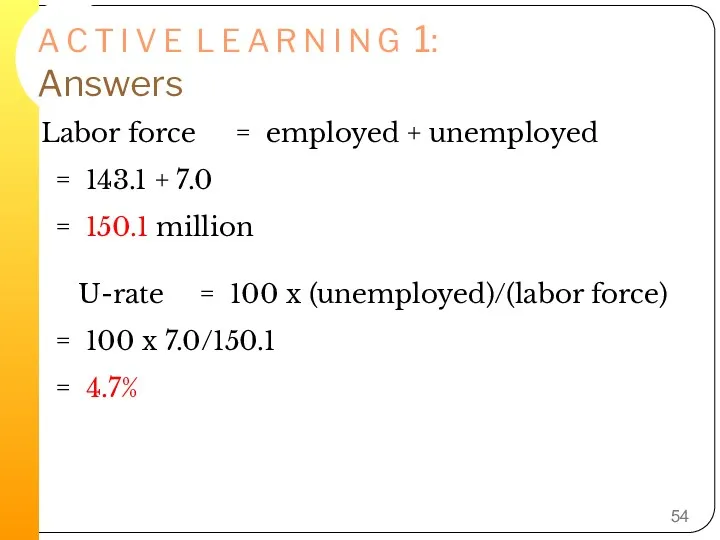
- 54. A C T I V E L E A R N I N G 1: Answers
- 55. A C T I V E L E A R N I N G 1: Answers
- 56. Unemployment and labor-force participation rates for various sub-groups of the U.S. population Women have lower labor-force
- 57. Labor Market Statistics for Whites & Blacks, January 2006
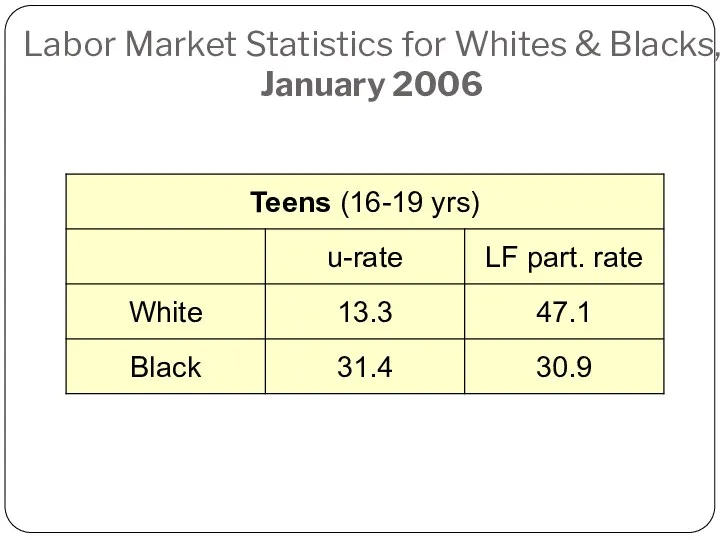
- 58. Labor Market Statistics for Whites & Blacks, January 2006
- 59. Labor Market Statistics for Other Groups, January 2006
- 60. Labor Market Statistics by Education Level, January 2006
- 62. Unemployment Natural rate of unemployment – the normal rate of unemployment around which the unemployment rate
- 63. Case Study: Labor-Force Participation of Men and Women in the U.S. economy There has been a
- 64. Does the Unemployment Rate Measure What We Want It To? Measuring the unemployment rate is not
- 65. Does the Unemployment Rate Measure What We Want It To? There may be individuals who are
- 66. How Long are the Unemployed without work? Another important variable that policymakers may be concerned with
- 67. Why are there always People Unemployed? In an ideal labor market, wages would adjust so that
- 68. Types of Unemployment Frictional unemployment – unemployment that results because it takes time for workers to
- 69. Types of Unemployment Seasonal unemployment – the unemployment that arises because of seasonal weather patterns. Seasonal
- 70. Job Search Job search – the process by which workers find appropriate jobs given their tastes
- 71. Why some Frictional Unemployment is Inevitable? Frictional unemployment often occurs because of a change in the
- 72. Public Policy and Job Search Government programs can help to reduce the amount of frictional unemployment
- 73. Unemployment Insurance Unemployment insurance – a government program that partially protects workers’ incomes when they become
- 74. In the News: German Unemployment Unemployment benefits are much more generous in Germany than they are
- 75. Minimum-Wage Laws Unemployment can also occur because of minimum-wage laws The minimum wage is a price
- 76. Minimum-Wage Laws Anytime a wage is kept above the equilibrium level for any reason, the result
- 77. Unions and Collective Bargaining Union – a worker association that bargains with employers over wages and
- 78. The Economics of Union Collective bargaining – the process by which unions and firms agree on
- 79. The Economics of Unions This implies that unions raise the wage above the equilibrium wage, resulting
- 80. Are Unions Good or Bad for the Economy? Critics of unions argue that unions are a
- 81. The Theory of Efficiency Wages Efficiency wages – above-equilibrium wages paid by firms in order to
- 82. There are several reasons why a firm may pay efficiency wages. Worker Health Better paid workers
- 83. There are several reasons why a firm may pay efficiency wages. Worker Effort Again, if a
- 84. Case Study: Henry Ford and the Very Generous $5-A-Day Wage Henry Ford used a high wage
- 85. Unemployment High rates of unemployment can cause a personal loss of self-confidence, crime, the breakup of
- 87. Inflation and CPI
- 88. Consumer Price Index Consumer Price Index – (CPI) measure of the overall cost of the goods
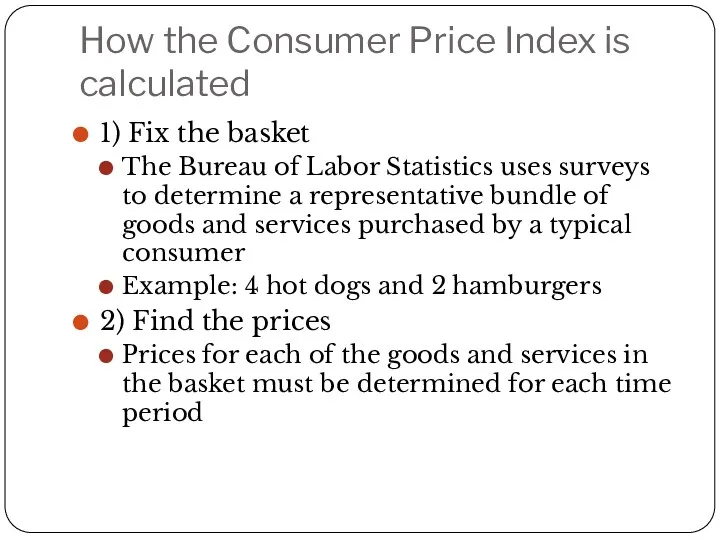
- 89. How the Consumer Price Index is calculated 1) Fix the basket The Bureau of Labor Statistics
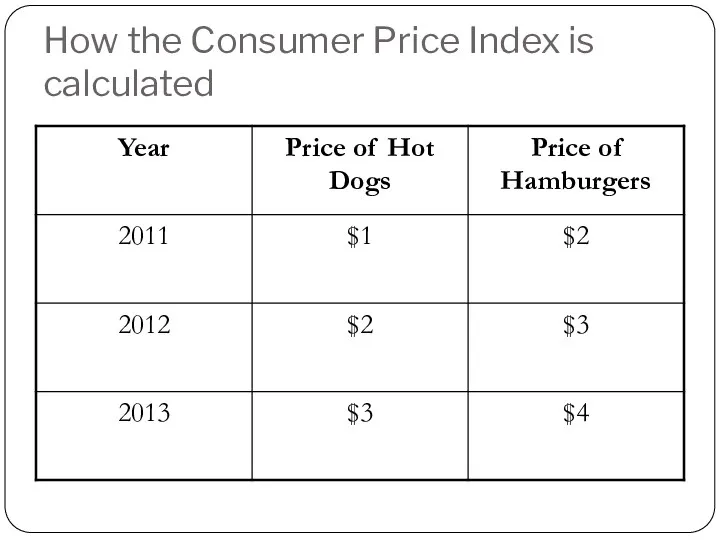
- 90. How the Consumer Price Index is calculated
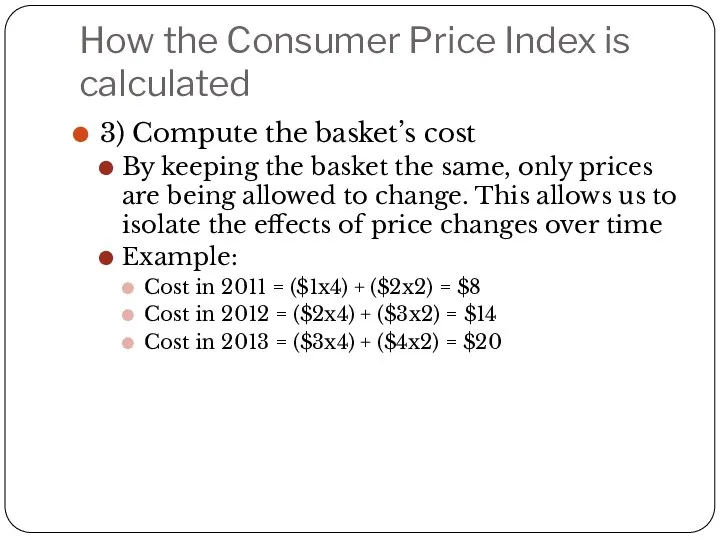
- 91. How the Consumer Price Index is calculated 3) Compute the basket’s cost By keeping the basket
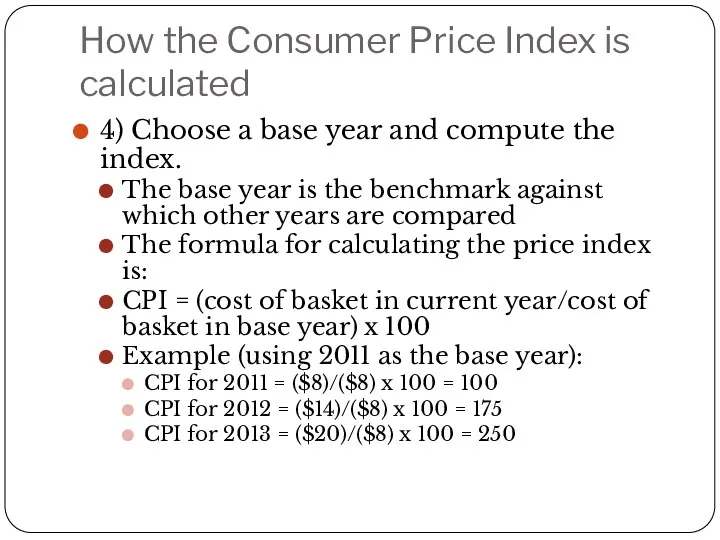
- 92. How the Consumer Price Index is calculated 4) Choose a base year and compute the index.
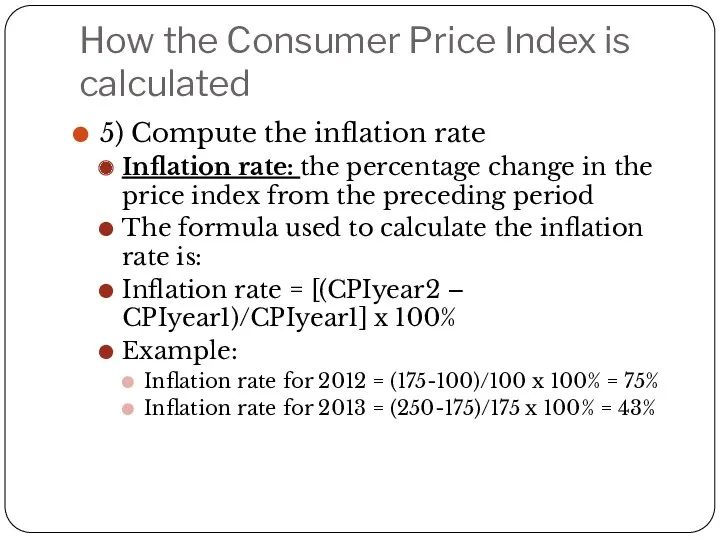
- 93. How the Consumer Price Index is calculated 5) Compute the inflation rate Inflation rate: the percentage
- 94. EXAMPLE basket: {4 pizzas, 10 lattes} $12 x 4 + $3 x 10 = $78 $11
- 95. A C T I V E L E A R N I N G 1: Calculate
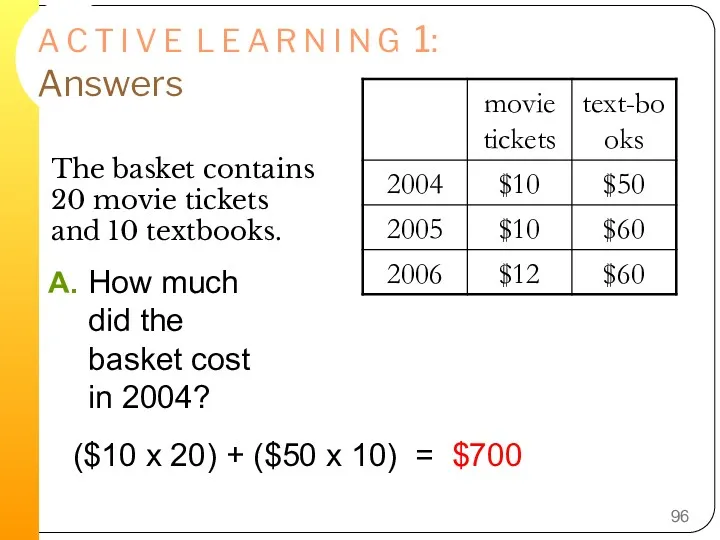
- 96. A C T I V E L E A R N I N G 1: Answers
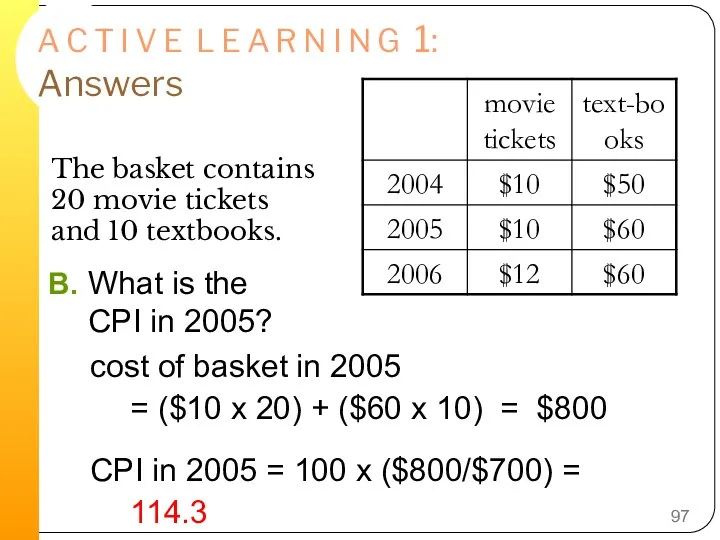
- 97. A C T I V E L E A R N I N G 1: Answers
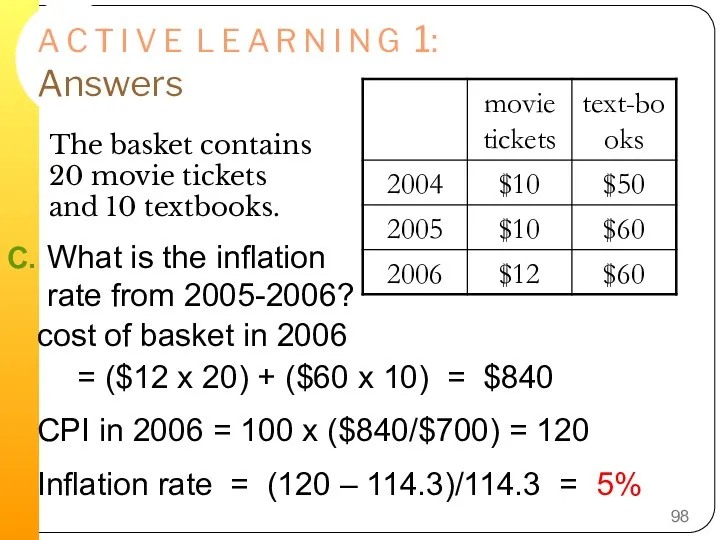
- 98. A C T I V E L E A R N I N G 1: Answers
- 99. What is in the CPI’s Basket? Housing 41% Transportation 17% Food and Beverages 16% Education and
- 100. What’s in the CPI’s Basket?
- 101. In the News: Shopping for the CPI There are approximately 300 employees of the Bureau of
- 102. The Producer Price Index Producer Price Index – a measure of the cost of a basket
- 103. Problems in Measuring the Cost of Living Substitution Bias When the price of one good changes,
- 104. Problems in Measuring the Cost of Living Introduction of New Goods When a new good is
- 105. Problems in Measuring the Cost of Living Unmeasured Quality Change If the quality of a good
- 106. Problems in Measuring the Cost of Living The size of these problems is also difficult to
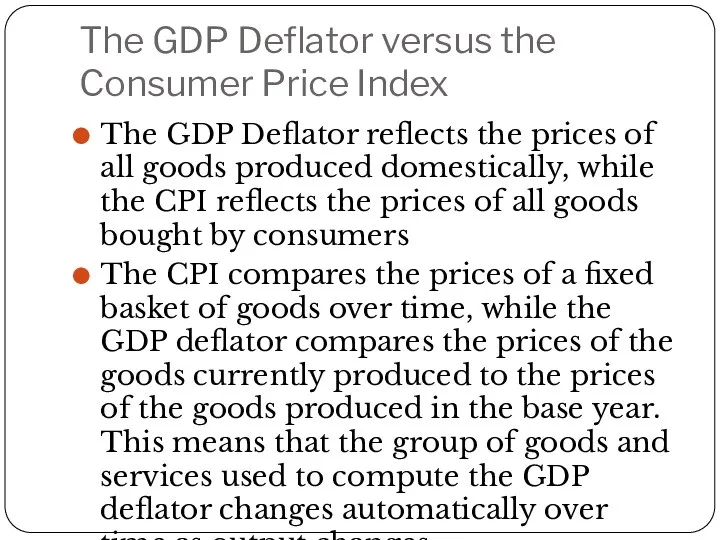
- 107. The GDP Deflator versus the Consumer Price Index The GDP Deflator reflects the prices of all
- 108. Two Measures of Inflation
- 109. Contrasting the CPI and GDP Deflator Imported consumer goods: included in CPI excluded from GDP deflator
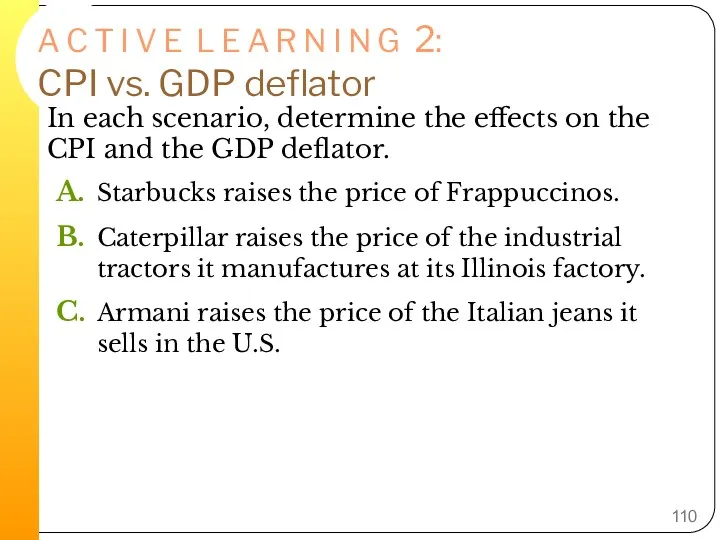
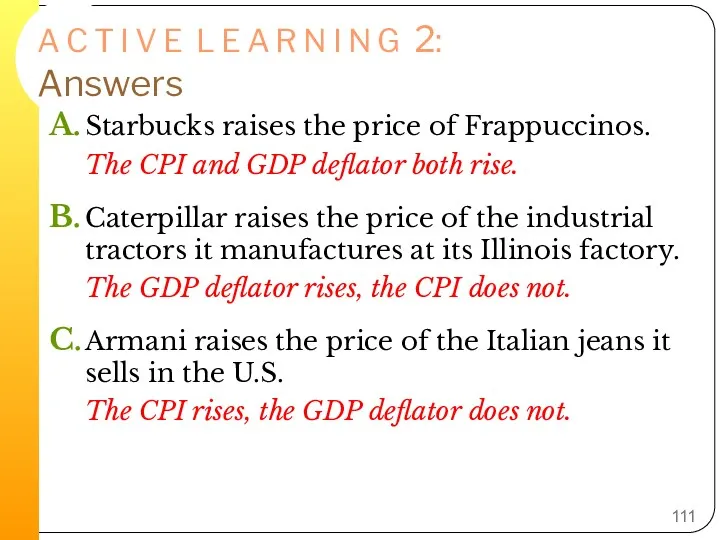
- 110. A C T I V E L E A R N I N G 2: CPI
- 111. A C T I V E L E A R N I N G 2: Answers
- 112. Correcting Economic Variables for the Effects of Inflation Inflation makes it harder to compare dollar amounts
- 113. Mr. Index Goes to Hollywood Reports of box office success are often made in terms of
- 114. The Most Popular Movies of All Time, Inflation Adjusted http://boxofficemojo.com/alltime/adjusted.htm
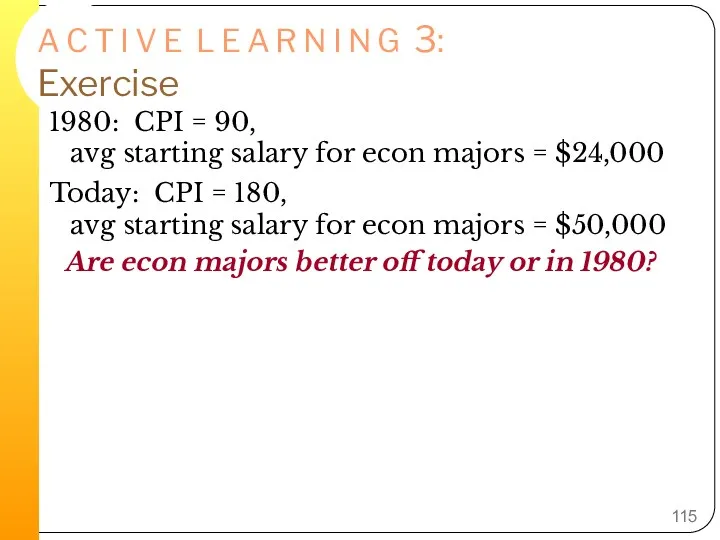
- 115. A C T I V E L E A R N I N G 3: Exercise
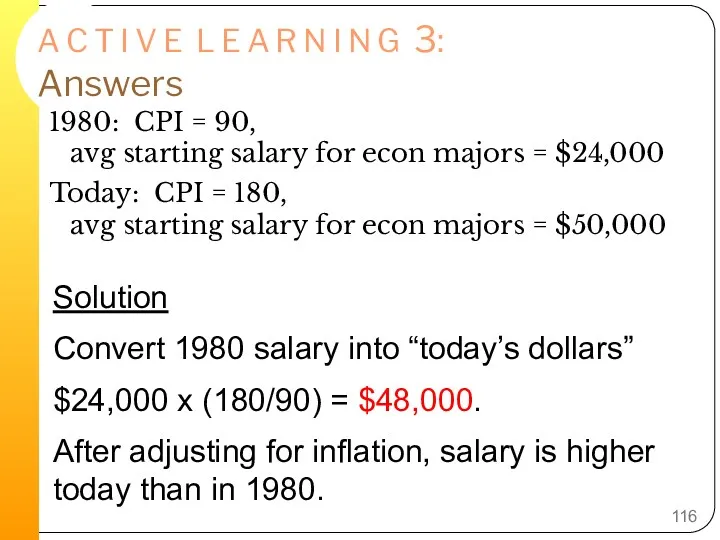
- 116. A C T I V E L E A R N I N G 3: Answers
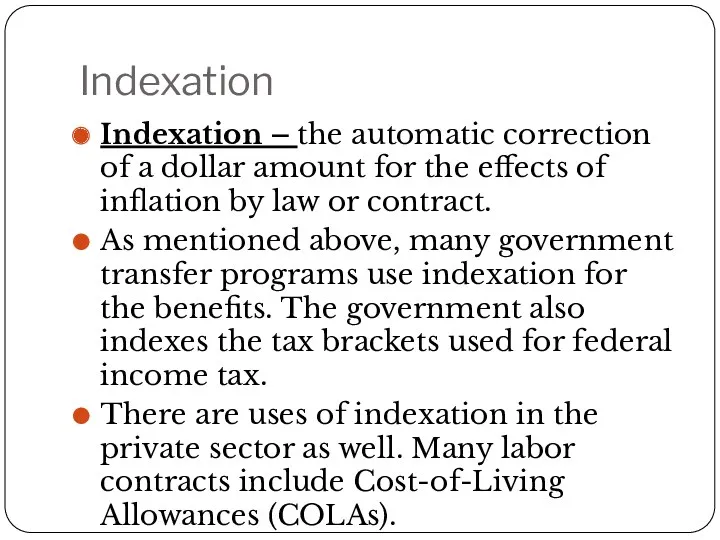
- 117. Indexation Indexation – the automatic correction of a dollar amount for the effects of inflation by
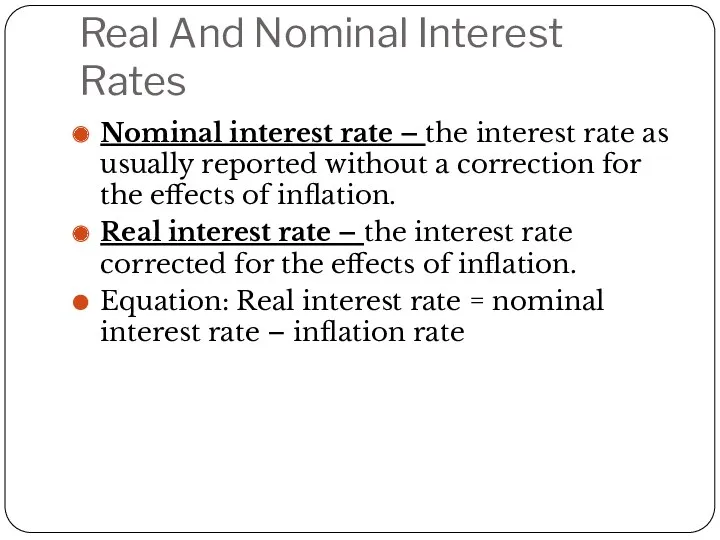
- 118. Real And Nominal Interest Rates Nominal interest rate – the interest rate as usually reported without
- 119. Real and Nominal Interest Rates in the U.S.
- 120. Nominal and Real Interest Rate Suppose a student has $100 in his savings account earning 3
- 122. Скачать презентацию
Gross Domestic Product
Gross Domestic Product
Measuring a Nation’s Income
Microeconomics – the study of how individual households
Measuring a Nation’s Income
Microeconomics – the study of how individual households
Measuring a Nation’s Income
Macroeconomics answers questions like the following:
Why is average
Measuring a Nation’s Income
Macroeconomics answers questions like the following:
Why is average
The Economy’s Income and Expenditure
When judging whether the economy is doing
The Economy’s Income and Expenditure
When judging whether the economy is doing
The Measurement of Gross Domestic Product
Gross Domestic Product (GDP) – a
The Measurement of Gross Domestic Product
Gross Domestic Product (GDP) – a
The Measurement of Gross Domestic Product
The equality of income and expenditure
The Measurement of Gross Domestic Product
The equality of income and expenditure
Circular Flow Diagram
If someone pays someone else $100 to mow a
Circular Flow Diagram
If someone pays someone else $100 to mow a
Circular Flow - Leakages
Leakage is the non-consumption uses of income, including
Circular Flow - Leakages
Leakage is the non-consumption uses of income, including
The Measurement of Gross Domestic Product
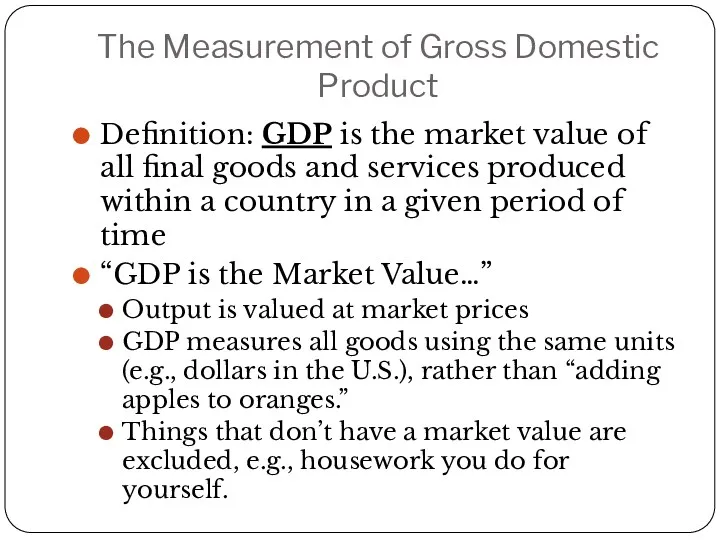
Definition: GDP is the market value
The Measurement of Gross Domestic Product
Definition: GDP is the market value
The Measurement of Gross Domestic Product
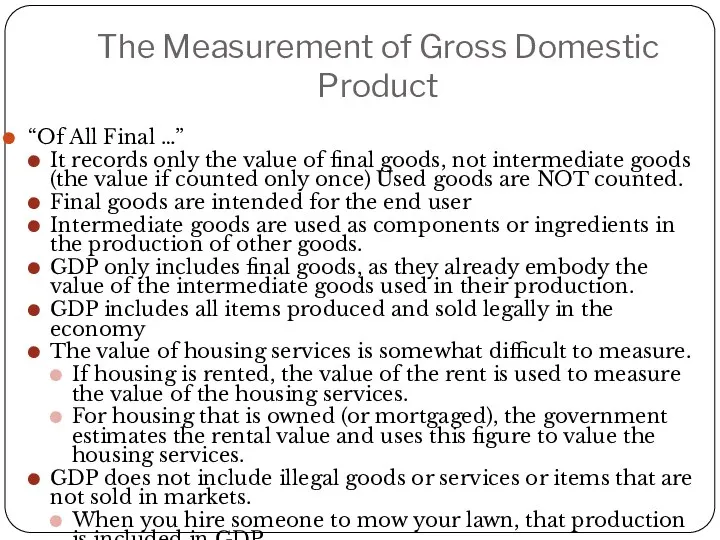
“Of All Final …”
It records only
The Measurement of Gross Domestic Product
“Of All Final …”
It records only
The Measurement of Gross Domestic Product
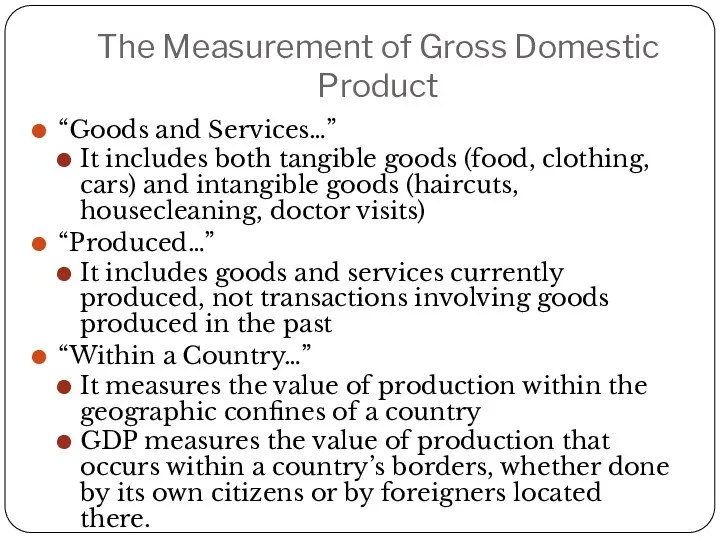
“Goods and Services…”
It includes both tangible
The Measurement of Gross Domestic Product
“Goods and Services…”
It includes both tangible
The Measurement of Gross Domestic Product
“In a Given Period of Time…”
It
The Measurement of Gross Domestic Product
“In a Given Period of Time…”
It
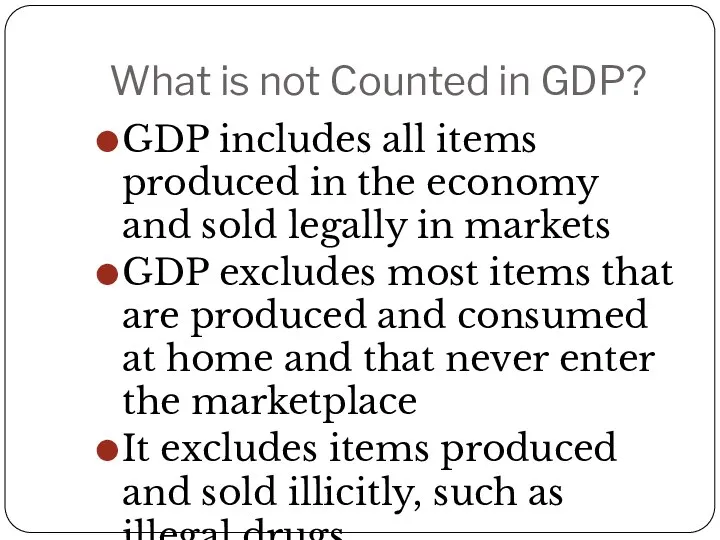
What is not Counted in GDP?
GDP includes all items produced in
What is not Counted in GDP?
GDP includes all items produced in
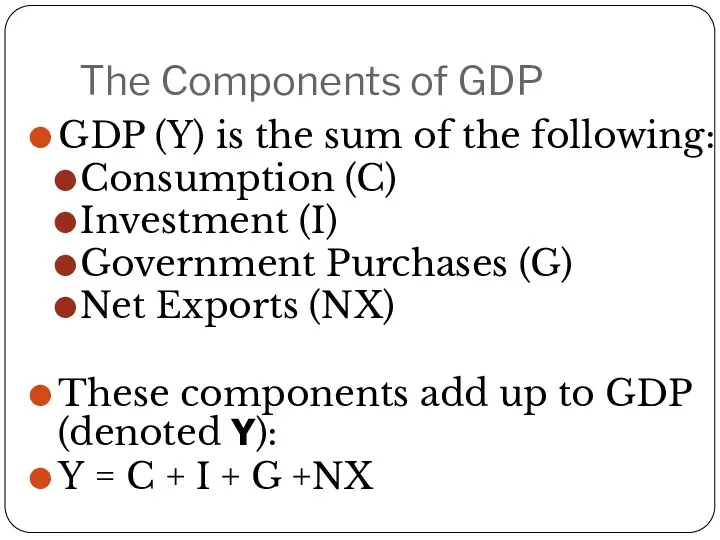
The Components of GDP
GDP (Y) is the sum of the following:
Consumption
The Components of GDP
GDP (Y) is the sum of the following:
Consumption
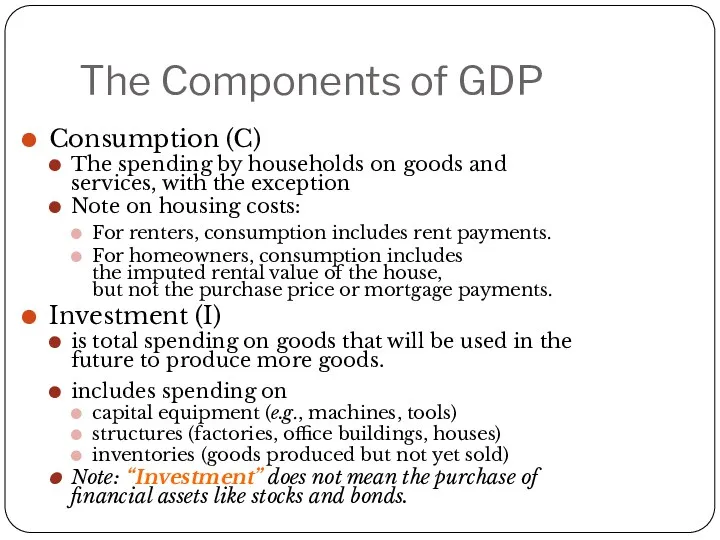
The Components of GDP
Consumption (C)
The spending by households on goods and
The Components of GDP
Consumption (C)
The spending by households on goods and
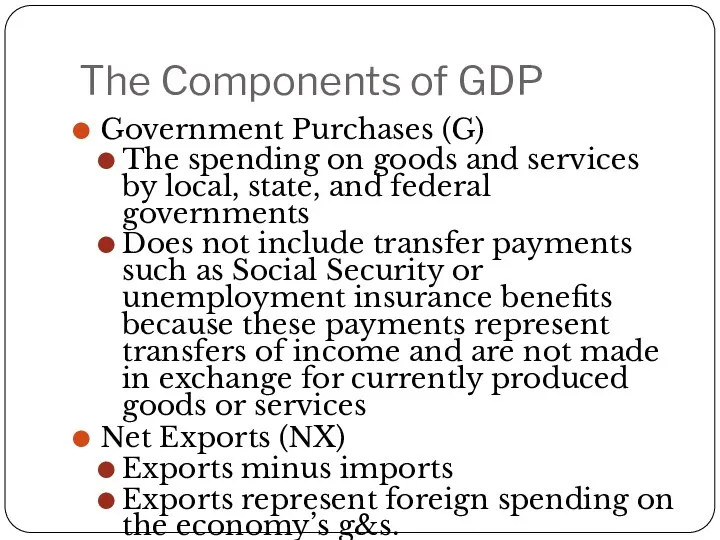
The Components of GDP
Government Purchases (G)
The spending on goods and services
The Components of GDP
Government Purchases (G)
The spending on goods and services
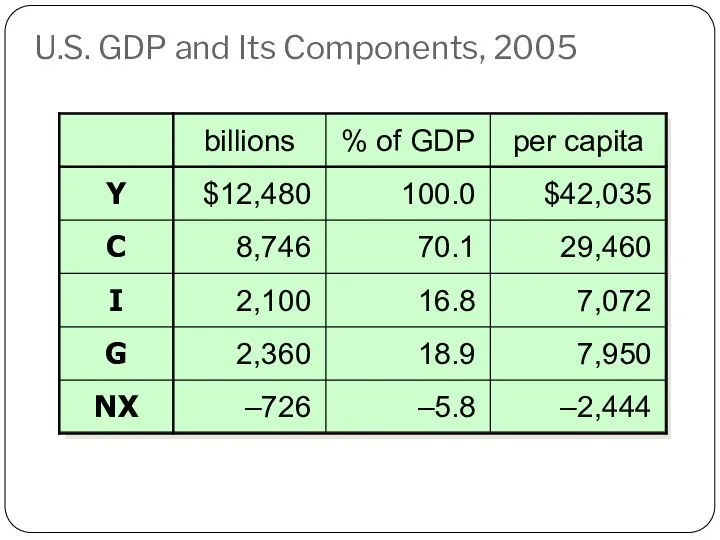
U.S. GDP and Its Components, 2005
U.S. GDP and Its Components, 2005
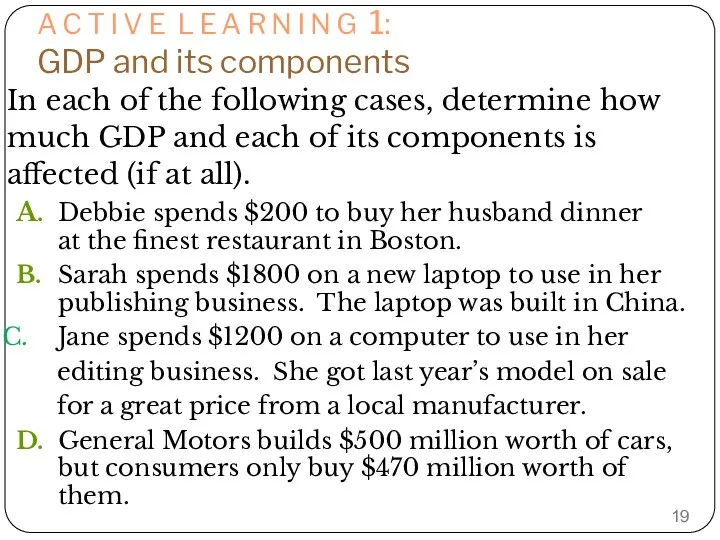
A C T I V E L E A R N
A C T I V E L E A R N
A C T I V E L E A R N
A C T I V E L E A R N
A C T I V E L E A R N
A C T I V E L E A R N
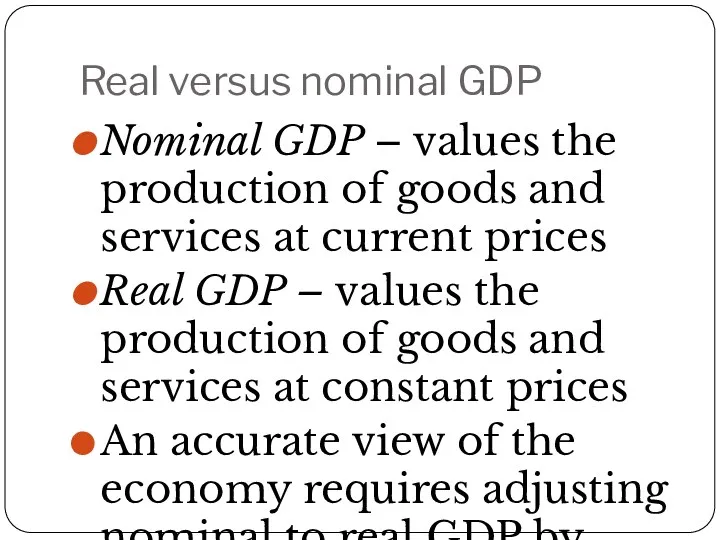
Real versus nominal GDP
Nominal GDP – values the production of goods
Real versus nominal GDP
Nominal GDP – values the production of goods
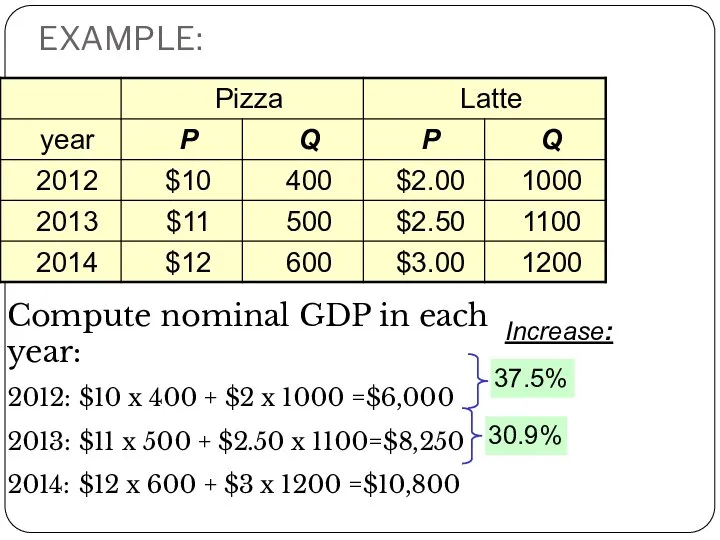
EXAMPLE:
Compute nominal GDP in each year:
2012: $10 x 400 + $2 x
EXAMPLE:
Compute nominal GDP in each year:
2012: $10 x 400 + $2 x
EXAMPLE:
Compute real GDP in each year,
using 2012 as the base
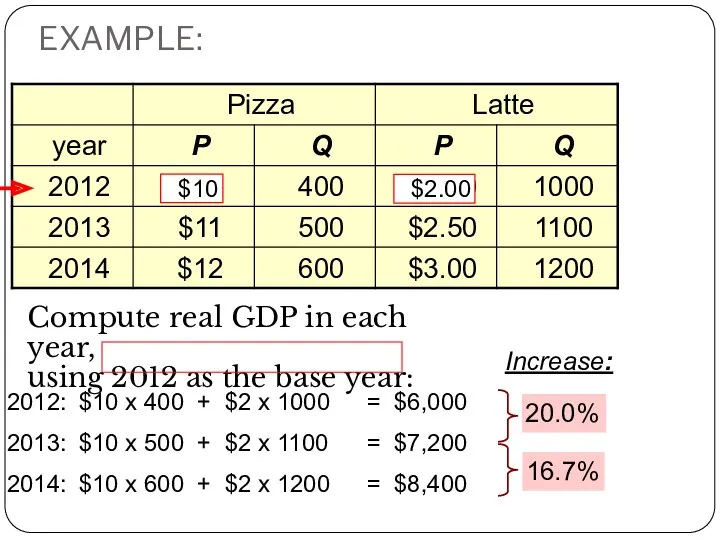
EXAMPLE:
Compute real GDP in each year, using 2012 as the base
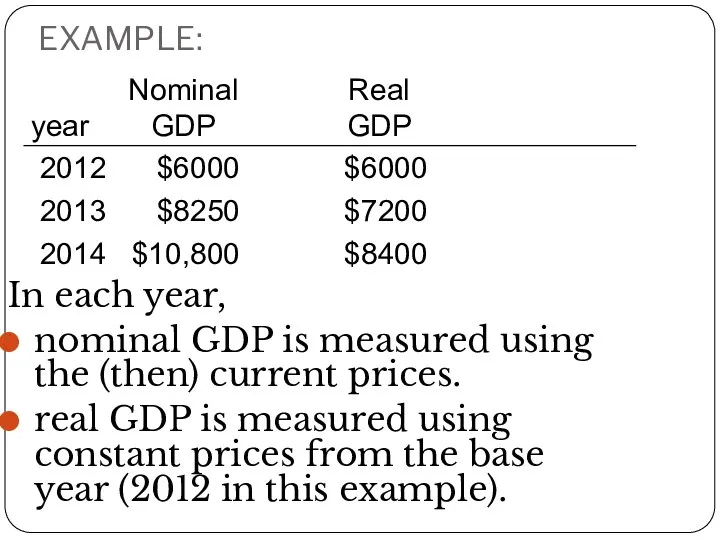
EXAMPLE:
In each year,
nominal GDP is measured using the (then) current prices.
EXAMPLE:
In each year,
nominal GDP is measured using the (then) current prices.
EXAMPLE:
The change in nominal GDP reflects both prices and quantities.
The
EXAMPLE:
The change in nominal GDP reflects both prices and quantities.
The
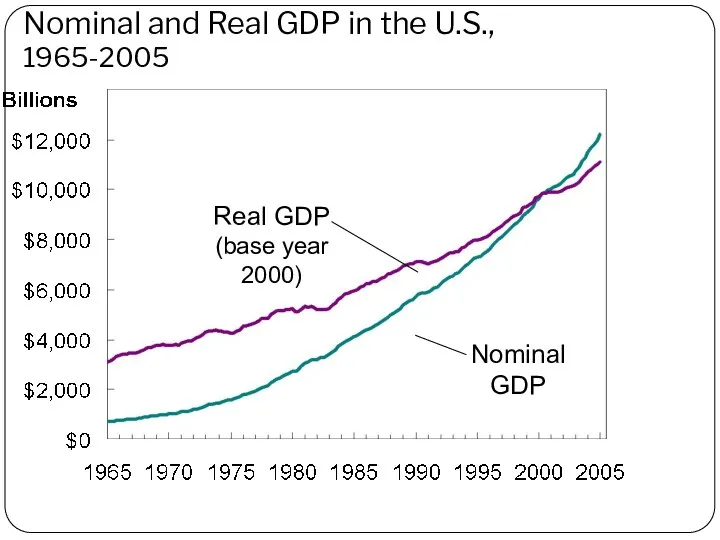
Nominal and Real GDP in the U.S.,
1965-2005
Real GDP (base year
Nominal and Real GDP in the U.S.,
1965-2005
Real GDP (base year
The GDP Deflator
The GDP Deflator is a measure of the price
The GDP Deflator
The GDP Deflator is a measure of the price
The GDP Deflator
The GDP deflator is a measure of the overall
The GDP Deflator
The GDP deflator is a measure of the overall
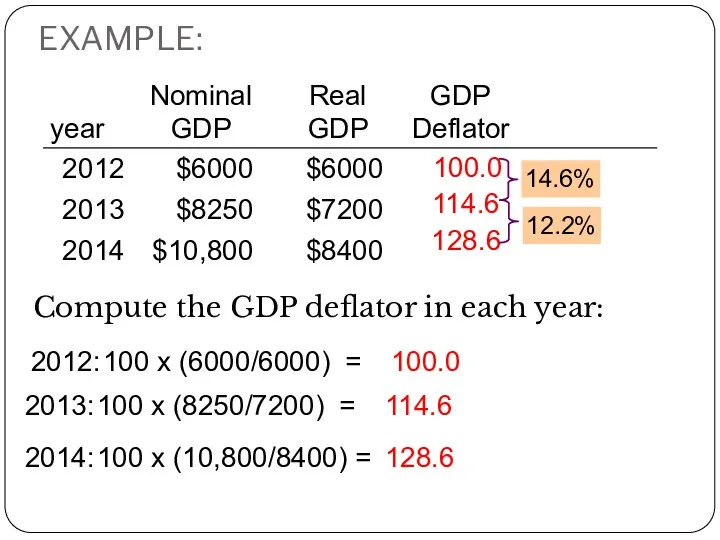
EXAMPLE:
Compute the GDP deflator in each year:
EXAMPLE:
Compute the GDP deflator in each year:
The GDP Deflator
Converting Nominal GDP to Real GDP
Nominal GDP is converted
The GDP Deflator
Converting Nominal GDP to Real GDP
Nominal GDP is converted
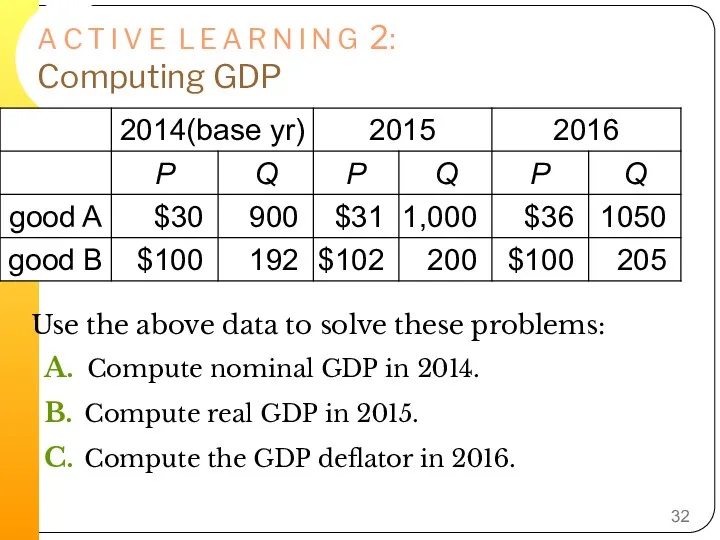
A C T I V E L E A R N
A C T I V E L E A R N
A C T I V E L E A R N
A C T I V E L E A R N
A C T I V E L E A R N
A C T I V E L E A R N
GDP and Economic Well-being
GDP is the best single measure of the
GDP and Economic Well-being
GDP is the best single measure of the
GDP and Economic Well-Being
Some things that contribute to well-being are not
GDP and Economic Well-Being
Some things that contribute to well-being are not

GDP and Economic Well-Being
It does not allow for the health of
GDP and Economic Well-Being
It does not allow for the health of
Then Why Do We Care About GDP?
Having a large GDP enables
Then Why Do We Care About GDP?
Having a large GDP enables
GDP and Life Expectancy in 12 Countries
Life expectancy (in years)
Real GDP
GDP and Life Expectancy in 12 Countries
Life expectancy (in years)
Real GDP
GDP and Adult Literacy in 12 Countries
Adult Literacy
(% of population)
Real
GDP and Adult Literacy in 12 Countries
Adult Literacy
(% of population)
Real
Gross National Product (GNP)
GNP is the total income earned by a
Gross National Product (GNP)
GNP is the total income earned by a
Other Measures of Income
Net national product (NNP) – is the total
Other Measures of Income
Net national product (NNP) – is the total
Other Measures of Income
An economy in 2008 produced $500 billion worth
Other Measures of Income
An economy in 2008 produced $500 billion worth
Other Measures of Income
National Income – the total income earned by
Other Measures of Income
National Income – the total income earned by
Income Approach
GDP can also be calculated through three different income approaches:
Income Approach
GDP can also be calculated through three different income approaches:
Production Approach
The production approach is the total production of all firms
Production Approach
The production approach is the total production of all firms
Unemployment and its Natural Rate
Unemployment and its Natural Rate
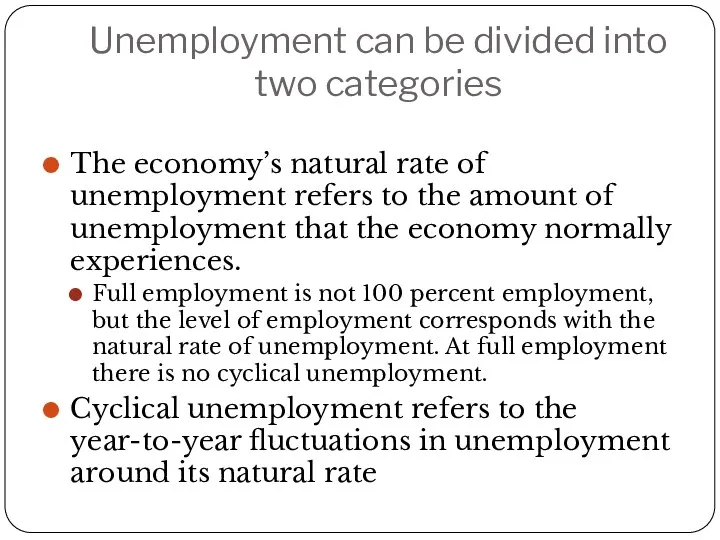
Unemployment can be divided into two categories
The economy’s natural rate of
Unemployment can be divided into two categories
The economy’s natural rate of
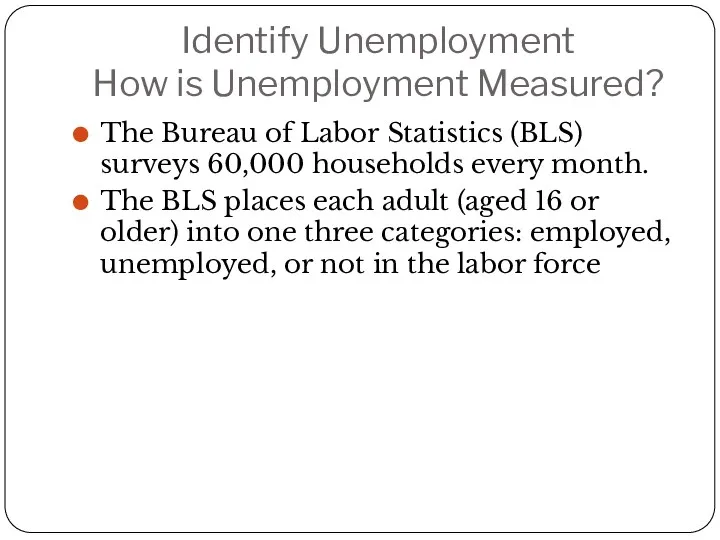
Identify Unemployment
How is Unemployment Measured?
The Bureau of Labor Statistics (BLS) surveys
Identify Unemployment
How is Unemployment Measured?
The Bureau of Labor Statistics (BLS) surveys
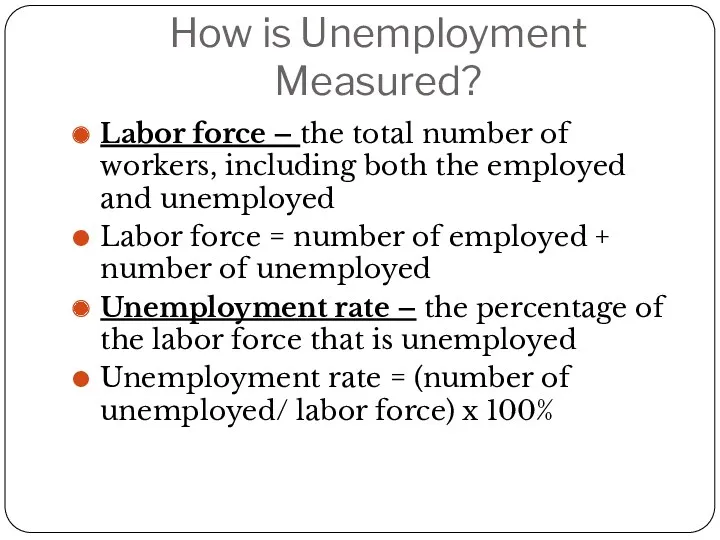
How is Unemployment Measured?
Labor force – the total number of workers,
How is Unemployment Measured?
Labor force – the total number of workers,
How is Unemployment Measured?
Labor – force participation rate – the percentage
How is Unemployment Measured?
Labor – force participation rate – the percentage
How is Unemployment Measured?
Example: data from 2001. In that year, there
How is Unemployment Measured?
Example: data from 2001. In that year, there
A C T I V E L E A R N
A C T I V E L E A R N
A C T I V E L E A R N
A C T I V E L E A R N
A C T I V E L E A R N
A C T I V E L E A R N
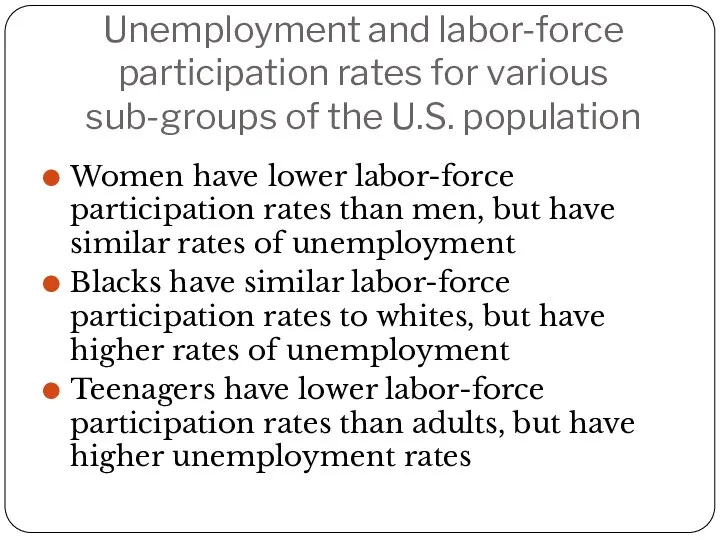
Unemployment and labor-force participation rates for various sub-groups of the U.S.
Unemployment and labor-force participation rates for various sub-groups of the U.S.
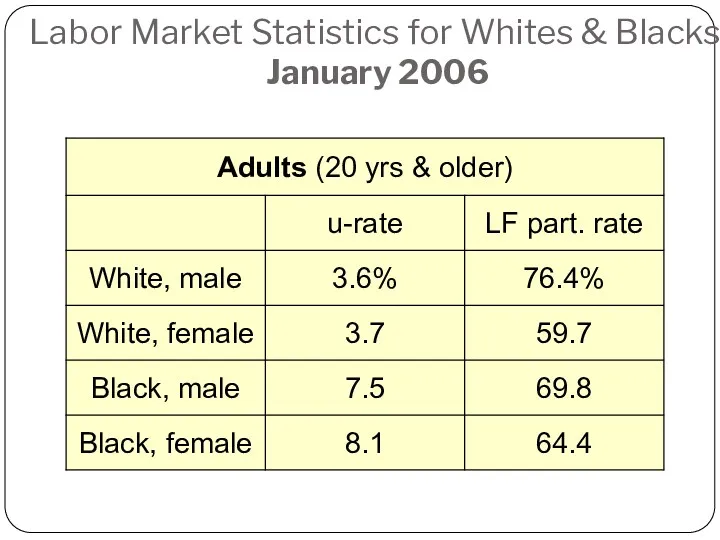
Labor Market Statistics for Whites & Blacks,
January 2006
Labor Market Statistics for Whites & Blacks,
January 2006
Labor Market Statistics for Whites & Blacks,
January 2006
Labor Market Statistics for Whites & Blacks,
January 2006
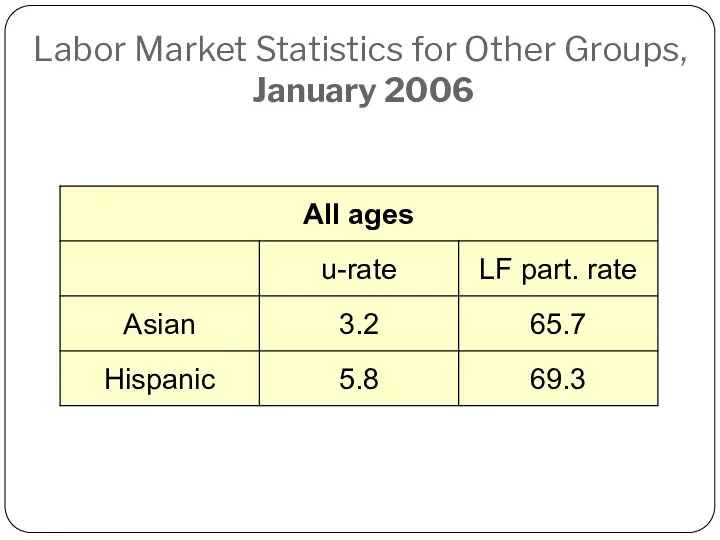
Labor Market Statistics for Other Groups, January 2006
Labor Market Statistics for Other Groups, January 2006
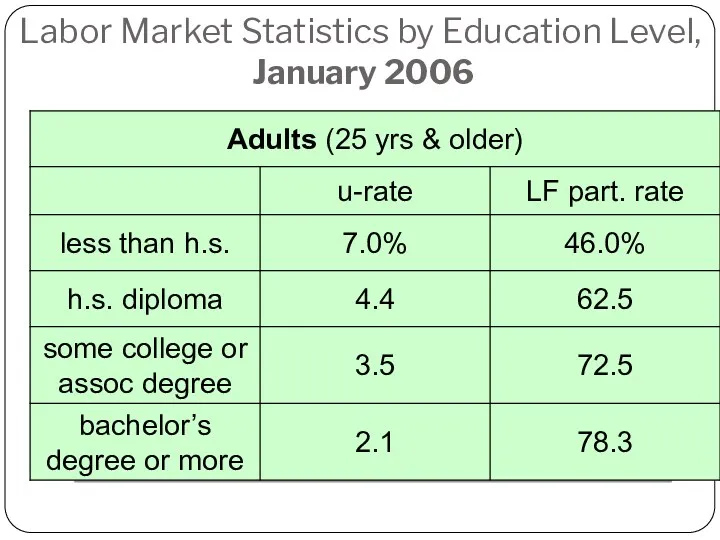
Labor Market Statistics by Education Level, January 2006
Labor Market Statistics by Education Level, January 2006
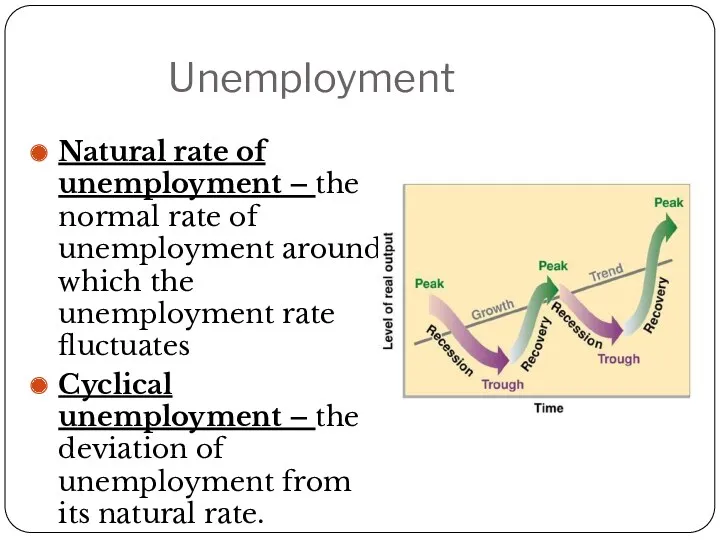
Unemployment
Natural rate of unemployment – the normal rate of unemployment around
Unemployment
Natural rate of unemployment – the normal rate of unemployment around
Case Study: Labor-Force Participation of Men and Women in the U.S.
Case Study: Labor-Force Participation of Men and Women in the U.S.
Does the Unemployment Rate Measure What We Want It To?
Measuring the
Does the Unemployment Rate Measure What We Want It To?
Measuring the
Does the Unemployment Rate Measure What We Want It To?
There may
Does the Unemployment Rate Measure What We Want It To?
There may
How Long are the Unemployed without work?
Another important variable that policymakers
How Long are the Unemployed without work?
Another important variable that policymakers
Why are there always People Unemployed?
In an ideal labor market, wages
Why are there always People Unemployed?
In an ideal labor market, wages
Types of Unemployment
Frictional unemployment – unemployment that results because it
Types of Unemployment
Frictional unemployment – unemployment that results because it
Types of Unemployment
Seasonal unemployment – the unemployment that arises because of
Types of Unemployment
Seasonal unemployment – the unemployment that arises because of
Job Search
Job search – the process by which workers find appropriate
Job Search
Job search – the process by which workers find appropriate
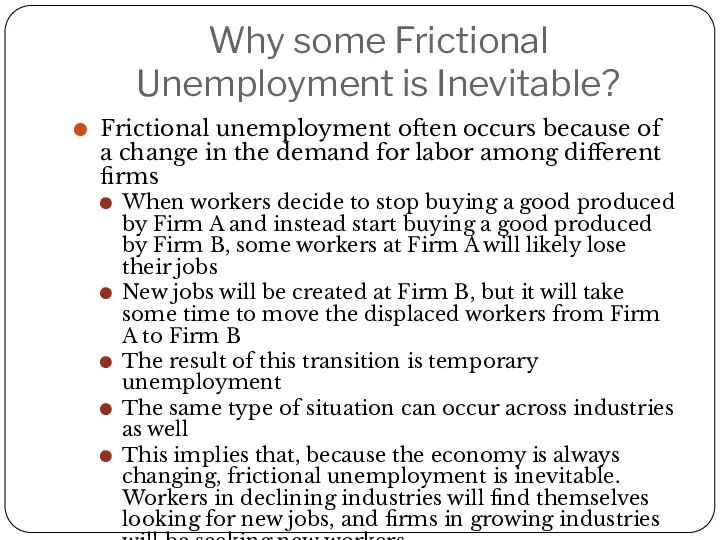
Why some Frictional Unemployment is Inevitable?
Frictional unemployment often occurs because of
Why some Frictional Unemployment is Inevitable?
Frictional unemployment often occurs because of
Public Policy and Job Search
Government programs can help to reduce the
Public Policy and Job Search
Government programs can help to reduce the
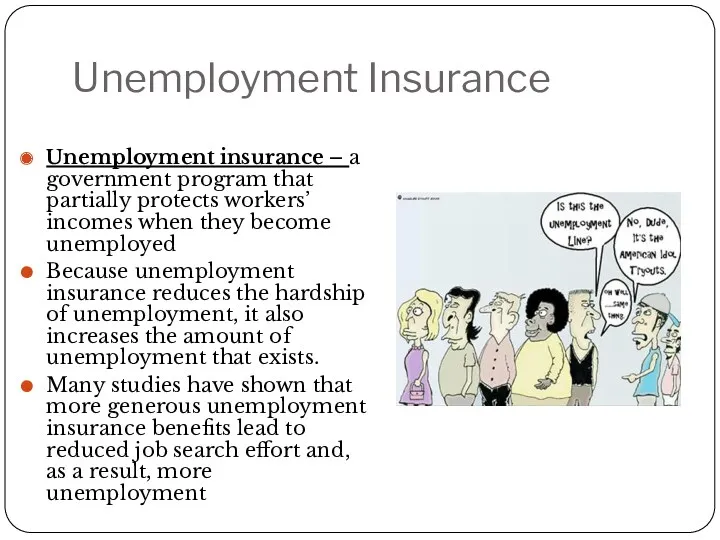
Unemployment Insurance
Unemployment insurance – a government program that partially protects workers’
Unemployment Insurance
Unemployment insurance – a government program that partially protects workers’
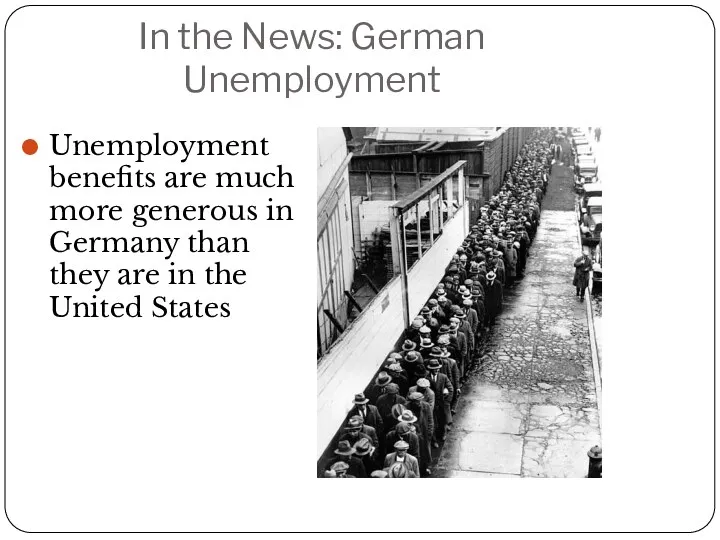
In the News: German Unemployment
Unemployment benefits are much more generous in
In the News: German Unemployment
Unemployment benefits are much more generous in
Minimum-Wage Laws
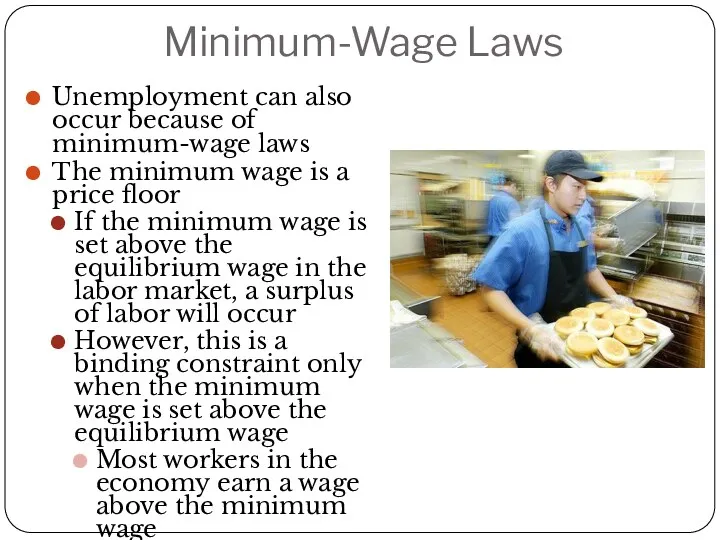
Unemployment can also occur because of minimum-wage laws
The minimum wage
Minimum-Wage Laws
Unemployment can also occur because of minimum-wage laws
The minimum wage
Minimum-Wage Laws
Anytime a wage is kept above the equilibrium level for
Minimum-Wage Laws
Anytime a wage is kept above the equilibrium level for
Unions and Collective Bargaining
Union – a worker association that bargains with
Unions and Collective Bargaining
Union – a worker association that bargains with
The Economics of Union
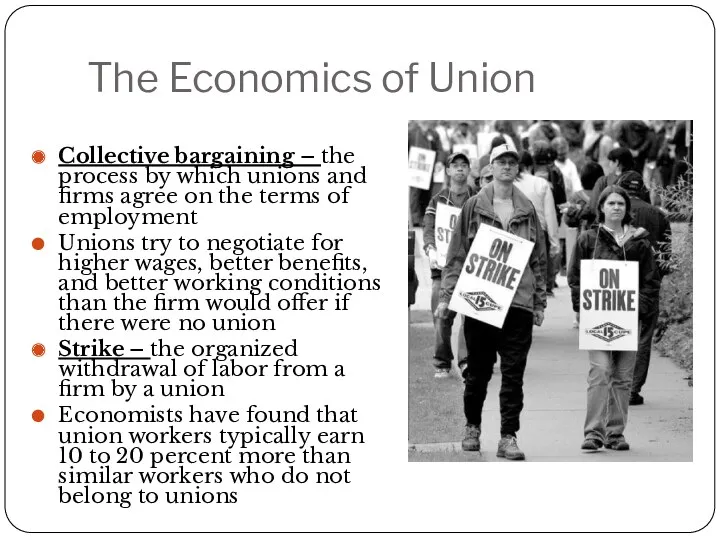
Collective bargaining – the process by which unions
The Economics of Union
Collective bargaining – the process by which unions
The Economics of Unions
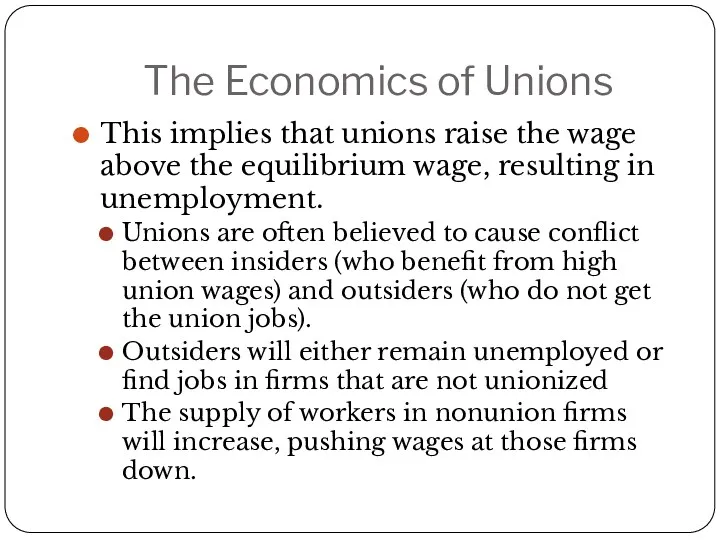
This implies that unions raise the wage above
The Economics of Unions
This implies that unions raise the wage above
Are Unions Good or Bad for the Economy?
Critics of unions argue
Are Unions Good or Bad for the Economy?
Critics of unions argue
The Theory of Efficiency Wages
Efficiency wages – above-equilibrium wages paid by
The Theory of Efficiency Wages
Efficiency wages – above-equilibrium wages paid by
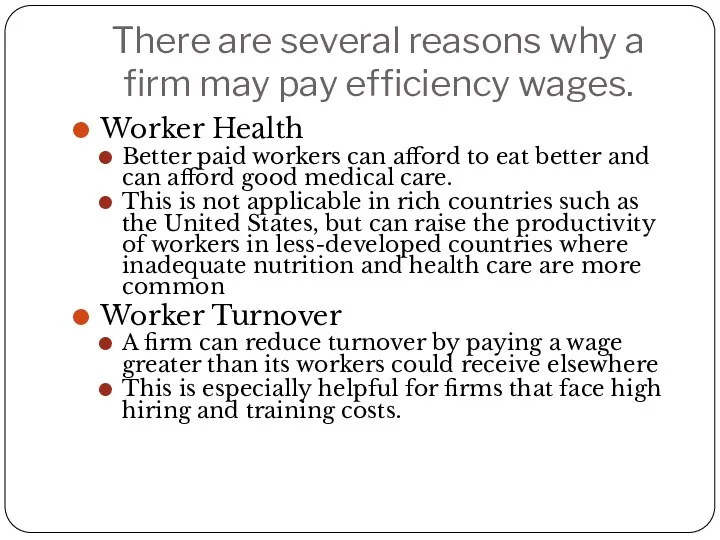
There are several reasons why a firm may pay efficiency wages.
Worker
There are several reasons why a firm may pay efficiency wages.
Worker
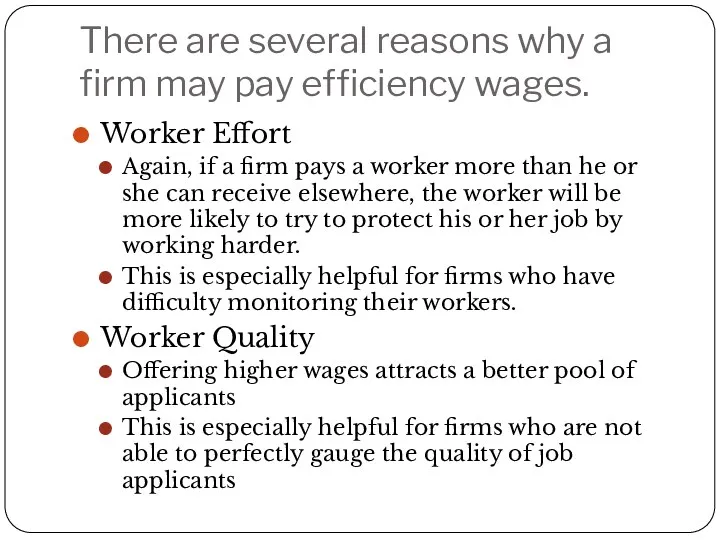
There are several reasons why a firm may pay efficiency wages.
Worker
There are several reasons why a firm may pay efficiency wages.
Worker
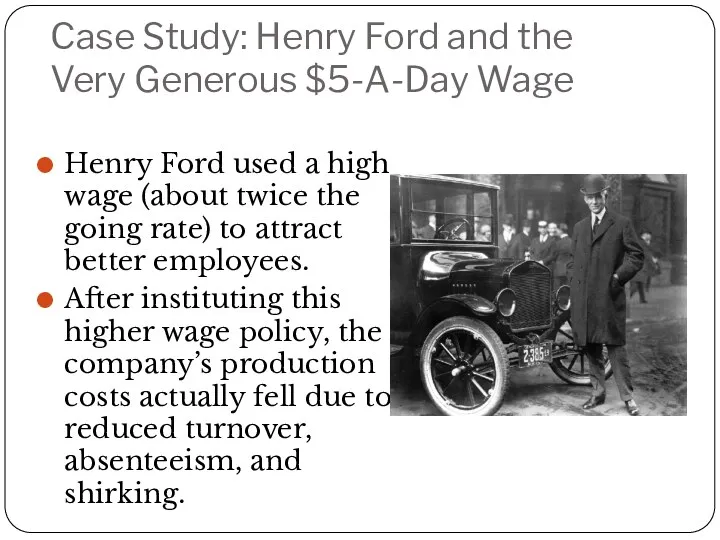
Case Study: Henry Ford and the Very Generous $5-A-Day Wage
Henry Ford
Case Study: Henry Ford and the Very Generous $5-A-Day Wage
Henry Ford
Unemployment
High rates of unemployment can cause a personal loss of self-confidence,
Unemployment
High rates of unemployment can cause a personal loss of self-confidence,
Inflation and CPI
Inflation and CPI
Consumer Price Index
Consumer Price Index – (CPI) measure of the overall
Consumer Price Index
Consumer Price Index – (CPI) measure of the overall
How the Consumer Price Index is calculated
1) Fix the basket
The Bureau
How the Consumer Price Index is calculated
1) Fix the basket
The Bureau
How the Consumer Price Index is calculated
How the Consumer Price Index is calculated
How the Consumer Price Index is calculated
3) Compute the basket’s cost
By
How the Consumer Price Index is calculated
3) Compute the basket’s cost
By
How the Consumer Price Index is calculated
4) Choose a base year
How the Consumer Price Index is calculated
4) Choose a base year
How the Consumer Price Index is calculated
5) Compute the inflation rate
Inflation
How the Consumer Price Index is calculated
5) Compute the inflation rate
Inflation
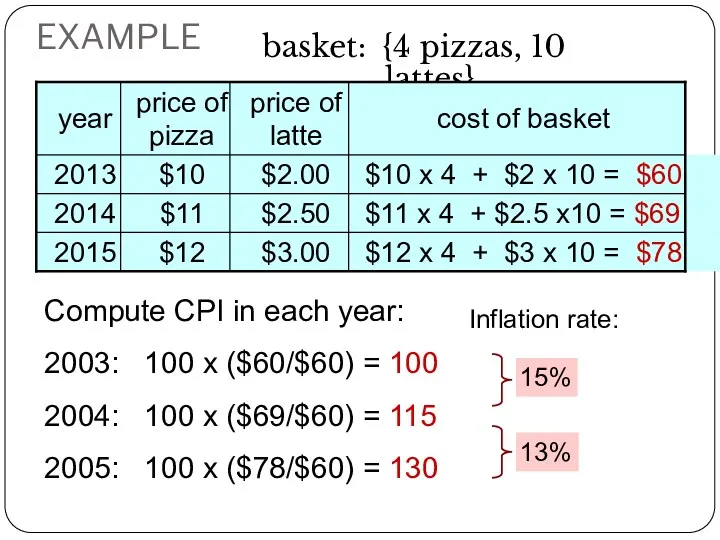
EXAMPLE
basket: {4 pizzas, 10 lattes}
$12 x 4 + $3 x 10
EXAMPLE
basket: {4 pizzas, 10 lattes}
$12 x 4 + $3 x 10
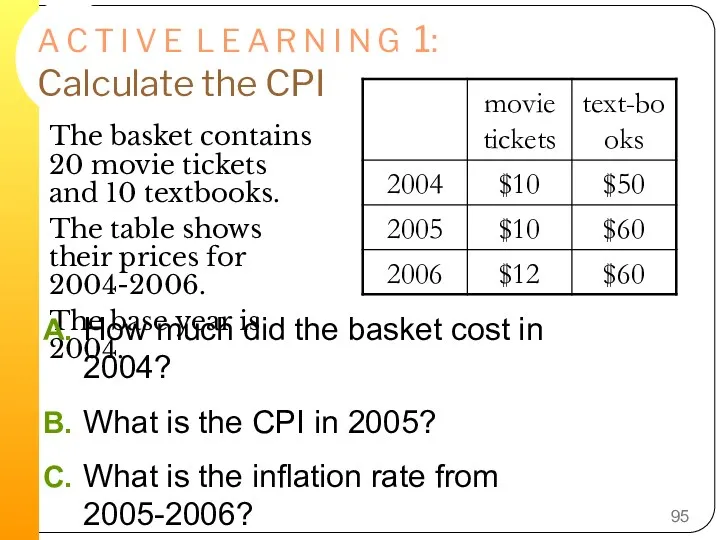
A C T I V E L E A R N
A C T I V E L E A R N
A C T I V E L E A R N
A C T I V E L E A R N
A C T I V E L E A R N
A C T I V E L E A R N
A C T I V E L E A R N
A C T I V E L E A R N
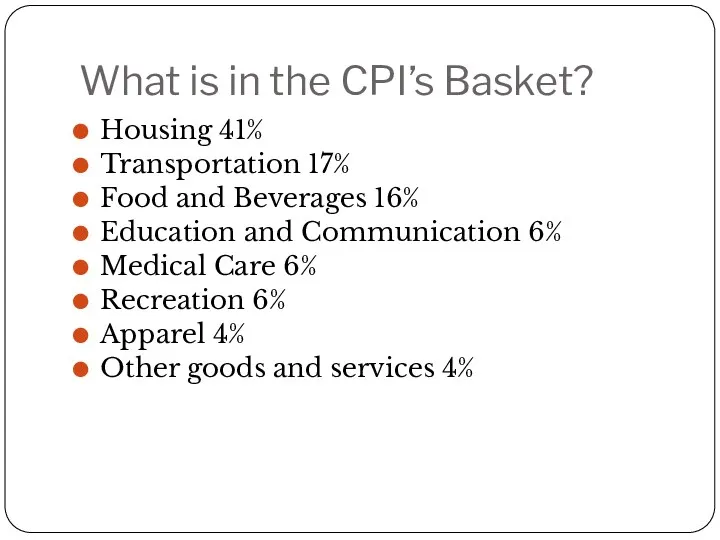
What is in the CPI’s Basket?
Housing 41%
Transportation 17%
Food and Beverages 16%
Education
What is in the CPI’s Basket?
Housing 41%
Transportation 17%
Food and Beverages 16%
Education
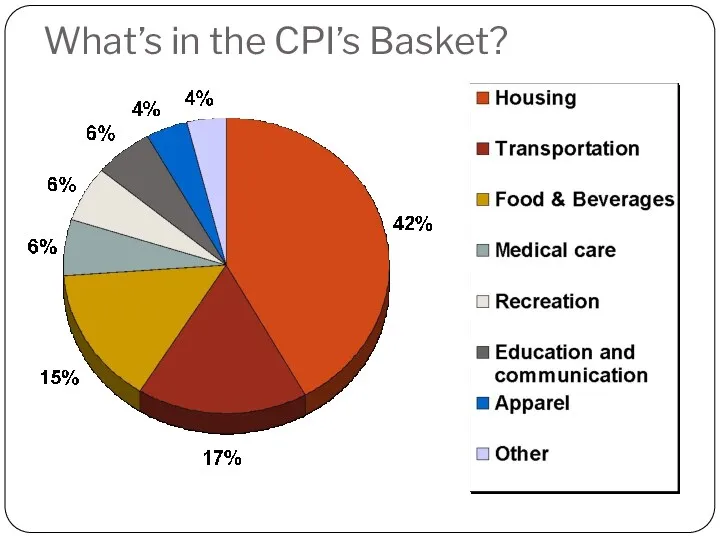
What’s in the CPI’s Basket?
What’s in the CPI’s Basket?
In the News: Shopping for the CPI
There are approximately 300 employees
In the News: Shopping for the CPI
There are approximately 300 employees
The Producer Price Index
Producer Price Index – a measure of the
The Producer Price Index
Producer Price Index – a measure of the
Problems in Measuring the Cost of Living
Substitution Bias
When the price of
Problems in Measuring the Cost of Living
Substitution Bias
When the price of
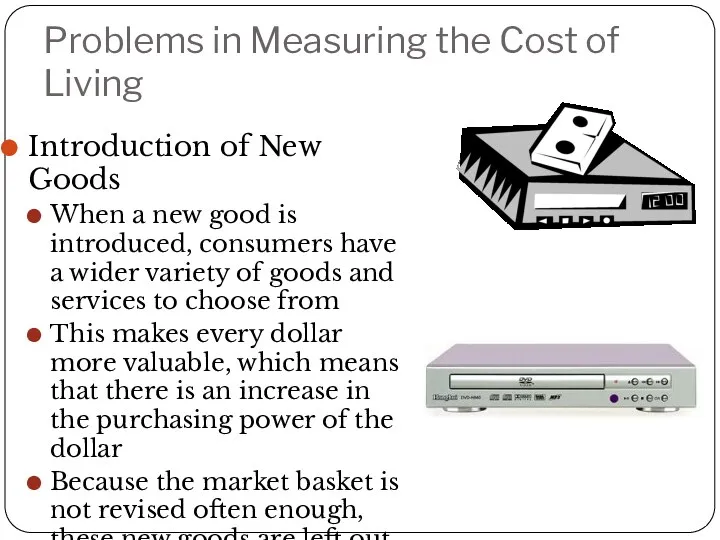
Problems in Measuring the Cost of Living
Introduction of New Goods
When a
Problems in Measuring the Cost of Living
Introduction of New Goods
When a
Problems in Measuring the Cost of Living
Unmeasured Quality Change
If the quality
Problems in Measuring the Cost of Living
Unmeasured Quality Change
If the quality
Problems in Measuring the Cost of Living
The size of these problems
Problems in Measuring the Cost of Living
The size of these problems
The GDP Deflator versus the Consumer Price Index
The GDP Deflator reflects
The GDP Deflator versus the Consumer Price Index
The GDP Deflator reflects
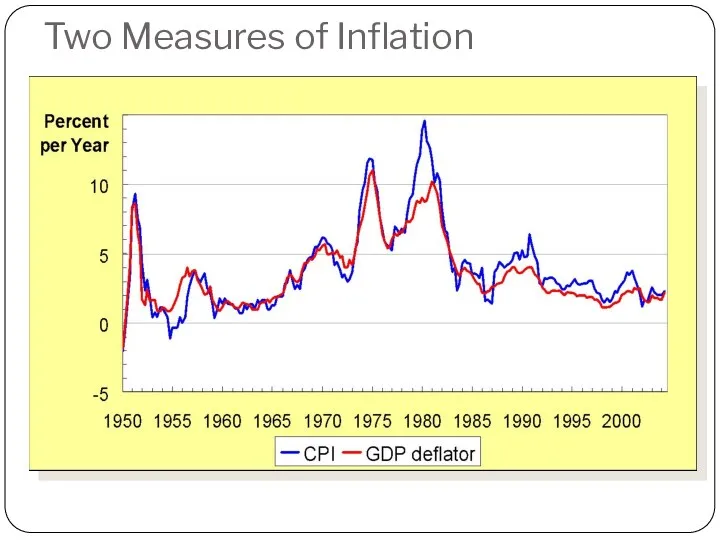
Two Measures of Inflation
Two Measures of Inflation
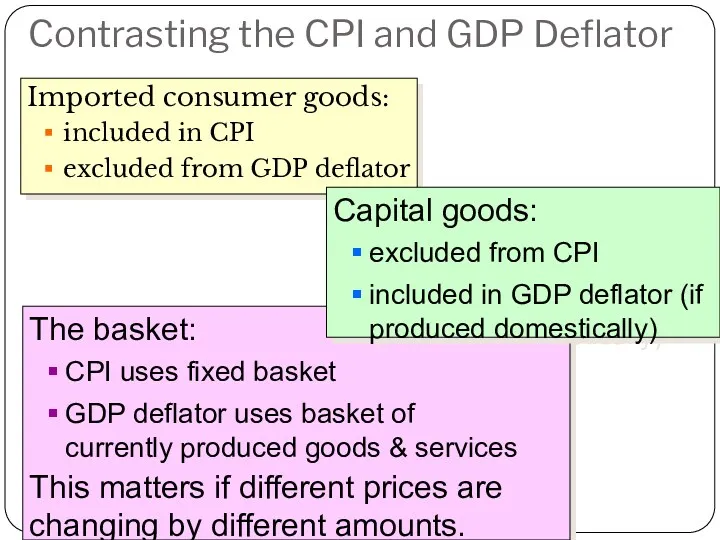
Contrasting the CPI and GDP Deflator
Imported consumer goods:
included in CPI
excluded
Contrasting the CPI and GDP Deflator
Imported consumer goods:
included in CPI
excluded
A C T I V E L E A R N
A C T I V E L E A R N
A C T I V E L E A R N
A C T I V E L E A R N
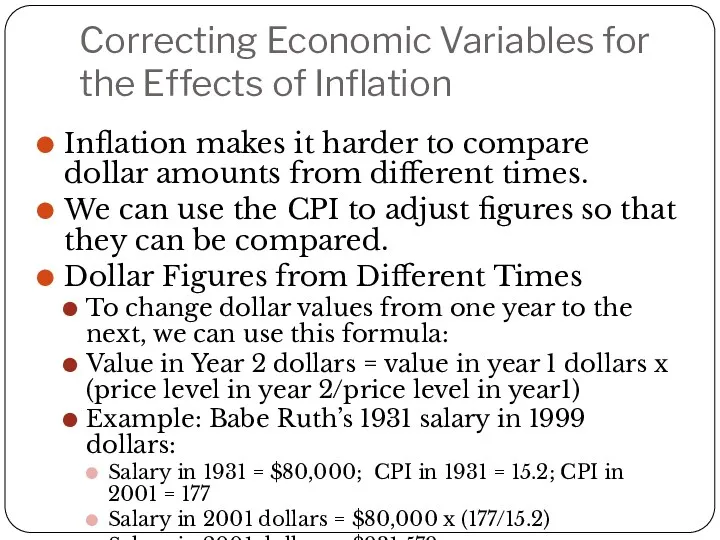
Correcting Economic Variables for the Effects of Inflation
Inflation makes it harder
Correcting Economic Variables for the Effects of Inflation
Inflation makes it harder
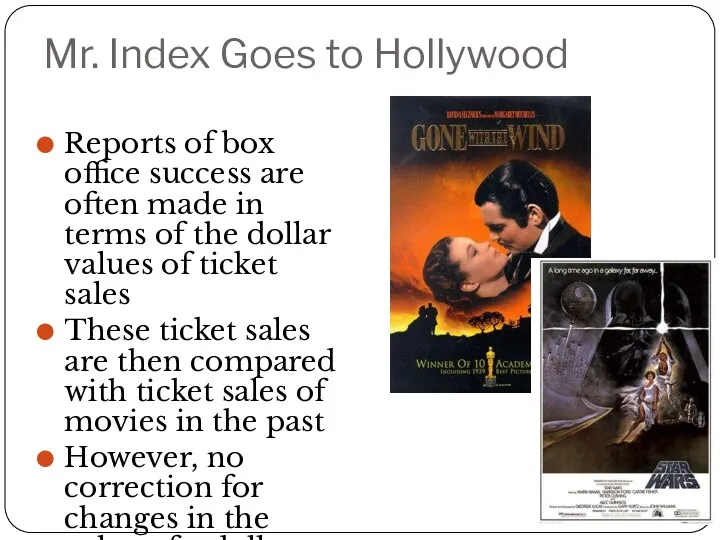
Mr. Index Goes to Hollywood
Reports of box office success are
Mr. Index Goes to Hollywood
Reports of box office success are
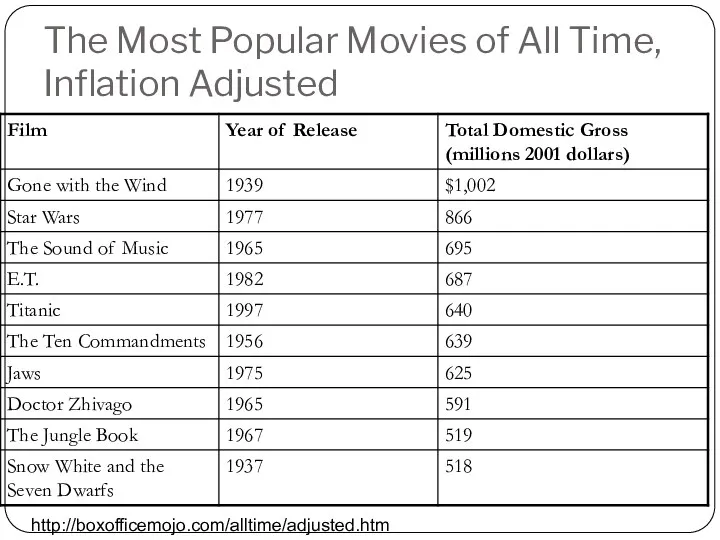
The Most Popular Movies of All Time, Inflation Adjusted
http://boxofficemojo.com/alltime/adjusted.htm
The Most Popular Movies of All Time, Inflation Adjusted
http://boxofficemojo.com/alltime/adjusted.htm
A C T I V E L E A R N
A C T I V E L E A R N
A C T I V E L E A R N
A C T I V E L E A R N
Indexation
Indexation – the automatic correction of a dollar amount for the
Indexation
Indexation – the automatic correction of a dollar amount for the
Real And Nominal Interest Rates
Nominal interest rate – the interest rate
Real And Nominal Interest Rates
Nominal interest rate – the interest rate
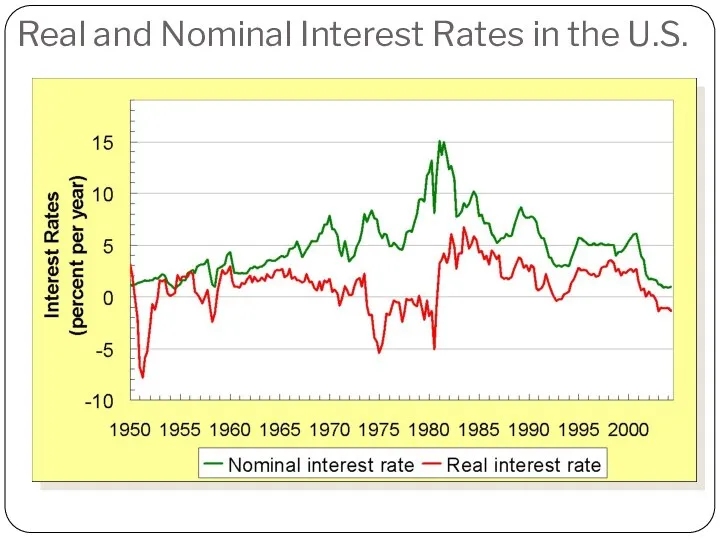
Real and Nominal Interest Rates in the U.S.
Real and Nominal Interest Rates in the U.S.
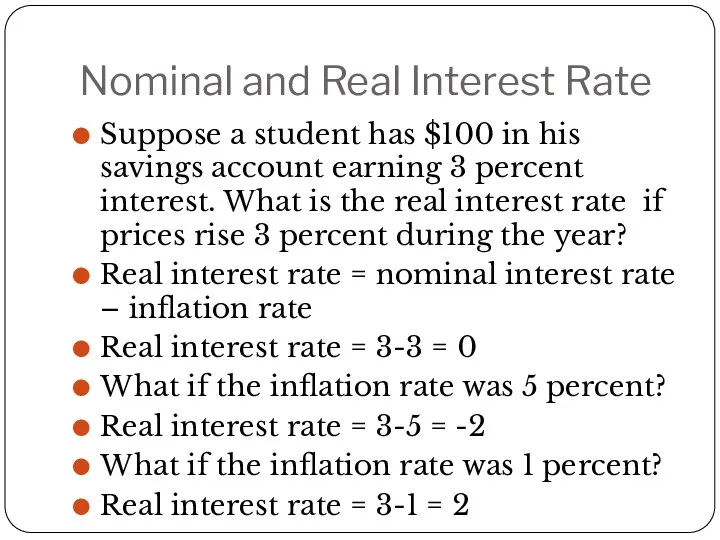
Nominal and Real Interest Rate
Suppose a student has $100 in his
Nominal and Real Interest Rate
Suppose a student has $100 in his
 Спрос и предложение
 Институциональная экономика. Лекция 9. Теория контрактов
 Преступления в сфере экономической деятельности. Тема 26
 Фирмы в рыночной экономике
 Методическая разработка урока Лауреаты Нобелевской премии по экономике в 10 классе социально-экономического профиля
 Инфляция (виды, причины и последствия)
 Ресурсы хозяйствующих субъектов и эффективность их использования
 Ценовая политика предприятия
 Бизнес-модель, бюджет проекта и его экономические показатели
 Лекция по мировой экономике
 Технология продажи
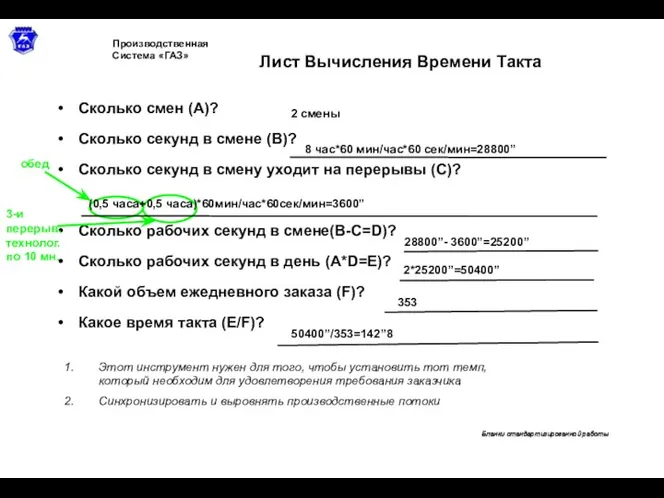 Лист вычисления времени такта
 Корпоративная социальная ответственность бизнеса в России и в Европе (на примере Google)
 Экономика. Товары и услуги. Ресурсы и потребности. 9 класс
 Основы теории спроса и предложения
 Издержки производства, доход и прибыль фирмы
 Введение в экономическую теорию
 Мировое хозяйство в период НТР
 Экономика Австралии
 Экономика Турции
 Рынки факторов производства. Модуль 5
 Социальные факторы формирования заработной платы
 О социально-экономическом развитии Беломорского муниципального района по итогам 2021 года и задачах на 2022 год
 Голодная планета
 Экономические циклы. Безработица
 Совокупный спрос и совокупное предложение
 Проектирование агрегатного участка дилерского центра ООО Сфера KIA
 Қазақстадағы шетел мұнай компанялары